Abstract
Free full text

Interaction of Common Azole Antifungals with P Glycoprotein
Abstract
Both eucaryotic and procaryotic cells are resistant to a large number of antibiotics because of the activities of export transporters. The most studied transporter in the mammalian ATP-binding cassette transporter superfamily, P glycoprotein (P-gp), ejects many structurally unrelated amphiphilic and lipophilic xenobiotics. Observed clinical interactions and some in vitro studies suggest that azole antifungals may interact with P-gp. Such an interaction could both affect the disposition and exposure to azole antifungal therapeutics and partially explain the clinical drug interactions observed with some antifungals. Using a whole-cell assay in which the retention of a marker substrate is evaluated and quantified, we studied the abilities of the most widely prescribed orally administered azole antifungals to inhibit the function of this transporter. In a cell line presenting an overexpressed amount of the human P-gp transporter, itraconazole and ketoconazole inhibited P-gp function with 50% inhibitory concentrations (IC50s) of ~2 and ~6 μM, respectively. Cyclosporin A was inhibitory with an IC50 of 1.4 μM in this system. Uniquely, fluconazole had no effect in this assay, a result consistent with known clinical interactions. The effects of these azole antifungals on ATP consumption by P-gp (representing transport activity) were also assessed, and the Km values were congruent with the IC50s. Therefore, exposure of tissue to the azole antifungals may be modulated by human P-gp, and the clinical interactions of azole antifungals with other drugs may be due, in part, to inhibition of P-gp transport.
Although the cell membrane is an efficient barrier to hydrophilic molecules, many amphiphilic compounds diffuse through the domains of the bilayer. Therefore, active mechanisms exist to protect cells from intrusion from amphiphilic molecules, some of which may possess potentially harmful biological qualities. The active efflux of a wide spectrum of xenobiotics from procaryotic as well as eucaryotic cells confers resistance to a large number of antibiotics and is known as multidrug resistance (MDR) (24). Active MDR is largely conferred by ATP-binding cassette (ABC) transporters, which can contribute significantly to drug disposition and resistance to therapy, as well as to acquired bacterial and mammalian resistance. These transporters recognize a broad variety of xenobiotics, including drugs. Of the various forms of mammalian ABC transporters, P-glycoprotein (P-gp) has received the most attention, as it plays a major role in the disposition of many drugs and is the most ubiquitous (9–12). The product of the MDR1 gene, P-gp, is an ~170-kDa phosphorylated glycoprotein. Other members of this family include the MDR proteins (MRP1, MRP2, MRP3, etc.).
These transport proteins are ATP-driven pumps that remove xenobiotics from the interiors of mammalian cells. Expression of P-gp in normal human tissues—particularly within the cellular membranes of the gastrointestinal tract, liver, blood-brain barrier, adrenals, and kidneys—suggests that the enzyme plays a role in cellular protection as well as in secretion and/or disposition (10). While the primary function of this protein is unknown, its ability to confer resistance to a wide variety of structurally and chemically unrelated compounds remains impressive. Indeed, the list of substrates that this transporter tolerates or accepts now appears to be similar to that for cytochrome P450 3A4 (CYP3A4), the predominant intestinal and hepatic cytochrome P450 oxygenase, and may even prove to recognize more substrates.
As a member of the ABC superfamily of transporters, P-gp possesses two ATP binding sites and uses ATP (via hydrolysis) as the source of energy for the “translocation” of substrates. The substrates enter from the lipid bilayer (27) and can bind to two (or more) nonidentical sites (35). Moreover, allosteric and perhaps synergistic effects have been observed for certain substrate combinations and conditions (36).
Although drug interactions mediated by P-gp are difficult to distinguish from those mediated by CYP3A4, coadministration of azole antifungals with other CYP3A4 and/or P-gp substrates is known to cause many clinical effects (32). Lovastatin monotherapy has an ~0.1% risk of causing skeletal muscle toxicity that dramatically increases when lovastatin (a P-gp substrate) (37) is combined with drugs such as cyclosporine, itraconazole, ketoconazole, or erythromycin (14). In vitro studies suggest that ketoconazole is an inhibitor of P-gp on the basis of the reversal of resistance and enhanced retention of marker substrates in a multidrug-resistant cell line (29). The transport of some compounds by kidney and intestinal cell monolayers has been affected by ketoconazole (17, 38), which competed with verapamil binding to Caco-2 cells with a 50% inhibitory concentration (IC50) of 13 μM (5). However, ketoconazole inhibited polarized transport of the P-gp/CYP3A4 substrate K02 in MDR1-MDCK cells with an IC50 of 119 μM (40), and 100 μM ketoconazole only weakly inhibited rhodamine 123 (Rho) transport across a Caco-2 cell monolayer and everted rat ileum (39).
Itraconazole is suggested to be a P-gp substrate because of increased brain accumulation in mdr1a−/− mice deficient in P-gp (21). Itraconazole can also reverse resistance to the P-gp substrate daunorubicin (DNR) in a murine acute leukemia cell line in vitro (multidrug-resistant cells) (13), while the methylthiazolyl diphenyltetrazolium bromide (MTT) cytotoxicity assay results suggest an interaction of itraconazole with MDR and/or multidrug resistance protein (MRP)-associated resistance because of resistance reversal (18). The transport of vinblastine, DNR, and doxorubicin is affected by 100 μM itraconazole in cells transfected with MDR1 cDNA (31). Furthermore, clinical interactions have been reported following coadministration of itraconazole with vincristine (2), DNR (13, 33), quinidine (16), or digoxin (15), all of which, it has been asserted, are P-gp substrates (with the first three being well characterized). Lovastatin concentrations increased more than 20-fold when it was coadministered with itraconazole (22). The oral bioavailability of simvastatin is also significantly increased by treatment with itraconazole or cyclosporine (3, 19, 23, 25). In contrast to the effects caused by ketoconazole and itraconazole, fluconazole did not inhibit the transport of digoxin across MDCK cell monolayers (38).
The objective of the present study was to quantify the interactions of these commonly prescribed azole antifungals with the MDR1 ABC transporter P-gp. Using two different methods of assessment, we show herein the distinct interaction by all antifungals except fluconazole.
MATERIALS AND METHODS
Chemicals.
Itraconazole was obtained from Schering-Plough compound resources. Ketoconazole, DNR, verapamil, colchicine, cyclosporine A, mannitol, dithiothreitol, ATP disodium, ammonium molybdate, ascorbic acid, sodium meta-arsenite, aprotinin, leupeptin, EGTA, EDTA, HEPES, ouabain, phenylmethylsulfonyl fluoride, and TRIZMA base were purchased from Sigma Chemical Co. (St. Louis, Mo.). Fluconazole was purchased from ICN Pharmaceuticals (Costa Mesa, Calif.). Hanks’ balanced salt solution, alpha minimum essential medium, Dulbecco’s modified minimal essential medium, penicillin-streptomycin, fetal bovine serum, and trypsin-EDTA were obtained from Life Technologies, Inc. (Rockville, Md.). Sodium orthovanadate was purchased from Pfaltz & Bauer Inc. (Waterbury, Conn.). Microplates (96-well; Fisher), plastic tubes, and cell culture flasks (75 cm2) were purchased from Corning Inc. (Corning, N.Y.). All other reagents were of the highest grade commercially available.
Cell lines.
The CR1R12 cell line, provided by Alan Senior (University of Rochester), was maintained in complete alpha minimum essential medium supplemented with 10% fetal bovine serum and penicillin-streptomycin (50 U and 50 μg/ml, respectively) in a 5% CO2-95% air atmosphere at 37°C. Colchicine (0.5 μg/ml) was added to the culture medium. The NIH-3T3-G185 cell line, which contains the gene product of human MDR1, was licensed from the National Institutes of Health (NIH) and maintained in Dulbecco’s modified minimal essential medium. Colchicine (60 ng/ml) was added to the culture medium. The cells were grown to 80 to 90% confluency and were treated with trypsin-EDTA before subculture.
Flow cytometry with a fluorescence-activated cell sorter.
Fluorescence measurements of individual cells were performed with a FACScalibur fluorescence-activated cell sorter (Becton Dickinson, San Jose, Calif.) equipped with an UV argon laser (band-pass filters with an excitation wavelength at 488 nm and emission wavelengths at 530 and 570 nm with 30-nm band-pass filters). Analysis was gated to include single viable cells on the basis of their forward and side light scatters and was based on the acquisition of data for 10,000 cells. Log fluorescence was collected and was displayed as a single-parameter histogram. A direct functional assay for the P-gp efflux pump in CR1R12 cells was performed with the flow cytometer (34).
Cell viability test.
Cell viability was assessed using exclusion of 0.4% trypan blue as well as propidium iodide staining. Dead cells in which propidium iodide was bound to double strands of DNA or RNA were detected in certain regions of the cytometry dot plots, and data for these cells were not included in the final calculations.
Calculation of relative fluorescence.
The DNR fluorescence intensities of individual cells were recorded as histograms. The mean fluorescence intensity for 10,000 cells was used for comparison of different conditions. Vanadate and cyclosporine A were selected as positive controls and were used to normalize the measurements because these compounds can maximally inhibit the P-gp-mediated active efflux of DNR and Rho, respectively. Relative fluorescence was used for quantitation and comparison of the different compounds. The relative fluorescence (percent maximal inhibition or percent inhibition of the reference standard) represents a ratio obtained through the following formula: (geometric mean fluorescence of a discrete sample/geometric mean fluorescence in the presence of 5 mM vanadate or 50 μM cyclosporine A) × 100.
Membrane microsome preparations.
CR1R12 cell membranes enriched with the MDR1 gene product transport enzyme were used for preparation of membrane microsomes. Cells were washed with complete Hanks’ buffer before being resuspended in 10 ml of lysis buffer (50 mM Tris-HCl, 50 mM mannitol, 2 mM EGTA, 2 mM dithiothreitol [pH 7.0 at 25°C]) containing protease inhibitors (1 mM phenylmethylsulfonyl fluoride, 10 μg of aprotinin per ml, 10 μg of leupeptin per ml). All subsequent steps were performed at 4°C. The cells were lysed twice by nitrogen cavitation (Kontes Glass Co., Vineland, N.J.) at 500 lb/in2 for 15 min. Nuclei and mitochondria were sedimented by centrifugation at 4,000 × g for 10 min. The microsomal membrane fraction was then sedimented by centrifugation at 100,000 × g for 60 min. The pellet was resuspended in 0.25 M sucrose buffer (10 mM Tris-HCl, 1 mM EDTA [pH 7.5]) and homogenized with a Potter-Elvehjem homogenizer. Aliquots of the membrane microsomes were rapidly frozen and were stored at −80°C until analysis. Protein content was determined by a microassay adaptation of the Lowry method (37).
ATP hydrolysis and phosphate release.
The consumption of ATP was quantified by determining the amount of inorganic orthophosphate, which forms a color complex with molybdate, that was liberated (4, 35). We have modified an ATP hydrolysis assay, based on determination of the amount of phosphate released, using membrane microsome preparations; the assay was carried out in a 96-well microplate (35). The microsomes were thawed on ice prior to dilution to 3.5 μg of protein per well in ice-cold ATPase buffer (3 mM sodium ATP, 50 mM KCl, 10 mM MgSO4, 3 mM dithiothreitol, 50 mM Tris-HCl [pH 7.0]) containing 0.5 mM EGTA (to inhibit Ca-ATPase), 0.5 mM ouabain (to inhibit the Na- and K-ATPases), and 3 mM sodium azide (to inhibit the mitochondrial ATPase). The total incubation volume including the various inhibitors was 100 μl. The incubation reaction was initiated by transferring the plate from ice to 37°C; the plate was incubated for 30 min, and then the reaction was terminated by the addition of 50 μl of a 12% sodium dodecyl sulfate solution at room temperature, followed by the addition of 50 μl of a mixture (in equal volumes) of 18% fresh ascorbic acid in 1 N HCl and 3% ammonium molybdate in 1 N HCl. After 4 min, 100 μl of a solution of 2% sodium citrate and 2% sodium meta-arsenite in 2% acetic acid was added to fix the color formation. After 30 min of incubation at room temperature, the fixed and released phosphate was quantitated colorimetrically with a microplate reader (FL600; Bio-Tek, Winooski, Vt.) at 750 nm. By comparison to a standard curve, the amount of phosphate released—and hence, the amount of ATP consumed—was quantified. Water-insoluble drugs were dissolved in methanol or dimethyl sulfoxide; the maximum methanol or dimethyl sulfoxide concentration (2% [vol/vol]) was shown not to affect the ATPase activity.
RESULTS
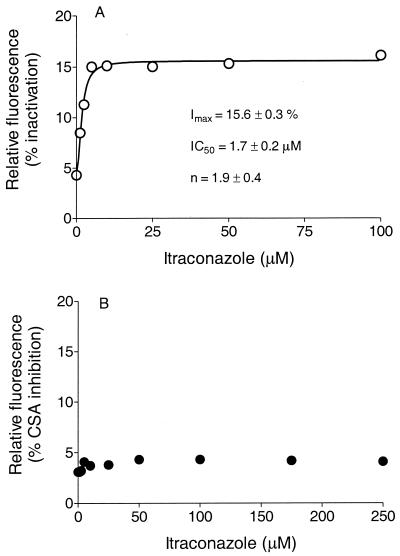
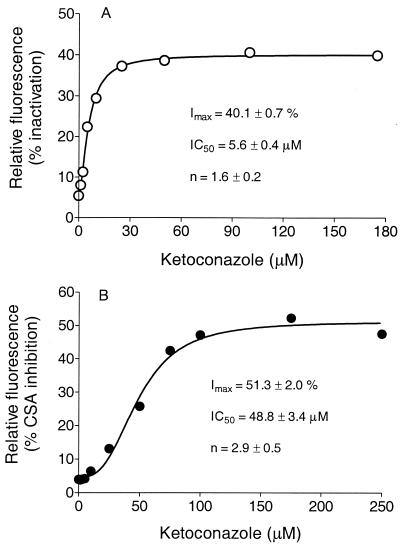
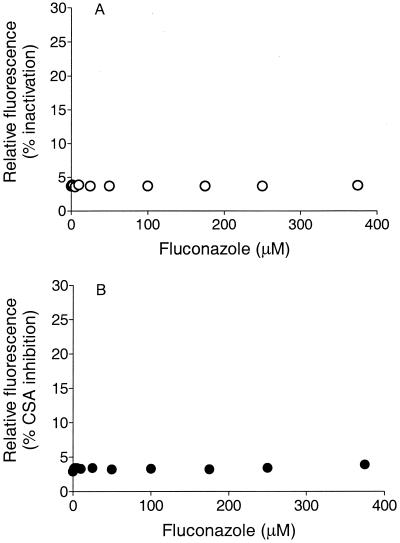
As fluorescent substrates transported by mammalian P-gp, DNR and Rho serve as markers for active transport function simply by measurement of the amount of fluorescence retained per cell (34). Herein we show that some azole antifungals can effectively inhibit the P-gp-mediated transport of DNR or Rho. The IC50 can be determined from a simple function, as shown in Fig. Fig.1,1, which shows the retained fluorescence for samples of viable cells measured with a flow cytometer at various concentrations of the antifungal. The concentration dependency of inhibition displayed a sigmoidal response curve (Fig. (Fig.1;1; see Fig. Fig.2),2), a consequence of cooperativity (36), with the Hill equation for allosteric interaction enzymes therefore being the appropriate function for fitting to the data: v = VmaxSn/(K′ + Sn), where v is the observed inhibition, Vmax is the maximum inhibition, Sn is the substrate concentration, and K′ is the IC50. The IC50 of itraconazole for DNR transport in the NIH-3T3-G185 cell line (which expresses the gene product of human MDR1) was ≈1.7 μM, and itraconazole could achieve about 16% of the maximal inhibition achieved with the reference standard (vanadate). An inhibition extent of ≈30% of the maximal (reference) inhibition can be achieved for many known P-gp substrates and inhibitors (34). Cyclosporin A inhibited this process with an IC50 of ≈1.4 μM. For example, the inhibition of DNR transport observed for the commonly used positive control P-gp inhibitor verapamil represented 40% of the complete inhibition observed for vanadate in the same experiment. As shown in Fig. Fig.1B,1B, itraconazole had no significant effect on the transport of Rho (another fluorescent marker). This result is likely due to the distinct binding sites on P-gp that have often been described (35, 36). Because these cell lines overexpress the respective transporter enzymes, the IC50 would be expected to be higher in these evaluations than under in vivo conditions, where far fewer copies of the enzyme would be contained per cell. Ketoconazole exhibited effects similar to those of itraconazole (ketoconazole IC50, ~6 μM), as shown in Fig. Fig.22 and summarized in Table Table1.1. Fluconazole, however, appeared to have no effect on the active efflux of DNR or Rho from this cell line and would therefore not be expected to be a significant inhibitor of the function of P-gp (Fig. (Fig.33).

Intracellular retention of DNR (A) or Rho (B) in G185 cells versus competing itraconazole concentration. Fluorescence intensity is expressed as relative fluorescence. The average number of cells per assay was 10,000. The function for the line through the data is the Hill equation: v = VmaxSn/(K′ + Sn). The parameters IC50 and Hill coefficient (n; with standard deviation) are shown on the respective graphs. Imax, a percentage of the complete inactivation that occurred with vanadate; CSA, cyclosporine A.

Intracellular retention of DNR (A) or Rho (B) in G185 cells versus competing ketoconazole concentration. Fluorescence intensity is expressed as relative fluorescence. The average number of cells per assay was 10,000. The function for the line through the data is the Hill equation: v = VmaxSn/(K′ + Sn). The parameters IC50 and Hill coefficient (n; with standard deviations) are shown on the respective graphs. Imax, a percentage of the complete inactivation that occurred with vanadate; CSA, cyclosporine A.

Intracellular retention of DNR (A) or Rho (B) in G185 cells versus competing fluconazole concentration. Fluorescence intensity is expressed as relative fluorescence. The average number of cells per assay was 10,000.
TABLE 1.
Inhibition parameters of P-gp-mediated transport of DNR or Rho in rodent multidrug-resistant cell line or cell line transfected with human MDR1
| Antifungal | Marker | IC50 (μM)a | Imax (%)ab | n (Hill coefficient)a |
|---|---|---|---|---|
| Itraconazole | DNR | 1.7 ± 0.2 | 16 ± 0.3 | 1.9 ± 0.4 |
| Itraconazole | Rho | NEc | NE | NA |
| Ketoconazole | DNR | 5.6 ± 0.4 | 40 ± 1 | 1.6 ± 0.2 |
| Ketoconazole | Rho | 49 ± 3.4 | 51 ± 2 | 2.9 ± 0.5 |
| Fluconazole | DNR | NE | NE | NA |
| Fluconazole | Rho | NE | NE | NA |
ATP hydrolysis.
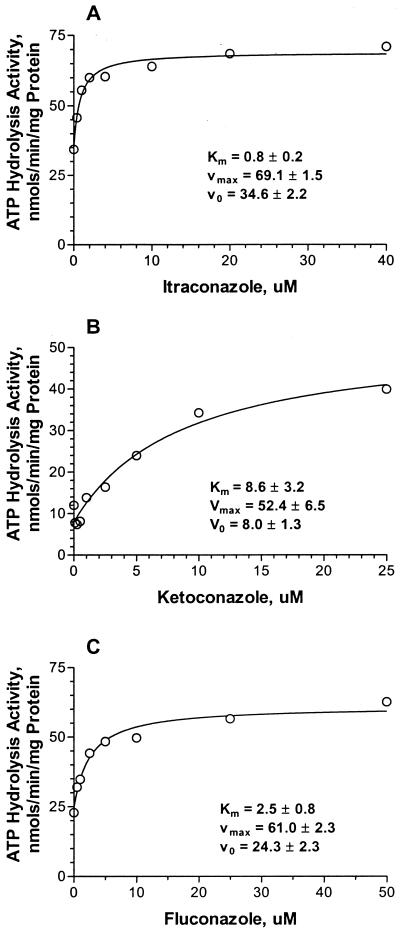
As ATP is consumed at a purported rate of about one or two molecules per transport event, the hydrolysis of ATP represents the transport activity or the transport function (1, 6, 28, 30, 35). Itraconazole caused a concentration-dependent increase in the rate of ATP hydrolysis relative to the baseline rate, indicating that as a substrate for P-gp it causes comparatively rapid hydrolysis (Fig. (Fig.4A).4A). The Km was ~0.8 μM, and the Vmax was about twofold above the baseline Vmax, as indicated in Table Table2.2. The presence of itraconazole with the membrane fraction from the parent cell line (CHO) resulted in no significant changes in ATP hydrolysis, thus serving as a negative control. Similarly, ketoconazole exhibited a Km of ~8 μM and a Vmax of about five times the baseline Vmax (Fig. (Fig.4B4B and Table Table2).2). Fluconazole appeared to be a substrate of medium efficiency for the P-gp transporter, as there was a change in the turnover rate, and the data suggested a Km of ~3 μM (with large confidence limits due to error) and a Vmax of about twofold above the baseline Vmax (Table (Table2).2). The results of the assay of ATP hydrolysis activity were consonant with those of the assays of transport function inhibition (described above), with the possible exception of the results for fluconazole.

P-gp-mediated ATP hydrolysis rates in the presence of itraconazole (A), ketoconazole (B), and fluconazole (C). The data were fit to a hyperbola. For itraconazole, Vmax was equal to 69 ± 1.5 nmol/min/mg of membrane protein, with Km equal to 0.8 ± 0.2 μM. For ketoconazole, Vmax was equal to 53 ± 7 nmol/min/mg membrane protein, with Km equal to 8.6 ± 3 μM. For fluconazole, Vmax was equal to 61 ± 2.3 nmol/min/mg membrane protein, with Km equal to 2.5 ± 1 μM. V0, initial velocity.
TABLE 2.
Kinetic parameters of ATP hydrolysis in the presence of azole antifungals
| Antifungal | Km (μM) | Vmax (nmol/min/mg) |
|---|---|---|
| Itraconazole | 0.8 ± 0.2 | 69 ± 2 |
| Ketoconazole | 8.6 ± 3 | 53 ± 7 |
| Fluconazole | 2.5 ± 1 | 61 ± 2 |
DISCUSSION
Azole antifungals are widely prescribed for chemoprophylaxis (20). Our results demonstrate the inhibition of the human P-gp transport function by some azole antifungals. The observed inhibition was concentration dependent, with IC50s of <2 μM for itraconazole and ~5 μM for ketoconazole when DNR was used as the marker substrate. Cyclosporin A was inhibitory with an IC50 of 1.4 μM in this system. These experiments used the NIH-3T3-G185 cell line, which expresses larger than normal quantities of the human P-gp transporter enzyme. Because these cell lines overexpress the transporter enzyme, the IC50 would be expected in these evaluations to be higher than those encountered under in vivo conditions, where far fewer copies of the enzyme would be contained per cell. ATP hydrolysis kinetics showed that itraconazole interacts with P-gp with a half-maximal saturation concentration of <1 μM. Since itraconazole, ketoconazole, and fluconazole are known to bind to CYP3A4 (although fluconazole binds only weakly) and since the substrate definitions for both CYP3A4 and P-gp are similar (diverse lipophilic structures with molecular weights of ~300 to 1,000) and, hence, share most substrates, it is not surprising that these azole antifungals would also bind to the substrate binding site of P-gp. Indeed, the structures typify the type II unit of three electron donor groups with a spatial separation of 4.6 ± 0.6 Å suggested by Seelig (26) as one of two general patterns for substrate recognition by P-gp (constructed from a structure-activity relationship study of known substrates of P-gp).
Clinical observations seem to indicate that the azole antifungals interact with the P-gp transporter. The concentrations of lovastatin, a P-gp substrate and inhibitor (37), in plasma increased more than 20-fold when it was coadministered with itraconazole (22). Furthermore, the oral bioavailability of simvastatin was also significantly increased by treatment with itraconazole or cyclosporine A (3, 19, 23, 25). Since itraconazole and cyclosporine A are both inhibitors of P-gp and CYP3A4, it is difficult to discern the dominant avenue of interaction.
In contrast to itraconazole and ketoconazole, fluconazole did not appear to inhibit the active transport of the marker substrates DNR and Rho by P-gp. Fluconazole may be a substrate for active transport by P-gp, with very slow passive diffusion across the membrane, thus impeding reentry and interaction with the substrate binding site (7, 8). Indeed, the fluconazole molecule is significantly shorter, smaller, and more hydrophilic than the other two antifungals considered herein.
Two of the azole antifungals tested in the present study (itraconazole and ketoconazole) are further examples of effective inhibitors or substrates of both P-gp and CYP3A4. Hence, resistance to antifungal treatment can be conferred by both of these enzymes. Since P-gp has a significant effect on the absorption and disposition of orally administered drugs, its role might be as significant as that of CYP3A4. Many, if not all, of the known clinical interactions with azole antifungals are with compounds that are substrates of P-gp, which therefore may be significant in terms of the observed clinical interactions. As several of these azole antifungals effectively inhibit the function of P-gp, clinical interactions may be expected with other high-affinity P-gp substrates.
Acknowledgments
We are grateful to Adriane L. Stewart for editorial assistance and Eleanor Johnson for comments.
REFERENCES
Articles from Antimicrobial Agents and Chemotherapy are provided here courtesy of American Society for Microbiology (ASM)
Full text links
Read article at publisher's site: https://doi.org/10.1128/aac.46.1.160-165.2002
Read article for free, from open access legal sources, via Unpaywall:
https://aac.asm.org/content/46/1/160.full.pdf
Citations & impact
Impact metrics
Citations of article over time
Alternative metrics
Smart citations by scite.ai
Explore citation contexts and check if this article has been
supported or disputed.
https://scite.ai/reports/10.1128/aac.46.1.160-165.2002
Article citations
Pharmacokinetics of olverembatinib (HQP1351) in the presence of a strong CYP3A4 inhibitor (itraconazole) or inducer (rifampin) in healthy volunteers.
Clin Transl Sci, 17(9):e70021, 01 Sep 2024
Cited by: 1 article | PMID: 39228016 | PMCID: PMC11371656
Clinical Pharmacokinetics and Pharmacodynamics of Letermovir in Allogenic Hematopoietic Cell Transplantation.
Clin Pharmacokinet, 63(7):945-964, 16 Jul 2024
Cited by: 0 articles | PMID: 39012618
Review
Interaction and potential mechanisms between atorvastatin and voriconazole, agents used to treat dyslipidemia and fungal infections.
Front Pharmacol, 14:1165950, 11 May 2023
Cited by: 2 articles | PMID: 37251310 | PMCID: PMC10213937
A Unique In Vitro Assay to Investigate ABCB4 Transport Function.
Int J Mol Sci, 24(5):4459, 24 Feb 2023
Cited by: 4 articles | PMID: 36901890 | PMCID: PMC10003010
Kidney Drug Transporters in Pharmacotherapy.
Int J Mol Sci, 24(3):2856, 02 Feb 2023
Cited by: 4 articles | PMID: 36769175 | PMCID: PMC9917665
Review Free full text in Europe PMC
Go to all (142) article citations
Data
Similar Articles
To arrive at the top five similar articles we use a word-weighted algorithm to compare words from the Title and Abstract of each citation.
Mechanisms of resistance to azole antifungal agents in Candida albicans isolates from AIDS patients involve specific multidrug transporters.
Antimicrob Agents Chemother, 39(11):2378-2386, 01 Nov 1995
Cited by: 496 articles | PMID: 8585712 | PMCID: PMC162951
Inhibition of P-glycoprotein transport function by grapefruit juice psoralen.
Pharm Res, 18(4):432-438, 01 Apr 2001
Cited by: 42 articles | PMID: 11451028
Inhibitory Potential of Antifungal Drugs on ATP-Binding Cassette Transporters P-Glycoprotein, MRP1 to MRP5, BCRP, and BSEP.
Antimicrob Agents Chemother, 60(6):3372-3379, 23 May 2016
Cited by: 52 articles | PMID: 27001813 | PMCID: PMC4879353
Effects of the antifungal agents on oxidative drug metabolism: clinical relevance.
Clin Pharmacokinet, 38(2):111-180, 01 Feb 2000
Cited by: 294 articles | PMID: 10709776
Review


