| PMC full text: | Published online 2000 Feb 29. doi: 10.1073/pnas.050004797
|
Figure 3

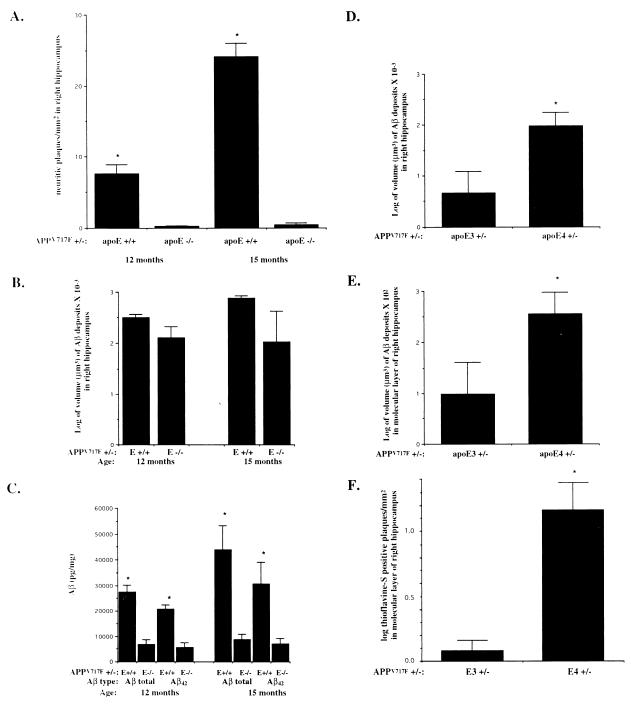
Quantitation of neuritic plaques, hippocampal Aβ, and thioflavine-S-positive deposits in APPV717F +/− TG mice expressing mouse, human, or no apoE. (A) Hippocampal neuritic plaques were prominent in APPV717F +/−, apoE+/+ mice at 12 months and increased by more than 3-fold by 15 months of age (n = 4, both time points). In APPV717F +/−, apoE−/− mice (n = 6, both time points), neuritic plaques were virtually absent and did not increase in number between 12 and 15 months of age (*, P < 0.0001 compared with apoE−/−). Neuritic plaques were identified with the de Olmos method. (B) The total volume of Aβ-IR deposits in the right hippocampus was determined in APPV717F +/− TG mice that were apoE+/+ (n = 4) or apoE−/− (n = 6) at 12 months of age and apoE+/+ (n = 4) or apoE−/− (n = 6) at 15 months of age. Volume of Aβ deposits was determined by using unbiased stereological methods. There was no statistical difference in the size of the right hippocampus between any of the groups of mice (data not shown). (C) Aβ ELISA for total Aβ and Aβ42 was assessed in the left hippocampus from the same mice used in A. *, P < 0.05, comparing apoE+/+ with apoE−/−. The total volume of Aβ-IR deposits in the right hippocampus (D) and in the molecular layer of dentate gyrus (E) was determined in APPV717F +/− TG mice that were either apoE3+/− (line 37, n = 6) or apoE4+/− (line 22, n = 9) at 15 months of age. Volume of Aβ deposits was determined by using unbiased stereological methods. There was no statistical difference in the size of the right hippocampus or the molecular layer of the dentate gyrus between the groups (data not shown). (F) The mean density of thioflavine-S-positive plaques was assessed in the molecular layer of the dentate gyrus of the same mice. *, P < 0.05 (D and E); *, P < 0.001, comparing apoE3+/− with apoE4+/− (F). Data in B, D, E, and F were log-transformed and tested for normality before statistical analysis.


