| PMC full text: |
|
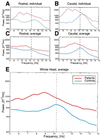
Figure 2
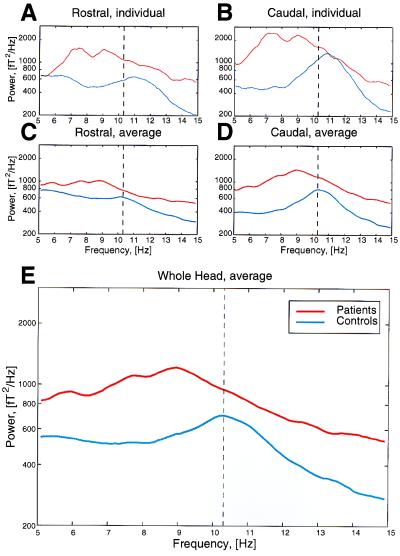
Power spectra for control subjects and patients. Spectra are shown for one representative control subject and for one Parkinson patient (A and B); and for the average of all controls and all patients (C–E). The power was averaged over all rostral MEG channels (A and C), over all caudal channels (B and D), and averaged over all 148 channels for the entire brain (E). Note the shift toward the θ range and the increase in global power in the patient population. Also note small bumps in the 5- to 10-Hz range in the patients, indicating distinct peaks, depending on the pathology or level of severity. Dashed line indicates maximum of averaged α activity in controls.
