| PMC full text: | Cell Host Microbe. Author manuscript; available in PMC 2009 Apr 16. Published in final edited form as: Cell Host Microbe. 2008 Oct 16; 4(4): 337–349. doi: 10.1016/j.chom.2008.09.009 |
Figure 5

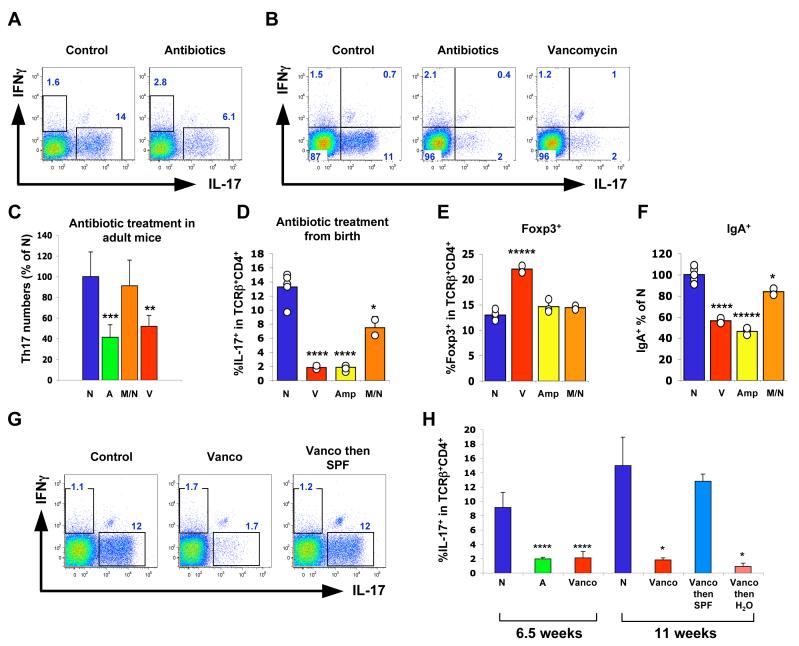
(A, C) Th17 cells in SI LP of 16-week-old C57BL/6 mice treated with antibiotics in the drinking water for 4 weeks. In (A), all four antibiotics were included. In (C), N — no treatment (N=9), A — all four antibiotics (N=6), M/N — metronidazole plus neomycin sulfate (N=9), V — vancomycin only (N=6). 2-3 independent experiments for each condition were performed with similar results. Combined histograms from all experiments (C) as well as representative plots from individual mice gated on TCRβ+CD4+ lymphocytes (A) are shown.
(B, D, E) Lamina propria lymphocyte populations in mice treated with antibiotics in the drinking water from birth. Representative data from individual mice (gated on TCRβ+CD4+ lymphocytes) are shown from one of multiple experiments. Error bars represent standard deviation of the mean. N — no treatment, V — vancomycin only, Amp — Ampicillin only, M/N — metronidazole plus neomycin sulfate.
(F) Relative proportions of IgA+ cells. Data were combined from two experiments. Percentage of IgA+ cells in the lymphocyte gate was calculated for each condition and the data are presented as percentage of the untreated control (N) mean value.
(G, H) Mice were treated with vancomycin (Vanco) or all four antibiotics (A) from birth. At 6.5 weeks of age some mice were transferred into cages with regular water with (Vanco then SPF) or without (Vanco then H2O) co-housing with SPF mice not treated with any antibiotics. Th17 cell numbers in the SI LP were analyzed 4.5 weeks later. Results shown are from one of two independent experiments with similar results. Individual mouse plots (G) were gated on TCRβ+CD4+ lymphocytes. Histogram (H) is from one of two independent experiments with similar results. N = 4 mice for the 6.5 week time point and N = 2 mice for the 11 week time point; error bars represent standard deviation of the mean. Statistics, unpaired Student t test. *p<0.05, ** p<0.01, *** p<0.005, ****p<0.001, *****p<0.0005. For the statistical analysis, in all cases the corresponding population was compared to the WT (untreated) control.


