Abstract
Free full text

From the Cover
A hyperfused mitochondrial state achieved at G1–S regulates cyclin E buildup and entry into S phase
Abstract
Mitochondria undergo fission–fusion events that render these organelles highly dynamic in cells. We report a relationship between mitochondrial form and cell cycle control at the G1–S boundary. Mitochondria convert from isolated, fragmented elements into a hyperfused, giant network at G1–S transition. The network is electrically continuous and has greater ATP output than mitochondria at any other cell cycle stage. Depolarizing mitochondria at early G1 to prevent these changes causes cell cycle progression into S phase to be blocked. Inducing mitochondrial hyperfusion by acute inhibition of dynamin-related protein-1 (DRP1) causes quiescent cells maintained without growth factors to begin replicating their DNA and coincides with buildup of cyclin E, the cyclin responsible for G1-to-S phase progression. Prolonged or untimely formation of hyperfused mitochondria, through chronic inhibition of DRP1, causes defects in mitotic chromosome alignment and S-phase entry characteristic of cyclin E overexpression. These findings suggest a hyperfused mitochondrial system with specialized properties at G1–S is linked to cyclin E buildup for regulation of G1-to-S progression.
Mitochondria are multifunctional organelles of changing morphology whose activities are intimately tied to cell physiology (1). Fragmented mitochondrial morphology, for example, correlates with apoptotic cytochrome c release, whereas tubular morphology promotes resistance to apoptotic stimuli (2). In a round of cell cycle, mitochondrial oxidative capacity is greater at late G1 than early G1 (3), and reduction of mitochondrial ATP production blocks G1-to-S phase progression in flies (4). Cell cycle regulators controlling G1–S transition of the cell cycle are also known to affect mitochondrial function and/or shape (5, 6).
These findings raise the question of whether changes in mitochondrial form actually play a role in the regulation of cell cycle events. Although attempts have been made to investigate this question (7, 8), no study has been conclusive enough to determine whether changes in mitochondrial morphology are determinant of any cell cycle stage. These cell cycle stages include a long growth phase (G1), a DNA replicating phase (S), a short growth phase (G2), and cell division (mitosis, M). Progression through these stages is ensured by cell cycle control systems involving specific cyclins. For example, buildup of cyclin E at G1–S transition leads to the initiation of DNA replication, after which cells commit to mitosis (9). Indeed, cyclin E overexpression is sufficient to relieve the G1–S block induced by mitochondrial deficiency (4). Here, we use quantitative live-cell imaging and biochemical approaches to investigate whether mitochondria play a regulatory role in cell cycle control by cyclin E or other cyclins.
Results
Formation of a Giant Mitochondrial Network During G1-to-S Transition.
Mitochondria were visualized in normal rat kidney (NRK) cells stably expressing red fluorescent protein (RFP) targeted to the mitochondrial matrix. These cells, called mito-NRK, were contact-inhibited and under normal cell cycle control, like the parental NRK cells. High-resolution imaging reveals rapidly interchanging filamentous and fragmented mitochondrial forms in proliferating cells and distinct mitochondrial morphologies in cells arrested at different cell cycle stages (Fig. 1A and Movie S1). In mitosis, hundreds of fragmented mitochondria distribute throughout the cytoplasm. In G0, both filamentous and fragmented mitochondria occur. In G1–S, most surprisingly, mitochondria form a giant tubular network (Fig. 1A, G1–S) with tubular elements undergoing fission and fusion (Movie S2). Similar cell cycle mitochondrial phenotypes are seen in synchronized cells released from G0 by relief from serum starvation (Fig. 1B and Fig. S1), with fragmented/intermediate phenotypes in G1 shifting to tubular in G1–S, and back to fragmented/intermediate in S and G2–M. The specific mitochondrial phenotypes are also seen in unsynchronized cells progressing through the cell cycle (Fig. 1C, Movie S3 and SI Methods for cell cycle marker description), including within a single cell passing through G1–S (Fig. S2).
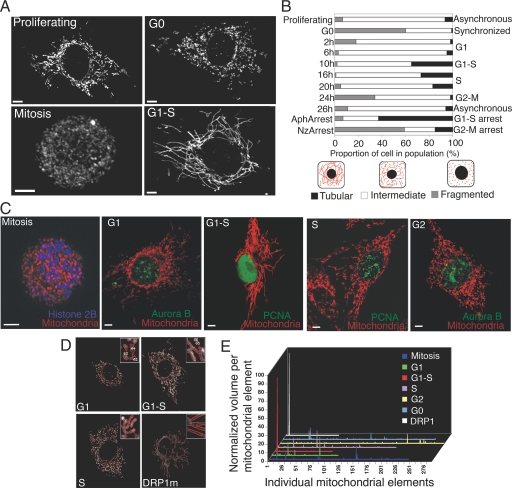
Formation of a giant mitochondrial network during G1-to-S transition. (A) 3D projection images of mito-NRK cells showing mitochondrial distribution in proliferating cells or cells arrested at different cell cycle stages. (B) Mitochondrial morphology in a cell population released from G0 into the cell cycle. At each time point, mitochondria in ≈250 cells were visually scored as tubular, fragmented, or intermediate, as in the diagram. Mitochondria in cells in G1–S and G2–M were also scored. (C) Images of mitochondria in live mito-NRK cells transfected with fluorescent protein-tagged versions of cell cycle-specific markers to identify different cell cycle stages (SI Methods). (Scale bars: 5 μm.) (D) Representative images for morphometric analysis of mitochondrial morphology in cells synchronized at different cell cycle stages or after expression of DRP1m-GFP. Individual mitochondria are bounded in red and numbered. (E) Plot of the volume of individual mitochondrial elements within individual cells. Morphometric information obtained from D was used after normalization with total mitochondrial volume within the cell.
Morphometric analysis of mitochondrial volume, performed by outlining the volume of individual mitochondrial elements across a 3D stack of single optical slices, revealed mitochondrial volumes in cells in G1, G2, S, G0, and mitosis distribute among many small elements (synchronization scheme in Fig. S3). By contrast, mitochondrial volume in cells at G1–S primarily associate with a single element (Fig. 1 D and E), similar to cells expressing a mutant (K38A) dynamin-related protein, DRP1m (also Movie S4), which prevents mitochondrial fission activity mediated by dynamin-related protein-1 (DRP1) (10). Mitochondria thus exhibit stage-specific cell cycle phenotypes, with mitochondria at G1–S unique in being primarily a single tubular element.
Characteristics of Mitochondria at G1–S.
A single, tubular mitochondrial element has not been considered a normal mitochondrial phenotype because it is rarely seen within cells (11). Its specific occurrence at the narrow window of G1–S transition, however, suggested it might serve particular cell cycle functions. So, we took a number of approaches to identify its specific characteristics.
We first investigated whether the tubular mitochondrial system at G1–S has a continuous matrix. A rectangular box across the mitochondrial network of a mito-NRK cell in G1–S or other stages/conditions was photobleached, and the kinetics of recovery of the expressed RFP-matrix molecule was measured (Fig. 2 A and B). Fluorescence recovers within 2 min to >60% of the prebleached level from adjacent mitochondrial areas in G1–S cells and cells expressing DRP1m. Virtually no recovery occurs in proliferating or mitotic cells. Mitochondria at G1–S thus have their outer and inner membranes fused sufficiently to give rise to a continuous matrix to permit the matrix markers to diffuse freely between mitochondrial elements.
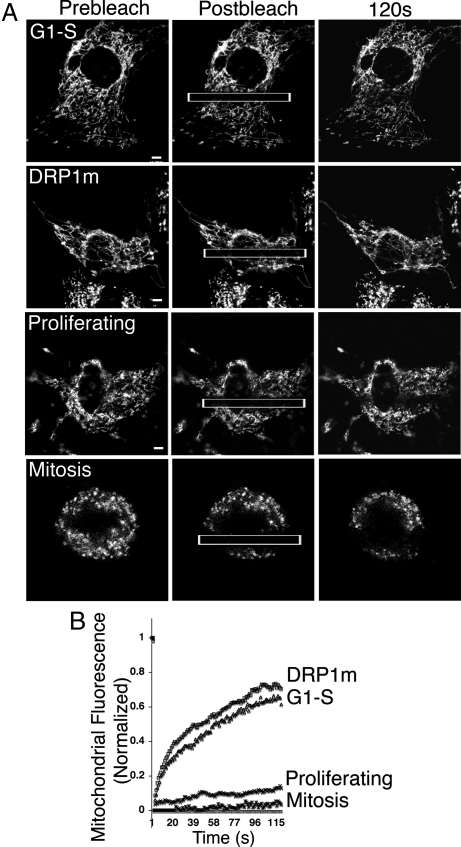
Mitochondria in cells at G1–S or in cells expressing DRP1m-expressing cells have a continuous matrix. (A) FRAP analysis for assaying mitochondrial matrix continuity in mito-NRK cells at different cell cycle stages or expressing DRP1m. Mitochondrial fluorescence was bleached in the rectangular box, and recovery of fluorescence into the bleached region from adjacent mitochondrial elements was monitored. Images at the prebleach, postbleach, and 120-s recovery point are shown. (B) Plot of recovery kinetics from the FRAP experiment shown in A. Comparable results were obtained from 3 or 4 separate experiments. (Scale bar: 5 μm.)
We next investigated whether the continuous mitochondrial system at G1–S has electrically continuous inner membranes. Mitochondria were loaded with tetramethylrhodamine ethylamine (TMRE), which incorporates specifically into mitochondrial membranes because of their transmembrane potential (12). A small region of interest (1 × 1 μm) of the TMRE-loaded mitochondria was irradiated by using a 2-photon laser. The cell was then monitored for TMRE loss from mitochondrial branches directly connected to the point of irradiation, indicative of spread of depolarization (13). In cells arrested at G1–S, depolarization at the irradiated point (Fig. 3A, arrow in preirradiation image) causes immediate TMRE loss in many mitochondrial elements throughout the cell (Fig. 3A, arrowheads in postirradiation image), indicating these elements are electrically continuous. As mitochondrial elements undergo fusion and fission, the depolarization spreads to most remaining mitochondrial elements (Movie S5). Measuring the amount of TMRE loss in the outlined box over time reveals the extent of TMRE loss after irradiation (Fig. 3B). On microirradiation in cells whose mitochondria are irreversibly fused together through expression of DRP1m, a similar, and even faster, spread of mitochondrial depolarization is observed (Fig. 3 A and B). By contrast, mitochondrial membrane depolarization is restricted to a small zone around the irradiated point in proliferating, mitotic, and G0 cells (Fig. 3 A and B). Thus, only mitochondria in cells at G1–S or in cells expressing DRP1m show rapid spread of membrane depolarization.
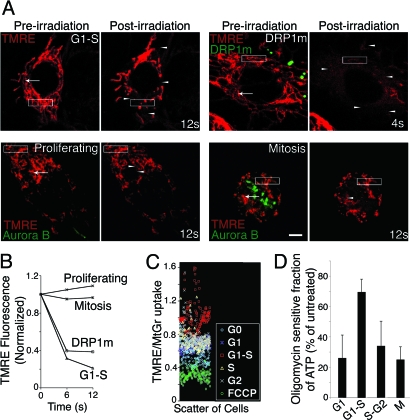
The giant tubular mitochondrial form at G1–S is electrically continuous and associated with increased membrane potential and elevated ATP production. (A) Microirradiation of TMRE-loaded mitochondria to measure electrical continuity of mitochondria by rapid spread of depolarization from an irradiated point (see Results). (Scale bar: 5 μm.) (B) Plot for loss of TMRE fluorescence during the microirradiation experiment. Fluorescence associated with the rectangular boxes in A before and after irradiation is plotted in each cell condition. Comparable results were obtained from 3 to 4 separate experiments. (C) Scatter plot of mitochondrial TMRE/MitoTracker Green uptake in individual cells from populations enriched in different stages of the cell cycle or in cells treated with FCCP (10 μM, 16 h) after 6 h of release from G0. Data points are color-coded according to their cell cycle stage. A total of 50 cells was counted for each condition in 3 independent experiments. (D) Contribution of mitochondrial ATP at different stages of cell cycle. At each stage, samples were treated with or without oligomycin (10 μg/mL for 4 h), and the absolute difference between the treated and untreated ATP values was then expressed as the percentage of the untreated value. Data derived from the average of 3 experiments are shown with the bars showing the standard deviation.
We further examined mitochondrial membrane potential (assessed by TMRE uptake) per unit of mitochondrial mass (determined by using MitoTracker Green) at different cell cycle stages (Fig. 3C). Normalization of TMRE signal with MitoTracker Green in this assay is essential because mitochondrial mass increases during the cell cycle. A predictable decrease in mitochondrial potential after membrane depolarization by the protonophore carbonyl cyanide p-trifluoromethoxyphenylhydrazone (FCCP) (14) is observed. Notably, when mitochondrial potential is monitored in cells at different cell cycle stages, the membrane potential is greatest at G1–S.
Oxygen consumption by mitochondria is reported to increase from early to late G1 (3). To test whether there is also a change in mitochondrial ATP production at G1–S, we measured levels of ATP at different cell cycle stages. Total ATP increases at G1–S (Fig. S4A), with mitochondrial ATP output (quantified as the fraction of total cellular ATP sensitive to oligomycin) significantly higher at G1–S compared with other stages of the cell cycle (Fig. 3D).
Mitochondrial Depolarization Specifically Blocks G1-to-S Cell Cycle Progression in a p53-Dependent Manner.
Previous work in flies has shown that reduction of cellular ATP caused by a mutation in a mitochondrial electron transport chain component triggers the p53-dependent G1–S checkpoint (4). Therefore, we investigated whether depolarizing mitochondria by FCCP treatment, which prevents the G1–S-associated increased mitochondrial ATP output, will trigger the p53-dependent G1–S checkpoint. Cells released from G0 without treatment show BrdU incorporation and Aurora B expression (Fig. 4A and Fig. S5), indicative of S-phase entry. FCCP-treated cells, however, neither incorporate BrdU nor express Aurora B in the nucleus, similar to cells in G0 (Fig. 4A). When cells in late G1 are treated with FCCP, proliferating cell nuclear antigen (PCNA) foci (indicative of S-phase entry) do not form, even after 10 h, unlike that in untreated cells, which form PCNA foci within 4 h (Fig. 4B). FACS analysis of DNA content in the FCCP-treated cells reveal cell enrichment of the G1 population, indicative of a G1–S block (Fig. S6A). Cells treated with FCCP on exit from mitosis, by contrast, continue further into G1 (Fig. 4C), and cells in S phase treated with FCCP still progress through this phase (albeit more slowly than control cells) (Fig. S6 B and C). This suggests that reducing mitochondrial potential by FCCP treatment specifically blocks progression from late G1 to S.
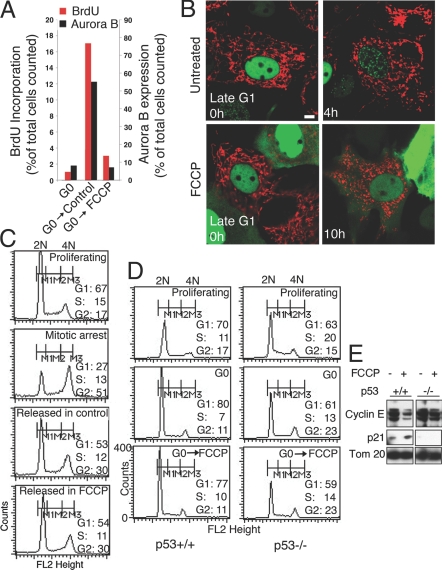
Depolarization of mitochondria causes a specific block in G1-to-S transition in a p53–p21-dependent manner. (A) Effect of FCCP on BrdU incorporation and Aurora B expression in a cell population at G0 (G0), or released from G0 for 6 h and maintained with or without in FCCP (10 μM) for 18 h (G0→control; G0→FCCP). The effect was measured in approximately ≈400 cells per condition. (B) Time-lapse images of mito-NRK cells expressing PCNA-GFP to detect G1-to-S progression in cells treated with or without FCCP. (Scale bar: 5 μm.) (C) FACS analysis of DNA content of NRK cells arrested in/before mitosis, and subsequently shifted into control medium with or without FCCP. Markers are M1 for G1; M2 for S phase; and M3 for G2; numbers represent the proportion of cells in these stages. (D) FACS analysis of DNA content in HCT116 cells (p53+/+ and p53−/−) on treatment with FCCP. Proliferating cells were arrested in G0 and then released in the presence of FCCP (10 μM, 18 h) (G0→FCCP). Numbers denote percentage of cells in G1, G2, and S. (E) Immunoblot analysis showing FCCP's effect on cyclin E and p21 levels, and its relationship to p53. Proliferating HCT116 cells (p53+/+ or p53−/−) were treated with FCCP for 18 h, and cell lysates were immunoblotted with relevant antibodies. Tom20 served as the loading control. Comparable results were obtained from 3 to 4 separate experiments.
FCCP treatment of NRK cells reduces total ATP levels by ≈30% (Fig. S4B), which could trigger the p53-dependent metabolic checkpoint at G1–S (15). To test whether FCCP-induced G1–S arrest was p53-dependent, we used isogenic HCT116 lines expressing or lacking p53 (16). Whereas both cell lines progress through S phase in a similar manner in the presence of FCCP (Fig. S6D), when FCCP is added after G0 release, G1–S arrest is observed in p53+/+ cells but not in p53−/− cells (Fig. 4D). The p53/p21 stress-sensing module is known to induce a G1–S block in stressed cells by preventing cyclin E accumulation/activity (17), so we monitored cyclin E and p21 expression levels in FCCP-treated, p53+/+ HCT116 cells. Both reduced cyclin E levels and increased p21 expression are observed (Fig. 4E and Fig. S7A for NRK cells). Hence, reducing mitochondrial transmembrane potential through FCCP treatment results in a p53-dependent G1–S arrest involving p21.
The Presence of Hyperfused Mitochondria Induces Cyclin E Buildup.
Levels of cyclin E rise in G1–S and then fall again in S phase in coordination with other cyclins (18). This allows cyclin E to play a specific role in S phase, including initiation of DNA replication. To investigate whether the transient formation of hyperfused mitochondria at G1–S and its subsequent breakdown into isolated tubular elements in S is linked to cyclin E regulation, we induced mitochondrial hyperfusion and then examined cyclin E levels within cells. Mitochondria were induced to become hyperfused through treatment with mdivi-1, a drug that tubulates mitochondria by specifically inhibiting the mitochondrial fission protein, DRP1 (19). We found that ≈50% of cells in an asynchronous population exhibit highly tubular mitochondria within 3 h of treatment (Fig. S8A). Longer mdivi-1 treatment (>5 h) results in more cells with highly fused mitochondria, but there is also increased cell death, so we restricted our experiments to 4 h of treatment. Notably, immunoblot analysis of mdivi-1-treated cells reveals a time-dependent increase in cyclin E levels over 4 h, with no change in cyclin A levels (Fig. 5A). Cyclin E levels also increase when hyperfused mitochondria are induced by DRP1m-GFP overexpression for 24 h in either NRK (Fig. 5B) or HCT116 cells (Fig. S7B). Thus, cellular cyclin E levels rise whenever mitochondria are hyperfused.
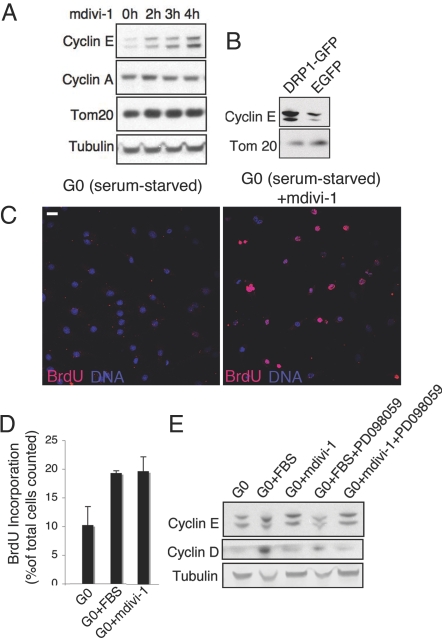
A hyperfused mitochondrial form leads to G0-to-S transition by increasing cyclin E levels independent of growth factors. (A) Immunoblot analysis for cyclin E and cyclin A during treatment with mdivi-1. Proliferating HCT116 cells were treated with mdivi-1 (50 μM) for the indicated times, and cell extracts were immunoblotted with the indicated antibodies. Tom20 and Tubulin served as controls. (B) Immunoblot analysis of cyclin E in NRK cells overexpressing DRP1m or EGFP. Tom20 served as loading control. (C) Immunofluorescence showing BrdU incorporation after treatment of cells in G0 with mdivi-1. NRK cells at G0 (serum starved) were treated with mdivi-1 (50 μM, 4 h) and assessed for BrdU incorporation (see Methods). (Scale bar: 20 μm.) (D) Quantification of BrdU incorporation induced by mdivi-1 treatment compared with that by serum treatment in HCT116 cells maintained at G0 (serum starved). BrdU incorporation was quantified in G0 (G0) cells treated with 10% FBS (G0+FBS) and in G0 cells treated with mdivi-1 (G0+mdivi-1). (E) Immunoblot analysis showing cyclin E induction by mdivi-1 treatment of G0 cells is independent of growth factor signaling. Analysis was performed by using HCT116 cells that were serum starved (G0); serum starved followed by addition of 10% FBS (G0+FBS); or serum starved followed by 50 μM mdivi-1 treatment for 4 h (G0+mdivi-1). Parallel G0 populations were first treated with PD098059 (50 μM, 45 min) before addition of FBS (G0+FBS+PD098059) or mdivi-1 (G0+mdivi-1+PD098059). Cell extracts were immunoblotted for cyclin E and cyclin D with tubulin serving as loading control.
Hyperfused Mitochondria Induce G0 Cells to Enter S Phase.
We next investigated whether cyclin E buildup in response to hyperfused mitochondria affects cell cycle progression. Normally, serum-starved cells remain in G0 indefinitely unless growth factors are added to induce signaling pathways for cyclin E buildup (20). Because inducing hyperfused mitochondria leads to increased cyclin E levels, we tested whether this was sufficient to drive serum-starved G0 cells into S phase in the absence of growth factors.
NRK cells in G0 were treated with mdivi-1 to prevent mitochondrial fission and thereby maintain mitochondria in a highly fused form. The cells were then monitored for BrdU incorporation to determine initiation of DNA replication. A considerable fraction of the serum-starved cells incorporate BrdU within 4 h of mdivi-1 treatment, in contrast to untreated, serum-starved cells (Fig. 5C). The increase in cells incorporating BrdU under mdvi-1 treatment is similar to that observed after growth factor (FBS) replenishment for 4 h, as measured in HCT116 cells (Fig. 5D).
The increased BrdU incorporation in mdivi-1-treated cells is correlated with increased cyclin E levels in both HCT116 (Fig. 5E) and NRK cells (Fig. S8B). The MEK kinase inhibitor PD098059 (21) prevents cyclin E buildup in growth factor-stimulated cells but not in mdivi-1-treated cells (Fig. 5E), suggesting cyclin E accumulation in mdivi-1-treated G0 cells occurs downstream of growth factor signaling. Consistent with this, there is no increase in the growth factor cyclin, cyclin D, in mdivi-1-treated cells, in contrast to growth factor-stimulated cells (Fig. 5E).
Cell Cycle Defects Caused by Untimely Hyperfused Mitochondria.
When cyclin E levels are forced to remain high before/during mitosis, defects in chromosome alignment arise (22). We investigated whether causing mitochondria to become hyperfused during mitosis has similar consequences. HCT116 cells were treated with mdivi-1 for 4 h to induce mitochondrial hyperfusion, and thereafter mitotic cells were examined. Treated metaphase cells have highly tubular mitochondria and severely misaligned chromosomes, unlike untreated metaphase cells, which have aligned chromosomes and fragmented mitochondria (Fig. 6A).
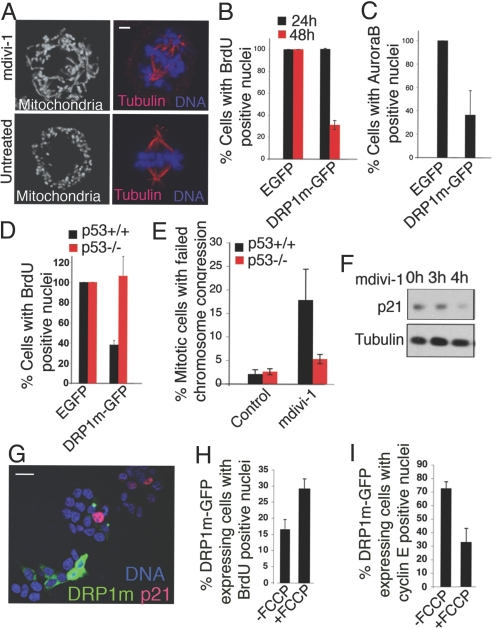
Cell cycle defects by the untimely presence of hyperfused mitochondria. (A) Chromosomal defects in mitotic cells after mdivi-1 treatment. Proliferating HCT116 cells were treated/untreated with mdivi-1 (50 μM) for 4 h and stained with MitoTracker green (Left) or Hoechst (Right). Tubulin immunostaining (red) showing the mitotic spindle in Right. (Scale bar: 2 μm.) (B) Reduction in BrdU incorporation in cells expressing DRP1m-GFP. DRP1m-GFP or EGFP were overexpressed for 24 or 48 h in NRK cells, and the cells were then counted for BrdU incorporation. Also see Fig. S9A. (C) Decrease in nuclear Aurora B localization in cells expressing DRP1m-GFP (for 48 h). Also see Fig. S9B. In B and C, measurements were made from ≈150 cells in each of 3 independent experiments. Data were expressed as a percentage of BrdU/AuroraB-positive nuclei seen in cells expressing EGFP. (D) Effect of DRP1m-GFP expression on BrdU incorporation in p53+/+ versus p53−/− HCT116 cells as counted in ≈150 cells expressing DRP1m-GFP (for 48 h). Results are expressed as a percentage of that seen in cells similarly expressing EGFP alone. Also see Fig. S10C. (E) Percentage of cells with failed chromosome congression in metaphase (as in Fig. 6A) in mdivi-1-treated p53+/+ HCT116 versus p53−/− HCT116 cells. The phenotype was quantified in ≈300 mitotic cells in each of the 3 independent experiments. (F) mdivi-1 treatment does not induce p21. Proliferating HCT116 cells were treated with mdivi-1 for the indicated times and cell extracts immunoblotted for p21 or for tubulin as a loading control. (G) Lack of p21 expression in DRP1m-GFP-expressing cells on mdivi-1 treatment in HCT116, p53+/+ cells. More than 75% of the DRP1m-GFP-expressing cells were negative for p21. (Scale bar: 20 μm.) (H) Increase in BrdU incorporation in DRP1m-expressing cells (48 h) after FCCP treatment (10 μM, 3 h). Also see Fig. S10A. (I) Decrease in nuclear cyclin E in DRP1m-expressing cells (48 h) treated with FCCP (10 μM, 3 h). Also see Fig. S10B. Data in D and E were obtained from ≈150 cells expressing DRP1m-GFP in each of 3 different experiments. In all plots, bars represent standard deviation from 3 different experiments.
Constitutive overexpression of cyclin E throughout the cell cycle is also known to inhibit S-phase entry because of defects in licensing of replication origins occurring after the previous round of mitosis (23). We tested whether a similar phenotype occurs when mitochondria are perpetually hyperfused by DRP1m expression for 48 h. Significantly decreased BrdU incorporation and fewer Aurora B-postivie nuclei are seen in these cells, whereas in cells overexpressing DRP1m for shorter periods (i.e., 24 h, before most DRP1m-positive cells undergo mitosis) no inhibition in BrdU incorporation occurs (Fig. 6 B and C).
The S-phase entry delay induced by long-term DRP1m expression is p53 dependent because levels of BrdU incorporation do not decrease in p53−/− cells expressing DRP1m (Fig. 6D). In addition, the mitotic chromosome abnormality caused by mdivi-1 treatment also does not occur in p53−/− cells (Fig. 6E). Despite being p53-dependent, cell cycle effects produced by mdivi-1 treatment or DRP1m expression do not involve the p21-induced, G1–S checkpoint because neither mdivi-1 treatment nor DRP1m expression leads to p21 induction (Fig. 6 F and G).
To address whether the S-phase entry delay in DRP1m-expressing cells is linked to membrane potential of the highly fused state of mitochondria, we tested whether the delay is reversed by FCCP treatment. Supporting this, when cells expressing DRP1m for 48 h are treated with FCCP, BrdU-positive nuclei increase in number, indicative of S-phase entry (Fig. 6H). Furthermore, there is a drop in nuclear cyclin E levels (Fig. 6I), as typically occurs after initiation of DNA synthesis (18). Hence the S-phase entry delay induced by long-term DRP1m expression depends on mitochondrial membrane potential and occurs downstream of the p21-induced G1–S checkpoint.
Discussion
In this article, we identify a unique form of mitochondria at G1–S consisting of a giant, hyperfused network. Mitochondria in this state have higher ATP producing capacity than mitochondria at any other cell cycle stage. Depolarization of mitochondria triggered a specific p53/p21-dependent G1–S arrest, demonstrating that mitochondrial function is important for G1-to-S transition. Inducing mitochondria to become hyperfused leads to buildup of cyclin E and initiation of DNA replication in serum-starved cells at G0. However, keeping mitochondria untimely hyperfused leads to cell cycle defects characteristic of cyclin E overexpression. Based on these findings, we propose that a transient hyperfused mitochondrial state at G1–S is important for regulating G1–S transition by temporarily boosting cyclin E levels needed for S-phase entry.
Regulation of cyclin E levels by hyperfused mitochondria at G1–S could explain why knockouts of mitofusins (MFN1–2) phenocopy the effects of cyclin E knockouts (24, 25). Hyperfused mitochondria could boost cyclin E levels by augmenting cyclin E transcription, by preventing cyclin E degradation (through binding and sequestering cyclin E regulatory components), and/or by acting indirectly through increased ATP production for ubiquitination of cyclin E regulatory components.
The link between mitochondria and cyclin E buildup could well be regulated through p53, which is known to have a role in regulating mitochondrial respiration (5). p53 transcriptionally regulates SCO2, which regulates mitochondrial respiration by regulating cytochrome c oxidase complex. A potential role of p53 in mitochondrial regulation of cyclin E would provide a reason for why cell cycle defects caused by hyperfused mitochondria having cyclin-E buildup only occur in cells containing p53 without involvement of p21.
Mitochondria might be driven into a hyperfused state at G1–S by a shift toward fusion in the normal balance of fusion/fission. Recent work has shown that when mitochondrial fusion is inhibited by removal of prohibitin, a protein that interacts with optic atrophy 1 (OPA1) to mediate mitochondrial fusion (26), mitochondrial cristae are malformed and cells arrest before DNA synthesis (27). Moreover, a fusion proficient form of OPA1 can revert the cell proliferation defect occurring in the absence of prohibitin-2 by mediating mitochondrial fusion (27). Because knockdown of cyclin D increases mitochondrial tubulation and membrane potential (6), cell cycle regulatory components are also likely to play important roles in shifting the balance toward mitochondrial fusion as cells progress through G1.
Besides leading to cyclin E buildup and controlling G1–S progression, the giant, voluminous mitochondrial network at G1–S could serve other cellular functions such as efficient homogenization and complementation of mitochondrial DNA in the continuous matrix (1); enhanced mitochondrial ATP to compensate for reduced glycolytic ATP during G1–S transition (28); and cell protection against apoptosis at this crucial cell cycle stage (2). Hyperfused mitochondria might also play a role in tumorigenesis, as many cancer cells have lost control of G1–S transition and have dysregulated cyclin E levels (20, 29) in tumorigenesis. Our findings that G1–S transition and cyclin E levels can be regulated by mitochondrial state thus opens new areas of exploration relating mitochondria, the cell cycle, and cancer.
Methods
Reagents, Antibodies, and Immunoblotting.
See SI Methods.
Cell Culture and Imaging.
Cells were maintained by standard tissue culture techniques, and G418 (1 mg/mL) was used to generate stable lines. Immunofluoresent staining was performed following standard techniques. For BrdU incorporation experiments, cells were incubated with 100 μM BrdU for 10 min, which was detected by immunostaining with anti-BrdU antibody. Imaging was performed by using a laser-scanning confocal microscope (LSM510; Carl Zeiss MicroImaging). In live-cell experiments, cells were imaged in buffered medium on a preheated microscope stage (37 °C). Appropriate laser lines for each fluorophore were used.
High-resolution images were acquired by using the 63×, 1.4 N.A. Plan Neofluar oil-immersion objective. Optical slices were taken along the z axis covering the whole depth of the cell.
For fluorescence recovery after photobleaching (FRAP) analyses, the same 63× objective was used. The fluorescence was bleached and recovery was monitored every second for 2 min. Quantification of recovery kinetics was performed according to ref. 30.
The microirradiation experiment was performed using the 63× Plan Fluor oil objective of the Zeiss LSM 510 META system. Two-photon laser light at 800 nm and 25% power was used to irradiate a region of interest of 15/15 pixels (1 × 1 μm) on TMRE-loaded mitochondria. Images were acquired with the 543-nm line every 3 sec after irradiation until 18 sec or 2 min, as required.
Image processing was performed using the Zeiss LSM software (version 3.4). See SI Methods for details.
Analyses of Mitochondrial Properties.
Cells were first incubated with MitoTracker Green (100 nM) for 15 min followed by TMRE (50 nM) for another 15 min. A 40× Plan Neofluar oil-immersion objective was used to acquire images. Mitochondrial potential per unit mass was assessed as a ratio of the TMRE/MitoTracker Green signal. Total cellular ATP was assayed using the ATP determination kit (Molecular Probes), and the mitochondrial contribution was assayed using oligomycin.
For morphometric analyses, a 3D stack of high-resolution confocal images was used for calculating the volume of individual mitochondrial elements within a single cell from different cell cycle stages. Within the merged 3D stack, mitochondrial elements were segmented (31). After segmentation, surface points were extracted for each identified mitochondrial object in the 3D image. The minimum distance between the surface points of the objects and a selective set of quantitative features was computed for each object and used for subsequent statistical analysis. Using all the extracted features, an unbiased volume quantification was used to quantify mitochondrial tubulation. See SI Methods for details.
Cell Cycle Synchronization and Identification of Cell Cycle Stage.
A combination of synchronization methods including serum starvation, aphidicolin, and nocodazole treatment was used. See SI Methods and Fig. S3 for details.
In fixed cells, cell cycle stages were identified by BrdU incorporation, Aurora B staining, and propidium iodide staining. In live cells, cell cycle stages were identified through expression of cell cycle markers, as described in detail in SI Methods.
Cell Cycle Analysis by Flow Cytometry.
Propidium iodide staining (50 μg/mL; 30 min) was used to measure the DNA content of cells by flow cytometry. See SI Methods for details.
Acknowledgments.
We thank R. J. Youle, M. McNiven, C. Cardoso, Y. Wang, J. Chen, B. Vogelstein, and J. Nunnari for reagents and S. Dwarkapuram for help in the morphometric analysis and R. Hegde, R. J. Youle, C. Smith, M. Lilly, A. Arnaoutov, and members of the Lippincott-Schwartz Laboratory for valuable suggestions. B.R. acknowledges National Institutes of Health Grant R01 EB005157 and National Science Foundation Grant EEC-9986821.
Footnotes
The authors declare no conflict of interest.
See Commentary on page 11825.
This article contains supporting information online at www.pnas.org/cgi/content/full/0904875106/DCSupplemental.
References
Articles from Proceedings of the National Academy of Sciences of the United States of America are provided here courtesy of National Academy of Sciences
Full text links
Read article at publisher's site: https://doi.org/10.1073/pnas.0904875106
Read article for free, from open access legal sources, via Unpaywall:
https://europepmc.org/articles/pmc2710990?pdf=render
Free after 6 months at www.pnas.org
http://www.pnas.org/cgi/content/full/106/29/11960
Free after 6 months at www.pnas.org
http://www.pnas.org/cgi/reprint/106/29/11960.pdf
Free after 6 months at www.pnas.org
http://www.pnas.org/cgi/content/abstract/106/29/11960
Citations & impact
Impact metrics
Citations of article over time
Alternative metrics
Smart citations by scite.ai
Explore citation contexts and check if this article has been
supported or disputed.
https://scite.ai/reports/10.1073/pnas.0904875106
Article citations
Telomere Reprogramming and Cellular Metabolism: Is There a Link?
Int J Mol Sci, 25(19):10500, 29 Sep 2024
Cited by: 0 articles | PMID: 39408829 | PMCID: PMC11476947
Review Free full text in Europe PMC
Role of Mitochondrial Dysfunctions in Neurodegenerative Disorders: Advances in Mitochondrial Biology.
Mol Neurobiol, 13 Sep 2024
Cited by: 0 articles | PMID: 39269547
Review
Mitochondrial NME6 Influences Basic Cellular Processes in Tumor Cells In Vitro.
Int J Mol Sci, 25(17):9580, 04 Sep 2024
Cited by: 0 articles | PMID: 39273527 | PMCID: PMC11395177
Unlocking mitochondrial dysfunction-associated senescence (MiDAS) with NAD+ - A Boolean model of mitochondrial dynamics and cell cycle control.
Transl Oncol, 49:102084, 19 Aug 2024
Cited by: 1 article | PMID: 39163758 | PMCID: PMC11380032
Drp1 splice variants regulate ovarian cancer mitochondrial dynamics and tumor progression.
EMBO Rep, 25(10):4281-4310, 27 Aug 2024
Cited by: 1 article | PMID: 39191946 | PMCID: PMC11467262
Go to all (375) article citations
Data
Data behind the article
This data has been text mined from the article, or deposited into data resources.
BioStudies: supplemental material and supporting data
Similar Articles
To arrive at the top five similar articles we use a word-weighted algorithm to compare words from the Title and Abstract of each citation.
Mitochondrial hyperfusion induced by loss of the fission protein Drp1 causes ATM-dependent G2/M arrest and aneuploidy through DNA replication stress.
J Cell Sci, 125(pt 23):5745-5757, 26 Sep 2012
Cited by: 124 articles | PMID: 23015593 | PMCID: PMC4074216
Mitotic phosphorylation of dynamin-related GTPase Drp1 participates in mitochondrial fission.
J Biol Chem, 282(15):11521-11529, 14 Feb 2007
Cited by: 767 articles | PMID: 17301055
A role for septin 2 in Drp1-mediated mitochondrial fission.
EMBO Rep, 17(6):858-873, 23 May 2016
Cited by: 61 articles | PMID: 27215606 | PMCID: PMC5278612
[Mechanism of mitochondrial fission - structure and function of Drp1 protein].
Postepy Biochem, 62(2):127-137, 01 Jan 2016
Cited by: 16 articles | PMID: 28132464
Review
Funding
Funders who supported this work.
NIBIB NIH HHS (2)
Grant ID: R01EB005157
Grant ID: R01 EB005157


