| PMC full text: | Science. Author manuscript; available in PMC 2010 Jul 19. Published in final edited form as: Science. 2009 Jun 26; 324(5935): 1720–1723. Published online 2009 May 14. doi: 10.1126/science.1162327 |
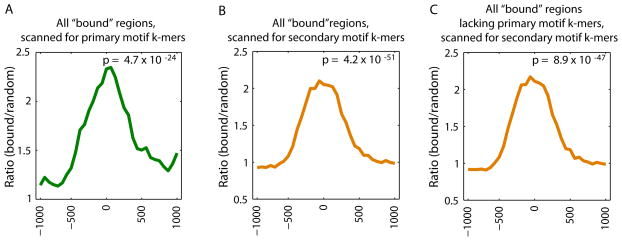
Figure 4

Enrichment of primary versus secondary motif sequences bound in vitro within genomic regions bound in vivo. Relative enrichment of k-mers corresponding to the primary versus secondary Seed-and-Wobble motifs within (A, B) all bound genomic regions in ChIP-chip data, or (C) those bound regions lacking primary motif k-mers, as compared to randomly selected sequences was calculated (5) for Hnf4a (GEO accession #GSE7745). ChIP-chip ‘bound’ peaks were identified according to the criteria of that study (28). A window size of 500 bp with a step size of 100 bp was used. The GOMER thresholds used are 2.958 × 10⁻⁷ and 8.419 × 10⁻⁷, corresponding to 9 primary and 20 secondary 8-mers scanned respectively for Hnf4a. P-values for enrichment of 8-mers within the bound genomic regions shown in each panel were calculated for the interval −250 to +250 by the Wilcoxon-Mann-Whitney rank sum test, comparing the number of occurrences per sequence in the bound set versus the background set.


