Abstract
Free full text

Regulation of Alternative Splicing by Histone Modifications
Abstract
Alternative splicing of pre-mRNA is a prominent mechanism to generate protein diversity, yet its regulation is poorly understood. We demonstrated a direct role for histone modifications in alternative splicing. We found distinctive histone modification signatures that correlate with the splicing outcome in a set of human genes, and modulation of histone modifications causes splice site switching. Histone marks affect splicing outcome by influencing the recruitment of splicing regulators via a chromatin-binding protein. These results outline an adaptor system for the reading of histone marks by the pre-mRNA splicing machinery.
Most human genes are alternatively spliced in a cell type–and tissue-specific manner, and defects in alternative splicing (AS) contribute to disease (1-4). Pre-mRNA splicing occurs largely cotranscriptionally, and alternative splice site choice is influenced by RNA polymerase II elongation rate, chromatin remodelers, and histone deacetylase inhibitors (5-14). Genome-wide mapping of histone modifications has revealed nonrandom distributions of nucleosomes and several histone modifications across exons (15-19). Given these observations, we probed the role of histone modifications in AS.
The human fibroblast growth factor receptor 2(FGFR2) gene is an established AS model, in which exons IIIb and IIIc undergo mutually exclusive and tissue-specific AS (Fig. 1A) (20, 21). In human prostate normal epithelium cells (PNT2s), exon IIIb is predominantly included, whereas in human mesenchymal stem cells (hMSCs), it is re-pressed and exon IIIc is exclusively used (Fig. 1, A and B). The differential inclusion of these two exons is regulated by the polypyrimidine tract–binding protein (PTB) which binds to silencing elements around exon IIIb, resulting in its repression (20, 22). We comparatively mapped by quantitative chromatin immunoprecipitation a set of histone modifications across the alternatively spliced region in PNT2 cells and hMSCs (Fig. 1, C to H, and fig. S1, A to F). No differences in the levels of H3-K4me2, H3-K9ac, H3-K27ac, and pan-H4ac histone modifications were detected (Fig. 1H and fig. S1, D to F). In contrast, H3-K36me3 and H3-K4me1 were enriched over the FGFR2 gene in hMSCs, where exon IIIb is repressed, whereas H3-K27me3, H3-K4me3, and H3-K9me1 were reduced as compared to PNT2 cells, where the exon is included (Fig. 1, C to G, and fig. S1, A to C). Histone mark enrichments were not limited to the alternatively spliced exons but extended along the locus with the highest differences around the alternatively spliced region (Fig. 1 and fig. S1).
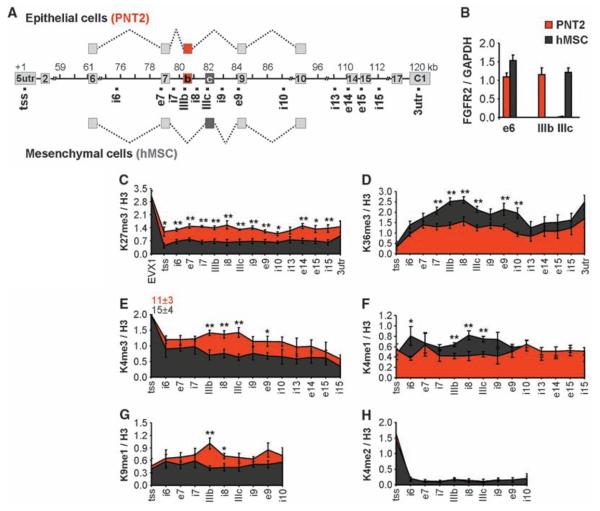
Splicing-specific histone modifications. (A) Schematic representation of the human FGFR2 gene. Exon IIIb (red) is included in PNT2 epithelial cells, exon IIIc (black) is included in hMSCs. Square dots indicate oligonucleotide pairs used in analysis. (B) Levels of FGFR2 exon inclusion relative to GAPDH in PNT2 (red) or hMSCs (black) determined by quantitative polymerase chain reaction (PCR). (C to H) Mapping of H3-K27me3 (C), H3-K36me3 (D), H3-K4me3 (E), H3-K4me1 (F), H3-K9me1 (G), and H3-K4me2 (H) in FGFR2 in PNT2 (red) and hMSC (black) cells by quantitative chromatin immunoprecipitation. The percentage of input was normalized to unmodified H3. Values represent means ± SEM from four to six independent experiments. *P < 0.05, **P <0.01, Student's t test.
Several other PTB-dependent alternatively spliced exons (23), including tropomyosin 2 (TPM2) exon 7 and TPM1 exon 3 in hMSCs and pyruvate kinase type M2 (PKM2) exon 9 in PNT2 cells, exhibited similar splicing-specific histone modification patterns (fig. S2), whereas PTB-independent alternative exons or constitutively spliced genes did not (figs. S3 and S4). Chromatin signatures correlated with the inclusion pattern of the PTB-dependent exon regardless of cell type or steady-state transcription levels of the alternatively spliced genes (Fig. 1 and figs. S2 and S3). These observations reveal a correlation between histone mark signatures and PTB-dependent repression of alternatively spliced exons.
To investigate whether histone modifications have a causal role in alternative splice site selection, we modulated the levels of H3-K36me3, which is the most prominently enriched modification on FGFR2. Overexpression of the H3-K36 methyltransferase SET2 led to a significant increase in H3-K36me3 globally and along FGFR2 in both PNT2 and hMSC cells (Fig. 2A and fig. S5, A and B) and, consistent with a role of H3-K36me3 in alternative splice site selection, reduced the inclusion of PTB-dependent exons in FGFR2, TPM2, TPM1, and PKM2 mRNA (Fig. 2B and figs. S6, A to D, and S7, A to C). Usage of PTB-independent alternatively spliced exons and constitutive splicing were unaffected (Fig. 2, C and D, and fig. S8, A and B). Overexpression of SET2 also significantly reduced the inclusion of FGFR2 IIIb in HEK 293 cells, where both isoforms are included to a similar extent, demonstrating that H3-K36me3–mediated modulation of PTB-dependent splicing is not cell type–specific (fig. S9, A to E). Conversely, down-regulation of the H3-K36 methyltransferase SETD2 by RNA interference (RNAi) promoted inclusion of the normally repressed PTB-dependent exons (Fig. 2F and figs. S6, M to P, and S7, D to F) but did not affect the PTB-independent exons and constitutively spliced exons (Fig. 2, G and H, and fig. S8, E and F). The changes in splicing patterns were not an effect of changes in total FGFR2 or PTB transcription levels (fig. S8, C and D and G and H), nor were they due to epithelial-to-mesenchymal transition forced by overexpression or knockdown of SET2 (fig. S10). We similarly tested the effect of H3-K4 methylation, because H3-K4me3 is enriched over the FGFR2 gene in PNT2 cells as compared to hMSCs. Overexpression of the H3-K4 methyltransferase ASH2 led to increased usage of the normally repressed PTB-dependent exons (Fig. 2J and fig. S7, G to I) but not of PTB-independent alternatively spliced exons or a constitutively spliced exon (Fig. 2, K and L). These results demonstrate that histone modifications can modulate AS outcome.
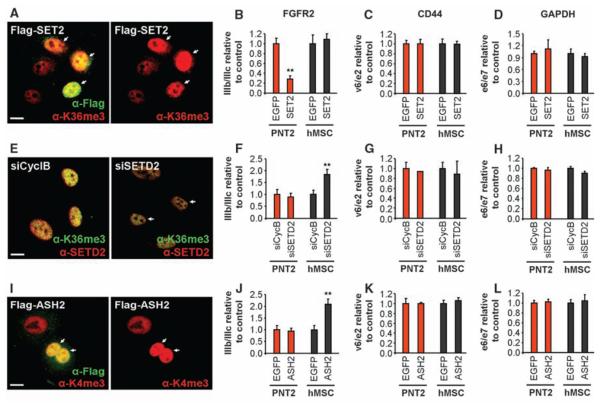
Modulation of alternative splicing by his-tone modifications. (A, E, and I) H3-K36me3 levels after SET2/SETD2 modulation [(A) and (E)] and H3-K4me3 after ASH2 overexpression (I). Arrows indicate transfected cells. Scale bar, 10 mm. (B to D, F to H, and J to L) Quantitative reverse transcription PCR (RT-PCR) analysis of exon ratios after overexpression of Flag-SET2 [(B) to (D), SET2], down-regulation of SETD2 [(F) to (H), siSETD2], or over-expression of Flag-ASH2 [(J) to (L), ASH2] in PNT2 (red) or hMSC cells (black). Ratios are as follows: exon IIIb/IIIc for FGFR2, exon v6/e2 for CD44, and exon e6/e7 for GAPDH. Values represent means T SEM of percentages relative to EGFP or siCyclophilin B used as controls from four to six independent experiments. **P <0.01, Student's t test compared to control.
To define the molecular mechanism by which histone marks influence splice site choice, we focused on the histone tail–binding protein MORF-related gene 15 (MRG15), a component of the retinoblastoma binding protein 2 (RBP2)/H3-K4 demethylase complex (24). MRG15 specifically binds to H3-K36me3 and recruits RBP2, which depletes H3-K4me3 (24, 25), reminiscent of the chromatin signature found in the PTB-repressed alternatively spliced regions of FGFR2. MRG15 distribution along the PTB-dependent alternatively spliced genes FGFR2, TPM2, TPM1, and PKM2, but not along the control gene CD44, mimicked H3-K36me3 distribution (Fig. 3, A and B, and fig. S11, A to C). Overexpression of MRG15 was sufficient to force exclusion of the PTB-dependent exons but did not significantly alter the inclusion levels of CD44 exon v6 (Fig. 3, C and D, and S11D-F). Conversely, knockdown of MRG15, and its functionally redundant paralog MRGX, led to increased use of the PTB-dependent exons but did not affect CD44 AS (Fig. 3, E and F, and fig. S11, G to I). We conclude that the chromatin-binding protein MRG15 is a modulator of PTB-dependent alternative splice site selection.
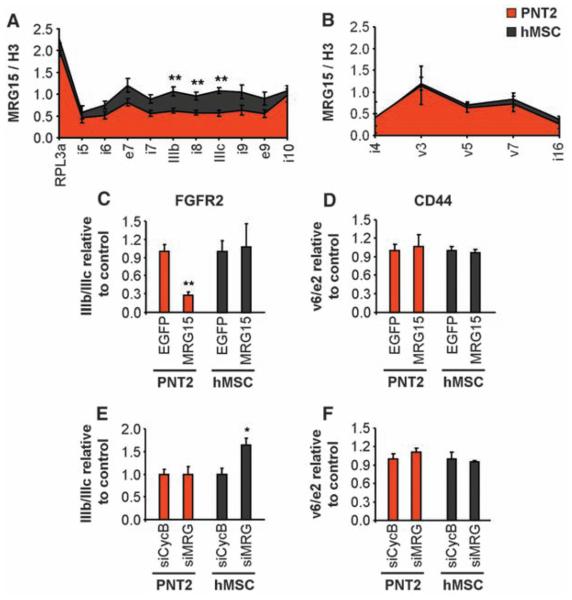
MRG15 modulates alternative splicing. (A and B) Chromatin immunoprecipitation of MRG15 along FGFR2 (A) and CD44 (B) in PNT2 (red) and hMSC (black) cells. Input was normalized to unmodified H3. The RPL13a promoter was a positive control. Values represent means ± SEM from three to six independent experiments. (C to F) Quantitative RT-PCR analysis of exon ratios after overexpression of EGFP-MRG15 [(C) and (D), MRG15] or down-regulation of both MRG15 and MRGX [(E) and (F), siMRG] in PNT2 (red) or hMSC (black) cells. Ratios are as follows: exon IIIb/IIIc for FGFR2 and exon v6/e2 for CD44. Values represent means ± SEM of percentages relative to EGFP or siCyclophilin B used as controls from five independent experiments. *P<0.05, **P<0.01, Student's t test compared to control.
To delineate the mechanism of the chromatin-associated protein MRG15 in PTB-dependent AS, we tested the possibility that MRG15 may act by recruiting PTB to its target exons via physical interaction. Endogenous PTB coimmunoprecipitated endogenous MRG15 in both PNT2 and hMSC cells, and reciprocally overexpressed tagged MRG15 interacted with PTB (Fig. 4, A and B). Consistent with a role for MRG15 in the recruitment of PTB, MRG15 associated with FGFR2 premRNA, and its distribution mirrored that of PTB on the repressed exon IIIb in hMSCs, suggesting simultaneous association of the two proteins with FGFR2 pre-mRNA (Fig. 4, C and D). As a control, the general splicing small nuclear ribonucleoprotein Sm proteins associated uniformly with the FGFR2 exon IIIb/IIIc region (Fig. 4E).
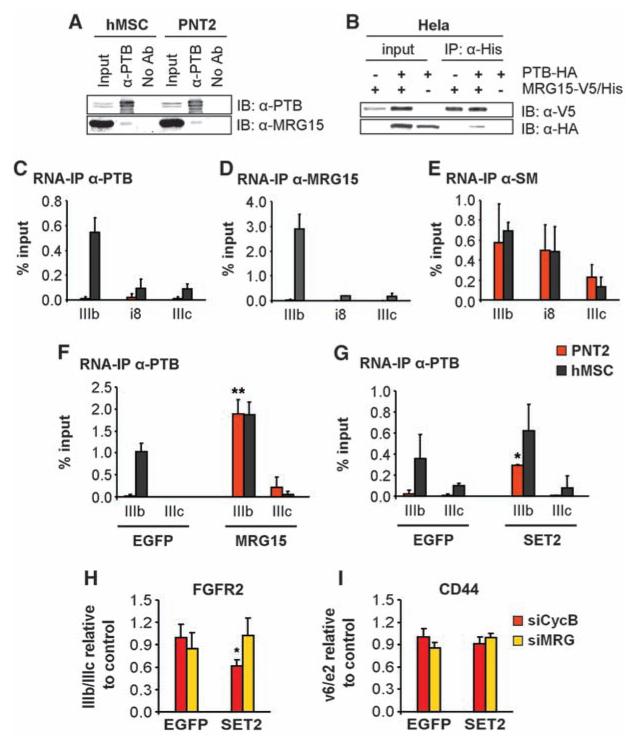
H3-K36me3 recruits PTB to exon IIIb via MRG15. (A) Immunoblot detection of PTB and MRG15 after immuno-precipitation of PTB. (B) Reciprocal coimmunoprecipitation of over-expressed MRG15-V5/His and PTB-HA in Hela cells. (C to E) RNA immunoprecipitation of PTB, MRG15, or Sm proteins in FGFR2 exons IIIb and IIIc in PNT2 (red) or hMSC (black) cells. Values represent means ± SEM from three independent experiments. (F and G) Overexpression of MRG15 (F) or SET2 (G) in PNT2 (red) or hMSC (black) cells for 48 hours before RNA immunoprecipitation of PTB. Values represent means ± SEM from three independent experiments. (H and I) Quantitative RT-PCR analysis of exon ratios in PNT2 cells depleted of MRG15 and MRGX (siMRG, yellow) or cyclophilin B (siCycB, red) after overexpression of SET2 or EGFP. Ratios are as follows: exon IIIb/IIIc for FGFR2 (H) and exon v6/e2 for CD44 (I). Values represent means T SEM from five independent experiments. *P < 0.05, **P < 0.01, Student's t test compared to control.
To directly test whether MRG15 is responsible for the accumulation of PTB on FGFR2 pre-mRNA, MRG15 was overexpressed in PNT2 cells. MRG15 expression forced the recruitment of PTB to its target FGFR2 exon IIIb, inducing its repression (Figs. (Figs.4F4F and and3C).3C). Consistent with arolefor H3-K36me3 in PTB-mediatedsplice site selection, SET2 overexpression also induced PTB binding to FGFR2 exon IIIb pre-mRNA in PNT2 cells (Fig. 4G), concomitant with increased binding of MRG15 to FGFR2 chromatin (fig. S12) and exon IIIb repression (Fig. 2B). The effect of SET2 on FGFR2 AS was MRG15-dependent, because down-regulation of MRG15 by RNAi blocked the SET2-dependent splice site shift in PNT2 cells (Fig. 4, H and I), demonstrating that the SET2 effect on AS is mediated via MRG15.
To obtain an estimate of how many PTB-dependent AS events are regulated by H3-K36me3/MRG15–mediated recruitment of PTB, we carried out a genome-wide comparative analysis of AS using high-throughput cDNA sequencing in hMSCs depleted of either SETD2, MRG15, or PTB (26, 27). Depletion of PTB, together with its functional paralog neuronal PTB (nPTB), by RNAi led to changes (≥15% exon usage) in 447 AS events among 12,235 detected alternative exons (Fig. 5, A and B). Knockdown of MRG15, together with its paralog MRGX, resulted in changes in 186 AS events, and down-regulation of the H3-K36 methyltransferase SETD2 affected 186 AS events. Sixty-five AS events were sensitive to both PTB and MRG15 depletion, representing ~15% of PTB-dependent and 35% of MRG15-dependent events (Fig. 5, A and B). The majority (61 out of 65) of codependent splicing events changed in the same direction, further supporting a functional relationship between these two factors. In line with a role for H3-K36me3 in the regulation of AS, 41% of MRG15- and PTB-dependent splicing events were also sensitive to SETD2 down-regulation, with 96% of these co-dependent events changing in the same direction (Fig. 5C). The overlap between SETD2-dependent and MRG15/PTB codependent exons was statistically significant (P < 1.0 ×10⁻³², hypergeometric test), and exons codependent on these factors were independently validated by RT-PCR assays (fig. S13, B to I). MRG15/PTB codependence was more pronounced for exons that display relatively moderate changes upon PTB depletion as compared to strongly PTB-dependent exons (Fig. 5A and fig. S13A). Furthermore, MRG15/PTB code-pendent exons contained, on average, weaker PTB-binding sites than did strongly PTB-dependent exons (fig. S13A) (28). These results suggest that histone modifications preferentially modulate the splicing of alternative exons that are weakly regulated by PTB.
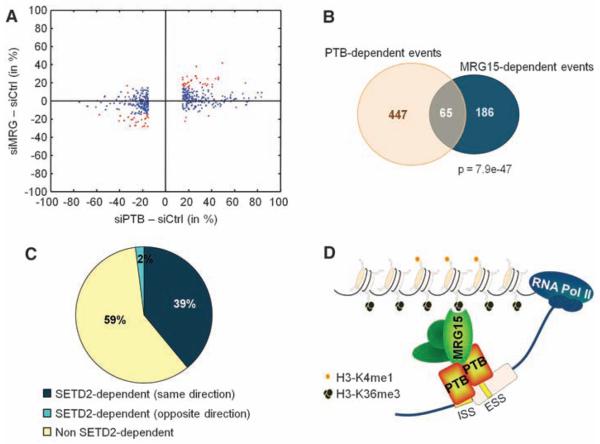
Genome-wide identification of SETD2, MRG15, and PTB alternative splicing events in hMSC cells. (A) Scatterplot of AS events in MRG15- (siMRG) or PTB-depleted cells (siPTB) as compared to small interfering RNA control (siCtrl) transfected cells. The cutoff is ≥15% change in exon usage. Red indicates codependent splicing events. (B) Venn diagram of PTB- and MRG15-dependent events with ≥15% change in exon usage. (C) Percentage of MRG15/PTB codependent events that are also sensitive to SETD2 down-regulation. (D) An adaptor system for reading histone marks by the splicing machinery, consisting of a histone mark signature, a chromatin-binding protein (MRG15), and a splicing regulator (PTB).
Our results demonstrate a role for histone modifications in AS control. We propose the existence of adaptor systems consisting of histone modifications, a chromatin-binding protein that reads the histone marks, and an interacting splicing regulator (Fig. 5D). Such complexes are a means for epigenetic information to be transmitted to the pre-mRNA processing machinery and probably act by favoring the recruitment of specific splicing regulators to the pre-mRNA, thus defining splicing outcome. We show here that for a subset of PTB-dependent genes, this adaptor system consists of H3-K36me3, its binding protein MRG15, and the splicing regulator PTB. It is tempting to speculate that other combinations of adaptor systems exist that act on other types of alternatively spliced exons. Physical interaction between several chromatin-associated proteins and splicing components has been reported (9, 14). Our results are in line with recent indirect evidence based on genome-wide mapping of histone modifications for a role for chromatin structure and histone modifications in exon definition and alternative splice site selection (5, 13, 15-19).
Although our observations argue for a direct link between histone modifications and the splicing machinery, histone marks may also affect splice site choice indirectly. Extensive evidence demonstrates a role for RNA polymerase II elongation rate or higher-order chromatin structure in splicing outcome, and it is likely that histone modifications act in concert with these mechanisms (6-8, 10-12). Based on our findings, we propose that the epigenetic memory contained in histone modification patterns is not only used to determine the level of activity of a gene but also transmits information to establish, propagate, and regulate AS patterns during physiological processes such as development and differentiation.
Supplementary Material
Methods, Figures, Tables
Supplementary Table 1
Acknowledgments
We thank J. Patton, D. Skalnik, B. Strahl, J. Steitz, D. Black, M. Garcia-Blanco, and H. Kimura for reagents; P. Scaffidi for discussions; J. Calarco for validations; C. Misquitta for technical assistance; H. Kosucu and Q. Morris for advice on statistical analysis; and E. Tominaga for cell culture. This research was supported by the Intramural Research Program of NIH, the National Cancer Institute, the Center for Cancer Research (T.M.), grants from the National Cancer Institute of Canada, Canadian Institutes of Health Research (grant MOP-67011) and Genome Canada (administered through the Ontario Genomics Institute) to B.B., NIA/NIH grant RO1 AGO32134 (OMPS) to O.P.S., and American Heart Association grant 0765084Y to K.T. Complete RNA deep-sequencing data are available at the Gene Expression Omnibus (accession no. GSE19373).
Footnotes
Supporting Online Material
www.sciencemag.org/cgi/content/full/science.1184208/DC1
Materials and Methods
Figs. S1 to S13
Tables S1 and S2
References
References and Notes
Full text links
Read article at publisher's site: https://doi.org/10.1126/science.1184208
Read article for free, from open access legal sources, via Unpaywall:
https://www.science.org/cms/asset/27dd2d50-7304-48e5-862c-d6c4cd1602e6/pap.pdf
Subscription required at www.sciencemag.org
http://www.sciencemag.org/cgi/content/full/327/5968/996
Subscription required at www.sciencemag.org
http://www.sciencemag.org/cgi/reprint/327/5968/996.pdf
Free to read at www.sciencemag.org
http://www.sciencemag.org/cgi/content/abstract/327/5968/996
Citations & impact
Impact metrics
Citations of article over time
Alternative metrics
Article citations
Histone lysine methylation modifiers controlled by protein stability.
Exp Mol Med, 56(10):2127-2144, 11 Oct 2024
Cited by: 0 articles | PMID: 39394462 | PMCID: PMC11541785
Review Free full text in Europe PMC
A Genome-Wide Alternative Splicing Analysis of <i>Gossypium arboreum</i> and <i>Gossypium raimondii</i> During Fiber Development.
Plants (Basel), 13(19):2816, 08 Oct 2024
Cited by: 0 articles | PMID: 39409686 | PMCID: PMC11479146
PTBP3 Mediates IL-18 Exon Skipping to Promote Immune Escape in Gallbladder Cancer.
Adv Sci (Weinh), 11(38):e2406633, 08 Aug 2024
Cited by: 1 article | PMID: 39116343 | PMCID: PMC11481411
A group 3 medulloblastoma stem cell program is maintained by OTX2-mediated alternative splicing.
Nat Cell Biol, 26(8):1233-1246, 18 Jul 2024
Cited by: 0 articles | PMID: 39025928 | PMCID: PMC11321995
TET1 displays catalytic and non-catalytic functions in the adult mouse cortex.
Epigenetics, 19(1):2374979, 06 Jul 2024
Cited by: 0 articles | PMID: 38970823 | PMCID: PMC11229741
Go to all (697) article citations
Data
Data behind the article
This data has been text mined from the article, or deposited into data resources.
BioStudies: supplemental material and supporting data
GEO - Gene Expression Omnibus
- (1 citation) GEO - GSE19373
Similar Articles
To arrive at the top five similar articles we use a word-weighted algorithm to compare words from the Title and Abstract of each citation.
Chromatin: the final frontier in splicing regulation?
Dev Cell, 18(3):336-338, 01 Mar 2010
Cited by: 12 articles | PMID: 20230741 | PMCID: PMC6586464
A lncRNA regulates alternative splicing via establishment of a splicing-specific chromatin signature.
Nat Struct Mol Biol, 22(5):370-376, 06 Apr 2015
Cited by: 154 articles | PMID: 25849144 | PMCID: PMC6322542
Histone marks regulate the epithelial-to-mesenchymal transition via alternative splicing.
Cell Rep, 38(7):110357, 01 Feb 2022
Cited by: 17 articles | PMID: 35172149
Regulation of alternative splicing by local histone modifications: potential roles for RNA-guided mechanisms.
Nucleic Acids Res, 42(2):701-713, 29 Sep 2013
Cited by: 115 articles | PMID: 24081581 | PMCID: PMC3902899
Review Free full text in Europe PMC
Funding
Funders who supported this work.
CIHR (1)
Grant ID: MOP-67011
Intramural NIH HHS (1)
Grant ID: ZIA BC010309-11
NIA NIH HHS (5)
Grant ID: R01 AG032134-03
Grant ID: R01 AG032134
Grant ID: R01 AG032134-04
Grant ID: R01 AG032134-02
Grant ID: R01 AG032134-01


