Abstract
Free full text

Physiological Regulation of ATP Release at the Apical Surface of Human Airway Epithelia*
Abstract
Extracellular ATP and its metabolite adenosine regulate mucociliary clearance in airway epithelia. Little has been known, however, regarding the actual ATP and adenosine concentrations in the thin (~7 μm) liquid layer lining native airway surfaces and the link between ATP release/metabolism and autocrine/paracrine regulation of epithelial function. In this study, chimeric Staphylococcus aureus protein A-luciferase (SPA-luc) was bound to endogenous antigens on primary human bronchial epithelial (HBE) cell surface and ATP concentrations assessed in real-time in the thin airway surface liquid (ASL). ATP concentrations on resting cells were 1–10 nM. Inhibition of ecto-nucleotidases resulted in ATP accumulation at a rate of ~250 fmol/min/cm2, reflecting the basal ATP release rate. Following hypotonic challenge to promote cell swelling, cell-surface ATP concentration measured by SPA-luc transiently reached ~1 μM independent of ASL volume, reflecting a transient 3-log increase in ATP release rates. In contrast, peak ATP concentrations measured in bulk ASL by soluble luciferase inversely correlated with volume. ATP release rates were intra-cellular calcium-independent, suggesting that non-exocytotic ATP release from ciliated cells, which dominate our cultures, mediated hypotonicity-induced nucleotide release. However, the cystic fibrosis transmembrane conductance regulator (CFTR) did not participate in this function. Following the acute swelling phase, HBE cells exhibited regulatory volume decrease which was impaired by apyrase and facilitated by ATP or UTP. Our data provide the first evidence that ATP concentrations at the airway epithelial surface reach the range for P2Y2 receptor activation by physiological stimuli and identify a role for mucosal ATP release in airway epithelial cell volume regulation.
ATP regulates the airway epithelial mucociliary clearance activities that are critical for pulmonary host defense against bacteria which deposit on airway surfaces. ATP activates the Gq/phospholipase C-coupled P2Y2 receptors (P2Y2-R),2 which in turn promotes Cl− secretion via calcium-activated Cl− channels (CaCC) (1), inhibits Na+ absorption mediated by epithelial sodium channels (2), increases ciliary beat frequency (3), and triggers mucin release (4, 5). Released ATP is rapidly hydrolyzed to ADP, AMP, and adenosine (ADO) by cell-surface nucleotidases. ADO activates Gs/adenylyl cyclase-coupled A2b receptor to promote cyclic AMP-dependent cystic fibrosis transmembrane conductance regulator (CFTR) activation and Cl− secretion (6, 7). Functional and biochemical evidence indicates that release and subsequent metabolism of ATP on the airway surface contribute to P2Y2 and A2b receptor-regulated electrolyte transport and airway surface liquid (ASL) volume homeostasis (8, 9).
Whereas the roles of ATP and ADO in modulating mucociliary clearance and associated airway epithelial activities have been intensively investigated, it is largely unknown how ATP concentrations in the thin (~7 μm) periciliary liquid lining airway surfaces are regulated. Airway epithelia release ATP into ASL basally (10, 11) and in response to mechanical stresses (12–14). ATP concentrations measured in media covering primary or immortalized airway cells (<100 nM, (12, 15)) are below EC50 values for ATP-promoted P2Y2-R-mediated intracellular calcium (Ca2+i) mobilization and Cl− secretion in airway epithelial cells (~1 μM (16, 17)) or second messenger formation in P2Y2-R-transfected cells (230 nM (18)). However, functional studies suggested that autocrine activation of airway epithelial P2Y2-R occurs in response to physiological stimuli (9), raising the possibility that ATP concentrations measured in the bulk extracellular medium, even with our micro-sampling technique from small volumes (12, 15), significantly underestimate the concentrations at the cell surface, as suspected for other cell types (19, 20).
Several approaches to measure cell-surface ATP concentrations in situ have recently been developed. These include the use of an atomic force microscopy probe coated with myosin fragments (21), biosensors comprised of P2X receptor-expressing cells to measure ATP-activated P2X receptor-mediated changes in currents and Ca2+i (20, 22, 23), luciferin fluorescence to visualize ATP release from single cells (24), and a chimeric luciferase with a leader sequence and a glycosylphosphatidylinositol (GPI) anchor expressed at the plasma membrane of cells (25). The ATP sensitivity of most of these methods is from semiquantitative to the micromolar range, suitable for the studies of ATP release from secretory cells, whereas nanomolar range sensitivity might be necessary for studies of airway epithelial ATP release.
Joseph et al. utilized a recombinant luciferase fused to the IgG-binding domain of Staphylococcus aureus protein A (SPA-luc) to position luciferase on the cell surface (19). SPA-luc was attached to 1321N1 astrocytoma cells via antibodies against CD14 heterogeneously expressed in these cells and exhibited sensitivity for ATP in the 10–10,000 nM range. Stimulation of 1321N1 cells with thrombin resulted in enhanced release of ATP, which reached submicromolar levels as assessed by the cell-attached SPA-luc. In contrast, thrombin-induced changes in ATP concentrations in the bulk extracellular compartment as measured by soluble luciferase were negligible (19).
In the present study, we examined the physiological regulation of ATP concentrations in the micro-environment at the airway luminal surface. A well differentiated (WD) primary human bronchial epithelial (HBE) culture system was utilized as a model for native human airway epithelia. SPA-luc (19) was re-engineered and purified to exhibit 100-fold increase in luciferase activity. Real-time measurements of ATP concentration in the thin film of ASL on HBE cells were performed with cell-attached SPA-luc under resting and luminal hypotonic challenge conditions. Results from this technique were compared with those obtained with real-time measurements by luciferase dissolved in ASL and with pipette-sampling and off-line luminometry approaches (8, 15). The physiological role for released ATP in airway epithelial volume regulation in response to hypotonic challenge was also investigated.
EXPERIMENTAL PROCEDURES
Cell Culture
WD primary HBE cultures were established from surgical specimens of main stem or lobar bronchi from healthy or cystic fibrosis (CF) donors on 12 or 6.5 mm diameter Transwell supports (Corning) as described (26). Cultures typically became fully differentiated in 20–30 days.
Purification of SPA-luc
pMALU5, a cDNA construct encoding SPA-luc, was kindly provided by Dr. George Dubyak (Case Western Reserve University). The SPA-luc sequence was amplified from pMALU5 by PCR with up and down primers harboring at their 5′ ends BamHI and KpnI restriction sites, respectively. The PCR product was digested with BamHI and KpnI and ligated into similarly digested pT7-HTb, thus introducing a His6 tag and tobacco etch virus cleavage site at the N terminus of SPA-luc. pT7-HTb/SPA-luc was transformed into Escherichia coli (BL21-*; Invitrogen) and SPA-luc was expressed by overnight induction with 0.2 mM isopropyl β-D-thiogalactopyranoside at 20 °C. The cells were lysed by an Emulsiflex homogenizer (Avestin, Ontario, Canada). Soluble proteins were precipitated with 55% ammonium sulfate, resuspended, and purified by two passages over a Ni2+-chelating column (GE Healthcare). The His6 tag was cleaved from the fusion protein using His6-tobacco etch virus protease (3 h at 30 °C), and the digestion mixture was run over a Ni2+-chelating column a third time and SPA-luc eluted in the flow-through. The protein concentration and luciferase activity of fractions obtained through the purification process were assayed using the BCA protein assay kit (Pierce) and the LB953 AutoLumat luminometer (15), respectively.
SPA Binding Antigens
SPA-luc binding to endogenous antigens on the apical surface of isolated WD HBE cells was investigated with a Leica SP2 AOBS confocal microscope as described previously (27). Immunostaining was performed on fixed, non-permeabilized cultures with primary antibodies against keratan sulfate (KS) or MUC1 followed by fluorescein isothiocyatate-labeled secondary antibodies, or with fluorescein isothiocyatate-labeled wheat germ agglutinin (WGA).
Cell ELISA
The concentrations of the selected antibodies/lectins required to achieve maximal SPA binding to WD HBE culture surfaces were optimized by quantitating cell-surface-bound protein A-horseradish peroxidase conjugates (SPA-HRP) by a cell ELISA. The apical surface of WD HBE cultures was first incubated with 50 μl of phosphate-buffered saline (PBS) containing 1% bovine serum albumin (BSA) for 30 min. The solution was replaced with 50 μl of PBS/BSA containing various concentrations of an anti-MUC1 antibody (mouse IgG2b, ab8323, Abcam, Cambridge, MA), an anti-KS antibody (mouse IgG2b, Chemicon, Temecula, CA), or biotinylated WGA (Vector Laboratories, Burlingame, CA). In the latter instance, an additional incubation (1 h) with 2 μg/ml anti-biotin antibody (rabbit, Bethyl Laboratories, Montgomery, TX) in 50 μl of PBS/BSA was performed. The apical surface of the cultures was washed three times with PBS (10 min/wash) and incubated with 1 μg/ml SPA-HRP (Pierce) in 50 μl of PBS for 1 h. The basolateral surfaces of cultures were bathed in 1 ml of Hank’s balanced salt solution buffered with 10 mM HEPES (HBSS/HEPES). All incubation procedures were performed at 4 °C. After three apical washes with PBS (10 min each), an ELISA with o-phenylenediamine was performed according to the manufacturer’s instruction (Pierce) and the intensity of the colorimetric reaction assessed at 490 nm by a microplate spectrophotometer (Molecular Devices, Sunnyvale, CA) with SOFTmax Pro software.
ATP Sensitivity of Cell-attached SPA-luc
Attachment of SPA-luc was carried out using the optimal antibody/lectin concentrations determined as above. Briefly, after blocking with PBS/BSA for 30 min, the apical surface of WD HBE cultures (on 12-mm Transwells) was incubated with 20 μg/ml anti-MUC1 antibody, 10 μg/ml anti-KS antibody, or 4 μg/ml biotinylated WGA followed by 2 μg/ml anti-biotin antibody for 1 h at 4 °C. After three washes with PBS, the apical HBE surface was incubated with 0.5 mg/ml purified SPA-luc for 1 h at 4 °C, washed with PBS, and the mucosal surface replenished with a specified volume of HBSS/HEPES.
SPA-luc-attached cultures were equilibrated at room temperature for 30 min to re-establish basal ATP concentrations. Cultures were subsequently transferred to a 35 mm polyacetal assay chamber, which contained 1 ml of HBSS/HEPES in a basolateral reservoir, and placed gently in a Turner TD-20/20 luminometer (Turner Biosystems, Sunnyvale, CA). Luciferin (150 μM) was added to the ASL and arbitrary light units (ALU) integrated for 10 s and recorded. Known concentrations of ATP were added in a stepwise manner (e.g. 1 nM added twice, 10 nM added twice, then 100 nM added twice). The ATP sensitivity of SPA-luc dissolved in bulk solution (100 μl of HBSS/HEPES) was obtained in parallel, using a Transwell without cells.
ATP Concentration and Release Rates on Resting HBE Cells
For real-time ATP measurements, HBE cells, with either cell-attached SPA-luc or soluble luciferase (Sigma L9506; 0.5–2.0 μg/culture), were placed in the Turner TD-20/20 luminometer and luciferin (150 μM) added to the mucosal liquid. Luminescence was measured every minute until the ALU values (i.e. basal ATP concentration) reached steady state (i.e. less than ± 10% variability over 10 min). At the end of each assay, an ATP-luminescence relationship was obtained as above. For off-line ATP measurements, the ASL on resting WD HBE cultures was sampled by gently pipetting (from volume >100 μl) or micro-sampling (from volume ≤100 μl) and ATP concentrations measured as described previously (8, 15).
ATP release rates from resting cells were determined by monitoring ATP accumulation in real-time under conditions resulting in maximal inhibition of cell-surface nucleotidase activities. The nucleotidase inhibitor mixture contained 300 μM β, γ-methylene-ATP, 30 μM ebselen, and 10 mM levamisole, to inhibit ecto-nucleotide pyrophosphatase/phosphodiesterases (eNPPs) (28), ecto-nucleotide triphosphate diphosphohydrolases (eNTPDases) (29, 30), and nonspecific alkaline phosphatases (31), respectively. After recording the basal ATP concentration as described above, the inhibitor mixture was added to the mucosal liquid and ATP concentrations measured every minute. The efficacy of the nucleotidase inhibitors was tested on separate HBE cultures in the presence of 500 nM ATP as described previously (10).
Hypotonic Challenge
After recording basal ATP concentrations in real-time, H2O (half the initial volume, containing 1 mM CaCl2 and 1 mM MgCl2) was added gently to the ASL. Luminescence was subsequently recorded for 5 min: every 0.2 s for the first minute, then every 10 s for the next 4 min. For an isosmotic control, the same volume of mannitol solution (300 mM, containing 1 mM CaCl2 and 1 mM MgCl2) was added as above. At the end of each assay, an ATP-luminescence relationship was obtained as above. Changes in luciferin/luciferase activity generated by addition of hypotonic or isosmotic solutions were tested on wells without cells containing ATP standards and confirmed to be <10%. ATP concentrations were alternatively measured by off-line luminometry of sampled ASL as described previously (15). The initial rate of ATP release following hypotonic challenge was assessed in the presence of the nucleotidase inhibitor mixture in 50 μl of mucosal liquid with soluble luciferase.
Cell Volume Regulation
Changes in cell height were used as a parameter to estimate cell volume changes following a hypotonic challenge, as described previously (15). In brief, WD HBE cells were loaded with 5 μM calcein-AM (Molecular Probes, Eugene, Oregon) for 30 min at 37 °C. The apical surface of cultures was equilibrated for 10 min with 33 μl of HBSS/HEPES before study. The cultures were then positioned on a Zeiss 510 confocal microscope. H2O (17 μl) was added to apical surface to generate a 200 mosM solution, and xz-scanning images were obtained every second for initial 15 s, then every 5 s for next 75 s. Experiments were also performed on cultures pretreated with apyrase (ATP diphosphohydrolase, 10 units/ml) for 5 min, 8-(p-sulfophenyl)theophylline (8-SPT, an ADO receptor antagonist, 100 μM) for 30 min or ATP, UTP, or ATPγS (100 μM) on the luminal surface.
Ca2+i Dependence of Hypotonicity-induced ATP Release
BAPTA-AM loading (100 μM for 30 min at 37 °C) of WD HBE cells and Ca2+i mobilization studies with Fura-2-AM were performed as described previously (32). ATP release from BAPTA-and vehicle-loaded cultures was measured with soluble luciferase in 50 μl of mucosal liquid.
Statistical Analysis
All experiments were performed on cultures established from at least three donors. Data were expressed as mean values ± S.E. of observations. Where appropriate, data were analyzed by Student’s t test or analysis of variance with GraphPad Prism software. Unpaired t tests or analysis of variance were used to obtain the p value for differences between means; a repeated-measures analysis of variance was used when comparing series of ATP values at each time point among different conditions. Statistical significance was defined as p < 0.05.
RESULTS
Optimization of SPA-luc Attachment to HBE Cell Surfaces
Partially purified His6-SPA-luc exhibited a specific activity of 1.6 × 10⁵ ALU/μg when assessed in the presence of 1 μM ATP. This specific activity was 100-fold higher than that initially detected in E. coli homogenate and represented 67% of the initial activity in the crude supernatant starting material (Fig. 1 and Table 1). Indeed, the specific activity of purified SPA-luc was similar to that of commercially available luciferase (Sigma catalog number L9506, 1.3 × 10⁵ ALU/μg).
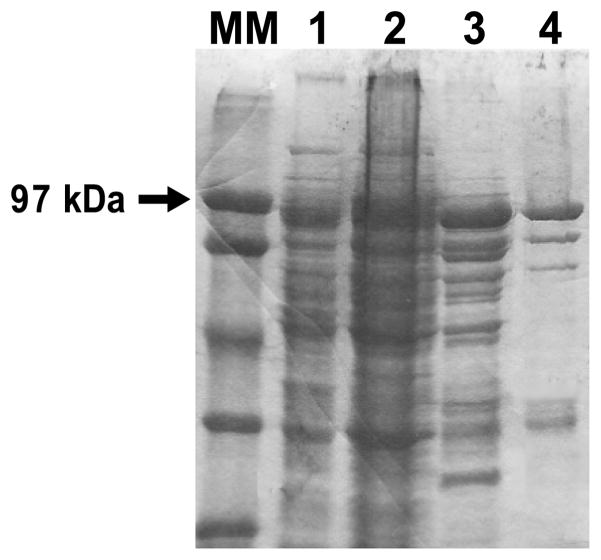
Coomassie Blue-stained gels of fractions from the indicated purification steps (2 μl of protein/lane) are shown. Lanes MM and 1–4, molecular marker (MM), soluble fraction from E. coli crude lysate (lane 1), resuspended pellet of 55% ammonium sulfate solution (2), pooled fractions 13–31 of the first Ni2+ column (3), and flow-through of the third Ni2+ column (lane 4). Lanes 3 and 4 represent desalted and concentrated product.
TABLE 1
Soluble proteins from SPA-luc transfected E. coli lysates (“Crude sup”) were precipitated with 55% ammonium sulfate (“AmSO4 55% pellet”), resuspended, and purified by three passages over a Ni2+-chelating column. 1–4 correspond to lanes 1–4 in Fig. 1.
| 1: crude sup | 2: AmSO455% pellet | 3: 1st column fractions 13–31 | 4: 3rd column flow-through | |
|---|---|---|---|---|
| Volume, ml | 200 | 40 | 4.5 | 3.9 |
| Protein concentration, mg/ml | 20 | 60 | 19 | 7.1 |
| Activity, ALU·μl−1 | 3.18 × 10⁴ | 3.56 × 10⁴ | 1.06 × 10⁶ | 1.09 × 10⁶ |
| Specific activity, ALU·μg−1 | 1.59 × 10³ | 5.93 × 10² | 5.58 × 10⁴ | 1.60 × 10⁵ |
| Relative total activity, % recovery | 100 | 22.4 | 75.0 | 66.7 |
Anti-KS and anti-MUC1 antibodies, as well as WGA, bound avidly to the apical surface of WD HBE cultures as revealed by confocal microscopy (Figs. 2, A–C) suggesting that these reagents would bind SPA-luc to endogenous HBE cell-surface antigens. Subsequently, the concentration of the antibody or lectin required for attachment of maximal amounts of SPA to HBE cell surfaces was determined by a cell ELISA as 10, 20, and 4 μg/ml for anti-KS antibody, anti-MUC1 antibody, and biotinylated WGA, respectively (Fig. 2D).
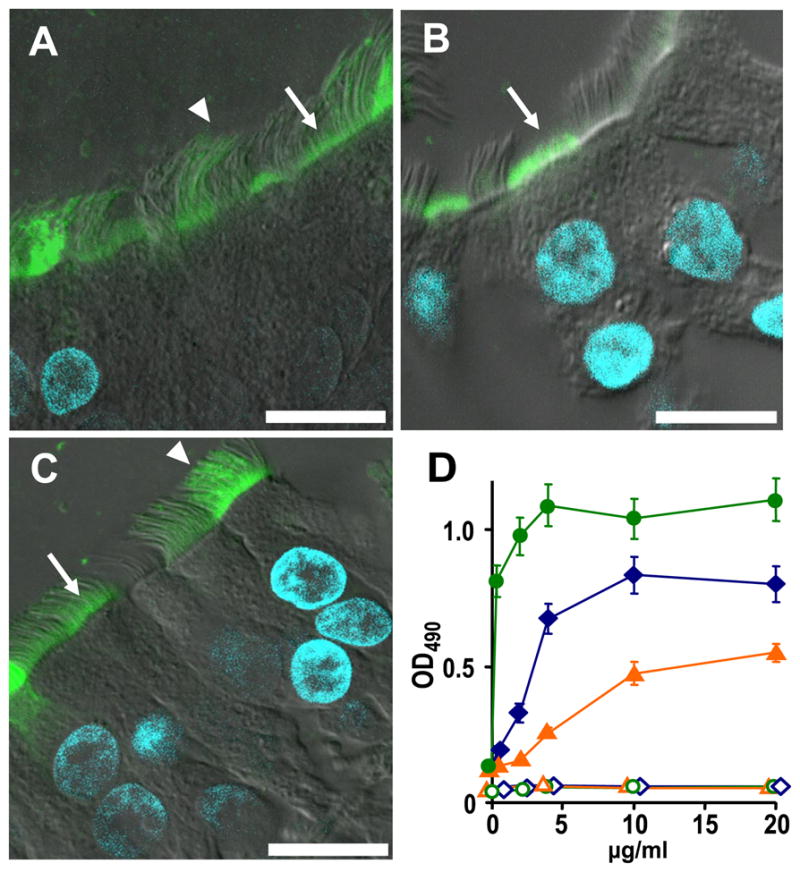
The localization of KS (A), MUC1 (B), and WGA (C) were studied in primary HBE cells as indicated under “Experimental Procedures.” Anti-KS antibody and WGA bound to the apical plasma membrane (arrow) and cilia (arrowhead), while MUC1 antibody recognized mostly the apical plasma membrane (arrow). Bar = 10 μm. D, binding of SPA-HRP to apical HBE cell surface as quantitated with the colorimetric reaction of HRP and o-phenylenediamine under varied antibody/lectin concentrations. Live primary HBE cultures were incubated with anti-KS antibody (blue diamond), anti-MUC1 antibody (orange triangle), or biotinylated WGA (green circle) at indicated concentration. WGA binding quantitation required incubation with 2 μg/ml anti-biotin antibody. All samples were subsequently incubated with 1 μg/ml SPA-HRP (solid symbols) or buffer (open symbols). Values are mean ± S.E. of three Transwells/subject established from two different subjects.
Next, we examined the luminescence generated by cell-attached SPA-luc in response to exogenously added ATP. Luminescence was linear in the range of 10–10,000 nM exogenous ATP and was similar for the three different methods of anchoring SPA-luc to the cell surface (Fig. 3A). Nonspecific binding of SPA-luc occurred but generated ~20-fold less luminescence than SPA-luc attachment via antibodies or lectin (Fig. 3A). Notably, the ATP-luminescence curves were flatter in the 0–10 nM range, which likely reflected the contribution of endogenous ATP release by HBE cells (compare the curves with those made in wells without cells (Fig. 3B)). The ATP sensitivity of SPA-luc complexed to HBE cells was compared with that of known concentrations of SPA-luc in solution. The ATP-luminescence relationship of SPA-luc bound to the cells (Fig. 3A) aligned best with that of 10 μg/ml SPA-luc dissolved in 100 μl of buffer (Fig. 3B). Thus, bound SPA-luc was equivalent to ~1 μg/culture or ~ 0.88 μg/cm2 of culture surface.
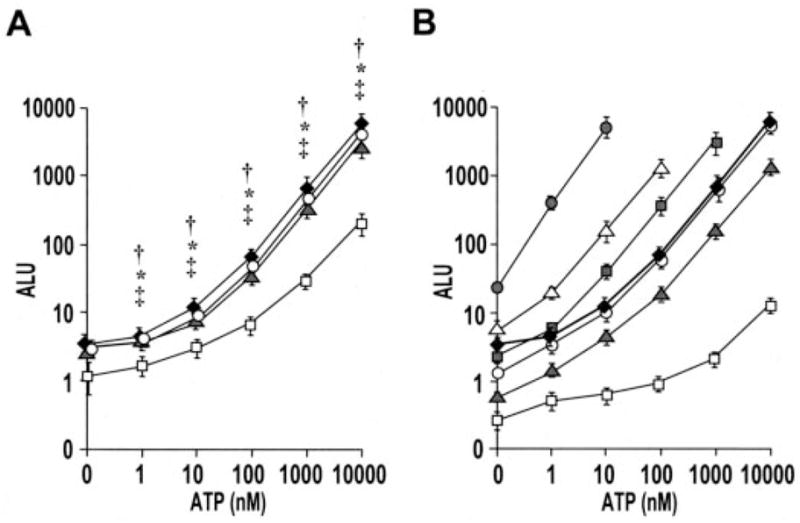
A, primary HBE cells were first incubated with buffer (open squares), anti-KS antibody (10 μg/ml) (solid diamonds), anti-MUC1 antibody (20 μg/ml) (gray triangles), or biotinylated WGA (4 μg/ml) and subsequent anti-biotin antibody (2 μg/ml) (open circles). The cultures were subsequently incubated with SPA-luc (0.5 mg/ml) and rinsed as described under “Experimental Procedures.” Changes in luminescence in response to the addition of ATP of varied concentrations were measured in real-time with 10-s integration. Values are mean ± S.E. of 3 Transwells/subject established from three different subjects. †, *, and ‡ indicates significant difference (p < 0.05) between specific (via KS, WGA, and MUC1, respectively) and nonspecific SPA-luc attachment. B, ATP calibration curves were generated with 500 μg/ml (gray circles), 50 μg/ml (open triangles), 25 μg/ml (gray squares), 10 μg/ml (open circles), 5 μg/ml (gray triangles), and 0.5 μg/ml (white squares) SPA-luc in solution (100 μl on 12-mm Transwell). Values are mean ± S.E. of two separate experiment with n = 3 for each. The ATP sensitivity curve from HBE cell-attached SPA-luc labeled with KS (solid diamonds, same as the “KS” curve in Fig. 3A) was aligned best with bulk 10 μg/ml. ALU values in Fig. 3 and those in Table 1 were obtained under different assay conditions (e.g. a different luminometer, buffer, luciferin/luciferase amount, and dilutions) and thus resulted in different scales of values.
Basal ATP Concentrations
To accurately assess basal ATP concentrations on HBE cell surfaces, we investigated the effect of ASL volume on ATP concentrations on resting cells utilizing a spectrum of techniques. The ATP concentrations in varied ASL volumes on resting WD HBE cultures were accordingly measured by: 1) pipette- or micro-sampling and off-line luminometry, 2) real-time luminometry with soluble luciferase (Sigma), and 3) real-time luminometry with cell-attached SPA-luc. Basal ATP concentrations were similar (1–10 nM) over a range of ASL volumes as measured by the three techniques (Fig. 4). However, micro-sampling generated more variability than real-time luminometry, likely reflecting shear stress artifacts induced by the aspiration of liquid.
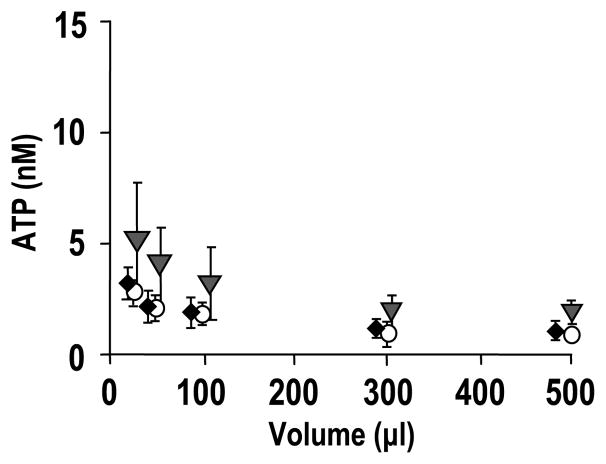
ATP concentrations on resting primary HBE surfaces in varied ASL volumes, as measured by off-line measurement of pipetted or micro-sampled samples (gray triangles), real-time measurement by luciferase dissolved in bulk ASL (open circles), and real-time measurement by cell-attached SPA-luc (via KS, solid diamonds), respectively. Values are mean ± S.E. of 4 Transwells/subject established from three different subjects.
Basal ATP Release Rates
ATP concentrations on resting HBE cells reflect the balance between basal ATP release and hydrolysis (10). For example, ATP (500 nM) added to 300 μl of ASL on HBE cells exhibited a half-life of ~0.5 min, illustrating the activity of ecto-nucleotidases on HBE cell surfaces (Fig. 5A). Addition of the nucleotidase inhibitors, β, γ-methylene-ATP, ebselen, or levamisole, each of which blocks a different ecto-nucleotidase enzyme family expressed on WD HBE surface, partially inhibited ATP hydrolysis (Fig. 5A). When combined together, the three inhibitors exhibited an additive effect, producing a >50-fold reduction in the rate of ATP hydrolysis. Therefore, the combination of the three enzyme inhibitors was utilized to assess ATP release rates from resting cells.
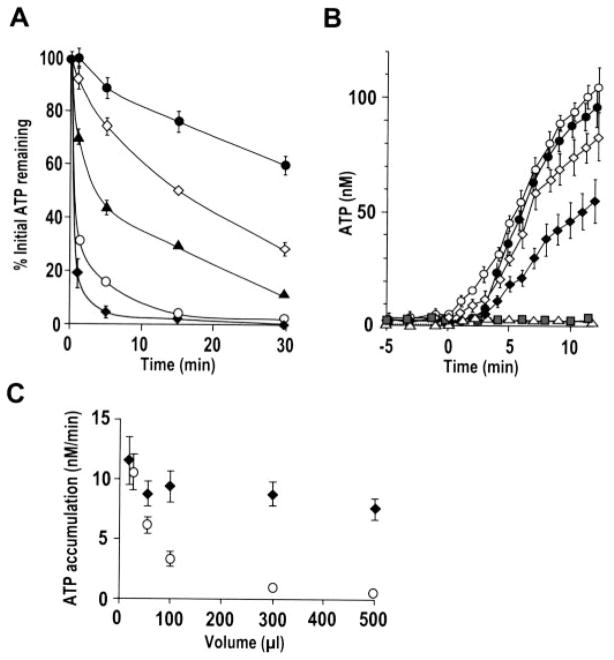
A, following mucosal preincubation (2 min) with vehicle or ecto-nucleotidase inhibitors, 500 nM ATP was added to 300 μl of ASL on resting HBE cells and its hydrolysis rate measured by off-line luminometry of samples taken at indicated time points. Addition of inhibitors (β, γ-methylene-ATP (300 μM; open diamonds), levamisole (10 mM; solid triangles), ebselen (30 μM; open circles), or the three inhibitors together (solid circles)) resulted in significant delay in ATP hydrolysis compared with control (solid diamonds). B, ATP accumulation following addition of the inhibitor mixture (at t = 0) was measured by soluble luciferase (open symbols) or cell-attached SPA-luc (via KS, solid symbols) in 25 μl (circles) or 50 μl (diamonds) ASL. As controls, vehicle was added to cells (open triangles), or the inhibitor mixture was added to wells without cells (gray squares), and luminescence measured in 50 μl with soluble luciferase. C, summary data illustrating basal ATP accumulation (nM/min) following addition of the inhibitor mixture as measured by soluble luciferase (open circles) and cell-attached SPA-luc (diamonds) in varied ASL volumes. In A–C, values are mean ± S.E. of 3–4 Transwells/subject established from three different subjects. Data without cells are mean ± S.E. of two separate experiments with n = 3 for each.
Under conditions where nucleotidases were maximally inhibited, endogenous ATP accumulation was measured by cell-attached SPA-luc and by luciferase dissolved in the mucosal liquid. Addition of the inhibitor mixture to the ASL resulted in ATP accumulation (Fig. 5B). Changes in ATP concentrations were negligible when the inhibitor mixture was added to luciferase containing solution in wells without cells or when vehicle alone was added to cells (Fig. 5B), suggesting that the ATP accumulation observed on resting cells following near-complete inhibition of ecto-nucleotidases reflected basal ATP release.
In 50 μl (~28 μm liquid height (33)) or larger ASL volume, ATP accumulation rate (nM/min) measured by cell-attached SPA-luc was significantly greater than that measured by soluble luciferase, with a smaller difference in smaller volume (Fig. 5, B and C). However, the difference was lost when ATP accumulation was measured in 25 μl of ASL (Fig. 5, B and C), suggesting that the 25-μl volume (~14 μm height) was close to the area/height probed by cell-attached SPA-luc. Cell-attached SPA-luc measured similar ATP accumulation rates among varied ASL volumes ranging from 500 to 25 μl (Fig. 5C). With soluble luciferase, changes in ATP concentrations (nM/min) inversely correlated with volume; importantly, changes in rates of ATP accumulation (fmol/min) were similar among the five conditions (230.6 ± 34.5, 258.5 ± 28.1, 245.7 ± 18.8, 234.0 ± 13.5, and 219.6 ± 22.5 fmol/min/cm2 culture surface area in 25, 50, 100, 300, and 500 μl of ASL, respectively, p = 0.339).
ATP Release in Response to Hypotonic Challenge
We next investigated the regulation of ATP release in response to a physiological stimulus. Hypotonic challenge is a commonly used and reproducible stimulus to trigger ATP release from various types of cells (34–36). In our WD HBE culture system, apical 33% hypotonic challenge (67% of normal osmolality), which is relevant to the in vivo scenario whereby glands secrete their hypotonic content onto airway surfaces, induced a robust increase in ATP concentration as measured by conventional micro-sampling and off-line luminometry (Table 2). Compared with other physiologic or therapeutic stimuli, i.e. phasic shear stress to mimic tidal breathing (0.6–2 dynes/cm2) or luminal hypertonic challenge to mimic the inhalation of hypertonic saline (7%), which has been reported to improve mucociliary clearance and lung function in CF patients (37), hypotonic challenge appears to be one of the most potent stimuli to induce ATP release in airway epithelial cells (Table 2). It is also a technically suitable stimulus for our real-time measurement system.
TABLE 2
Following the stimulus, luminal ATP concentration on HBE cells were measured by micro-sampling (from 50 μl of ASL) and off-line luminometry. Samples were taken at 1 and 5 min after the hypotonic and hypertonic challenge, respectively, and 30 min after initiation of phasic motion, which reflect near maximal ATP concentration in response to each stimulus. Values are mean ± S.E. of 4 Transwells/subject established from three different subjects.
| Stimuli | ATP concentration |
|---|---|
| nM | |
| None | 4.1 ± 1.2 |
| Luminal hypotonic (200 mosM) | 335 ± 63 |
| Luminal hypertonic (7% NaCl, i.e. 2.3 osM) | 176 ± 25 |
| Phasic motion (0.6 dynes/cm2) | 51 ± 3.8 |
Following 33% hypotonic challenge, ATP concentrations were measured by the three techniques described above in varied ASL volumes. The off-line luminometry, as well as real-time luminometry with soluble luciferase, measured ATP concentrations that were inversely correlated with ASL volume (Figs. 6A, B, and H), likely reflecting dilution of ATP into the bulk solution. In contrast, as measured by SPA-luc attached to the cell surface via KS, MUC1, or WGA, ATP concentrations established transiently at the apical cell surface following hypotonic challenge were independent of ASL volume (Fig. 6, C, D, and H). Peak ATP concentrations detected by cell-attached SPA-luc (~1 μM) were significantly higher than those detected by soluble luciferase in 500, 300, and 100 μl of ASL, although this difference was no longer evident in 50 and 25 μl of ASL volume. No significant changes in ATP concentrations were observed with an isosmotic challenge (Fig. 6, E–G).
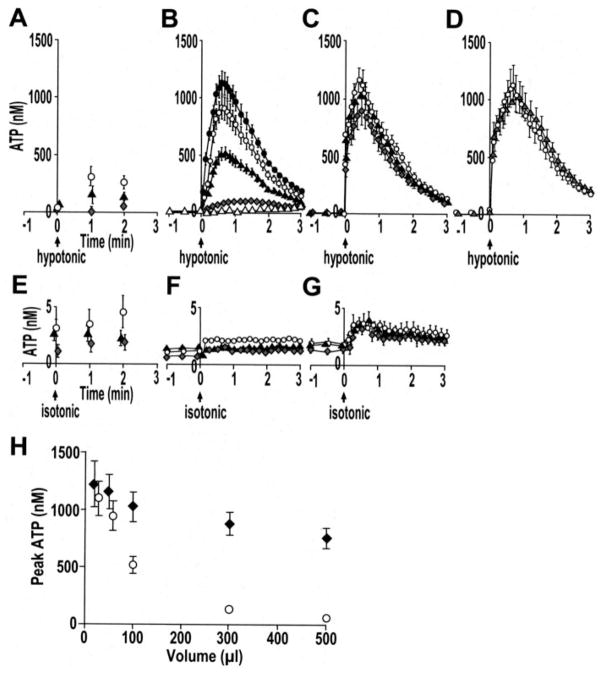
Primary HBE cultures were exposed to luminal 33% hypotonic challenge (A–D) or an isosmotic challenge (E–G). ATP concentrations were measured by different techniques and varied ASL volumes (i.e. 500 μl (open triangles), 300 μl (gray diamonds), 100 μl (solid triangles), 50 μl (open circles), and 25 μl (solid circles)); A and E, off-line luminometry of samples; B and F, real-time luminometry with soluble luciferase; C, and G, real-time luminometry with cell-attached SPA-luc via KS; D, real-time luminometry with cell-attached SPA-luc via MUC1 (gray triangles) or WGA (open circles) in 50 μl of ASL. H, summary data illustrating peak ATP concentration as measured by soluble luciferase (open circles) and cell-attached SPA-luc (via KS, solid diamonds) in varied ASL volumes. In A–H, values are mean ± S.E. of 4 Transwells/subject established from three to four different subjects.
The initial rate of ATP release following hypotonic challenge was assessed with soluble luciferase by adding the nucleotidase inhibitor mixture to 50 μl of ASL. In resting cells, ATP accumulated at a rate of ~250 fmol/min/cm2 (Fig. 7C, inset). The rate of ATP accumulation (i.e. release) dramatically increased by ~3 logs to 200–900 pmol/min/cm2 during the first 15 s following hypotonic challenge (Fig. 7, C and D). This robust ATP release rate relaxed toward the basal ATP release rate over 10 min (Fig. 7D).
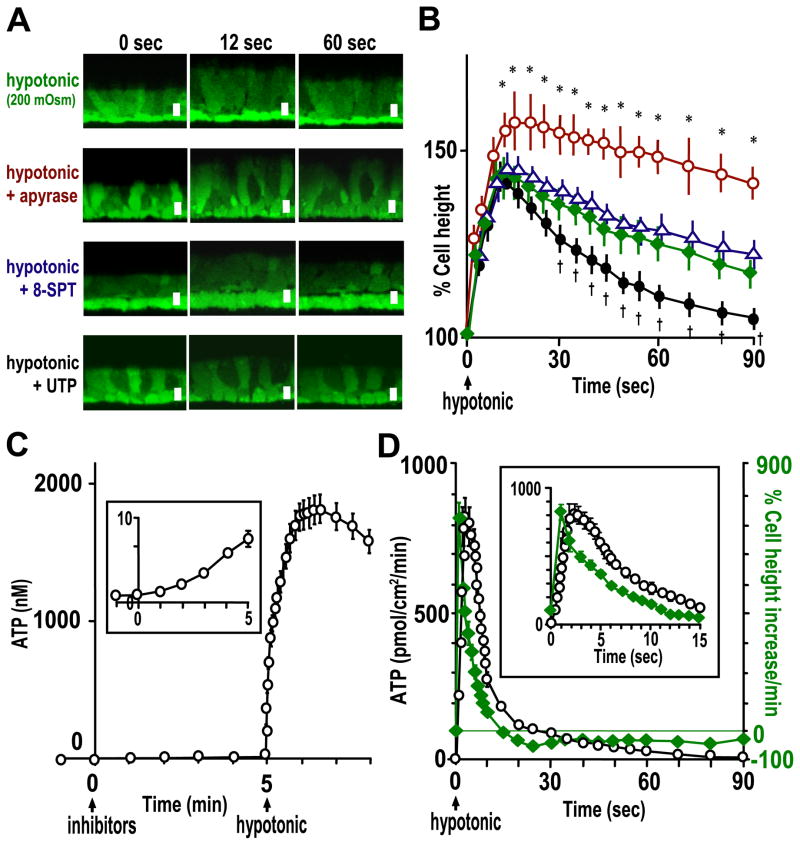
A, representative images of calcein-labeled primary HBE cells in swelling and RVD phases following hypotonic challenge. Top panels, 33% hypotonic challenge; second and third panels, cultures were pretreated with apyrase (10 units/ml) for 5 min or 8-SPT (100 μM) for 30 min, respectively, and H2O (i.e. 33% hypotonic challenge) including those reagents added at t = 0; bottom panels, UTP (100 μM) was added at t = 12 s following hypotonic challenge at t = 0. Bar, 10 μm. B, quantitative data from protocols shown in A of HBE cells treated with vehicle (green diamonds), apyrase (red circles), 8-SPT (blue triangles) or UTP (black circles). * and † indicate significant difference (p < 0.05) between the indicated point and a time-matched vehicle point. C, to measure the accumulation rates of released ATP, the nucleotidase inhibitor mixture (i.e. 300 μM β, γ-methylene-ATP, 30 μM ebselen, and 10 mM levamisole) were added to ASL (50 μl) containing soluble luciferase at t = 0 and 33% hypotonic challenge applied at t = 5 min. The inset is the magnified scale for the ATP concentration at t = −1–5 min. D, initial rates of ATP release following hypotonic challenge (black circles) were calculated from ATP accumulation rates in the presence of the nucleotidase inhibitors (in C) and aligned in comparison with the rate of cell height change (green diamonds;+, increase;−, decrease) measured in calcein-labeled cells. In the inset, data points for ATP accumulation rates represent values of every 0.2 s for 2 s, every 0.4 s for next 4 s, then every second for next 9 s, calculated from the raw data acquired every 0.2 s; data points for cell height change represent values of every second from the raw data acquired every second. In B–D, values are mean ± S.E. of 4 Transwells/subject established from three different subjects.
ATP Mediates the Regulatory Volume Decrease (RVD)
Based on the observation that a large increase in ATP release rates allowed the transient accumulation of ~1 μM ATP at the cell surface, which is in the range that could activate P2Y2-R, we searched for a physiological role for ATP release in the cell volume response to hypotonic stimuli. Hypotonic challenge (33%) caused the osmotic swelling of HBE cells to ~150% of initial height (Fig. 7, A and B), which indicates that airway epithelial cells behaved as nearly perfect luminal osmometers (38). Subsequently, a RVD was observed (Fig. 7, A and B). Alignment of cell height change and ATP release rate illustrates that the major increase in ATP release occurred during the initial swelling phase (within 15 s following hypotonic challenge) (Fig. 7D, inset).
Treatment with apyrase blunted and delayed the RVD of the cultures (Fig. 7, A and B), suggesting that ATP played a role in facilitating the RVD process. Addition of exogenous ATP, UTP, or ATPγS at the peak of cell swelling facilitated RVD (Fig. 7, A and B). In contrast, treatment with 8-SPT produced no significant change in the swelling or RVD process (Fig. 7, A and B). These data suggest that the effect of ATP release on RVD is not exerted by metabolic conversion of ATP to ADO but likely via P2Y2-R activation (and subsequent volume-sensitive Cl− channel and K+ channel activation (39)), as suggested in other cell types (15, 40).
Ca2+i Dependence of Hypotonicity-induced ATP Release
It has been proposed previously that osmotic cell swelling-induced ATP release is Ca2+i-dependent. For example, hypotonic cell swelling-induced ATP release from lung alveolar A549 cells, retinal pigment epithelial ARPE-19 cells, and intestine 407 cells was significantly inhibited by Ca2+i chelation (34, 41, 42). To test for the contribution of Ca2+i-dependent mechanisms to hypotonicity-induced ATP release in WD primary HBE cultures, cells were loaded with BAPTA-AM with a protocol that completely blocked receptor-mediated Ca2+i mobilization (Fig. 8A). HBE cells were subsequently challenged with luminal 33% hypotonicity. BAPTA-treated cultures exhibited a decrease in peak ATP concentration of ≤10% compared with vehicle-treated (Fig. 8B). Furthermore, no changes in cell swelling (i.e. a trigger for ATP release) and RVD (i.e. a function of released ATP) properties in BAPTA loaded cells were detected (Fig. 8C).
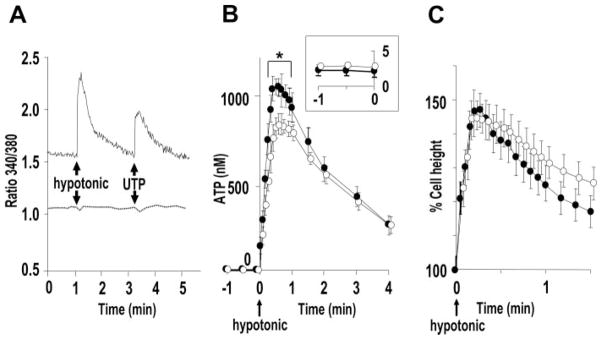
A, representative Ca 2+i tracings depicting the effect of apical hypotonic challenge (33%) and UTP (100 μM) in Fura-2-loaded primary HBE cultures loaded with BAPTA (100 μM) (dotted line) or vehicle (solid line). B, hypotonicity (at t = 0) induced ATP release from HBE cultures loaded with BAPTA (100 μM) (open circles) or vehicle (solid circles) as measured by soluble luciferase in 50 μl of ASL. The inset is the magnified scale for ATP concentrations measured during t = −1 to 0 min. * indicates significant difference (p < 0.05) between values of BAPTA- and vehicle-loaded cultures at the indicated time point. C, the cell height change following hypotonic challenge (i.e. swelling and RVD properties) quantitated in HBE cultures loaded with BAPTA (100 μM) (open circles) or vehicle (solid circles) with the same protocol as Fig. 7. In B and C, values are mean ± S.E. of 4 Transwells/subject established from three different subjects.
ATP Release and Cell Volume Regulation in CF HBE Cells
Whether CFTR contributes to ATP release remains controversial (see “Discussion”). Taking advantage of our approach to accurately measure cell-surface ATP concentrations, we compared ATP concentrations and release rates from resting and hypotonically stimulated primary CF HBE cultures with those from age-matched normal (non-CF) HBE cultures. Basal ATP concentrations were 1.10 ± 0.076 nM (CF) and 1.33 ± 0.107 nM (normal) HBE cultures (p = 0.157, n = 3 with 4 Transwells/subject). Corresponding basal ATP release rates were 265.8 ± 26.38 fmol/min/cm2 for CF cultures and 227.1 ± 28.13 fmol/min/cm2 for normal HBE (p = 0.373). Hypotonicity-induced ATP release was also not different (p > 0.05) between CF and normal HBE cells (Fig. 9A). Furthermore, no differences in cell swelling or RVD properties following hypotonicity were detected between CF and normal HBEs (Fig. 9B). In separate experiments, pretreatment of normal HBE cells with a CFTR inhibitor (inh-172 (Sigma), 10 μM for 30 min at 37 °C) also did not affect basal and hypotonicity-induced ATP release (Fig. 9A).
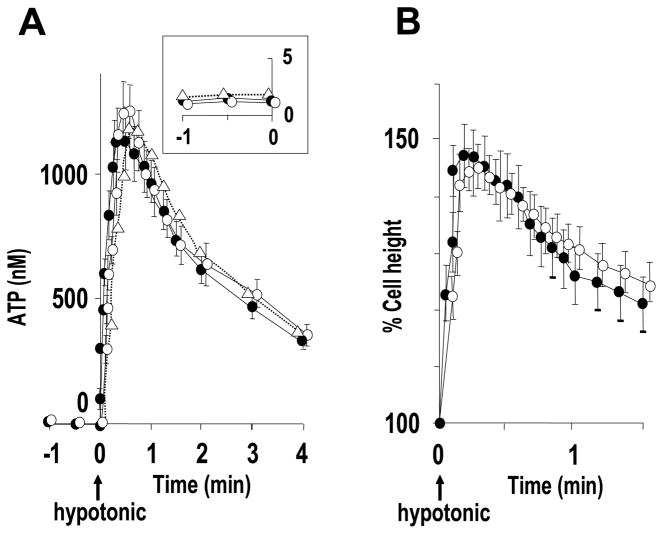
A, hypotonicity (at t = 0) induced ATP release from CF (open circles), age-matched normal (solid circles), and inh-172-treated (10 μM, 30 min) normal (open triangles) HBE cultures as measured by soluble luciferase in 50 μl of ASL. The inset is the magnified scale for ATP concentrations measured during t = −1 to 0 min. B, the cell height change following hypotonic challenge was quantitated in CF (open circles) and normal (inh-172-untreated, solid circles) HBE cultures with the same protocol as Fig. 7. Values are mean ± S.E. of four Transwells/subject established from three different subjects.
DISCUSSION
It has been difficult previously to measure ATP concentrations in the thin films of ASL that interface with apical membrane purinoceptors to control airway defense functions. Generation of a partially purified SPA-luc protein with luciferase activity similar to that of commercially available luciferase (Fig. 1 and Table 1) and the ability to bind relatively large quantities of SPA-luc to endogenous antigens on the apical surface of HBE cells (Figs. 2 and and3)3) enabled us for the first time to measure ATP concentrations at apical membrane surfaces of primary airway epithelia. Previously, purification of SPA-luc was performed using bovine IgG-agarose beads. However, this approach was associated with acidification and loss of luciferase activity (43), and consequently, crude lysates of SPA-luc transformed E. coli were utilized (19). Our study demonstrates that addition of His6 tag to SPA-luc allows purification of the protein via a Ni2+-chelating column while maintaining luciferase activity through the purification process and resulting in 100-fold increase in specific activity from that initially detected in E. coli homogenate. Our partially purified SPA-luc contained no contaminants that might interfere with luminescence or cellular ATP release (Figs. 3B and and4).4). When maximal amounts of SPA-luc was bound to WD HBE cell surfaces, the ATP sensitivity was ~1 nM (Fig. 3A), a value similar to that obtained with soluble luciferase in real-time ATP measurements.
In this condition, ATP concentrations in ASL covering resting HBE cell surfaces were in the 1–10 nM range, irrespective of ASL volumes and the method of detection (i.e. cell-attached SPA-luc, soluble luciferase, and off-line luminometry) (Fig. 4). The absence of any differences in ATP concentrations among the various conditions suggests that vertical ATP gradients do not exist under resting conditions. This observation is in line with previous measurements of ATP concentration on resting epithelial and non-epithelial cell lines (10). Furthermore, it is consistent with the prediction based on mathematical models that, if ATP release rates are not perturbed by differences in ASL volume, the steady state ATP concentration on resting cells should be volume-independent (44). These data illustrate that once a balance between ATP release and hydrolysis rates is established, ATP concentrations on resting HBE cell surfaces are maintained well below the range to activate P2Y2-R. Note, however, recent data suggest that under resting conditions the concentration of the ATP metabolite, ADO, in ASL is ~100 nM, which is in a range to regulate CFTR-mediated ion transport and ASL volume via A2b receptor activation (8).
Primary HBE cells express members of both families of ecto-nucleotidases, i.e. eNPPs and eNTPDases, as well as ecto-alkaline phosphatases (31, 45, 46), which are inhibited by β, γ-methylene-ATP, ebselen, and levamisole, respectively. Consistent with this notion, addition of a mixture of the three inhibitors resulted in a >50-fold reduction in ATP hydrolysis rates (Fig. 5A), which, in turn, resulted in ATP accumulation in ASL at a rate of ~250 fmol/min/cm2 culture surface area or ~1.5 pmol/min/million cells (Fig. 5, B and C). This value is similar to the ATP release rates obtained from resting primary human airway epithelial cultures by measuring hydrolysis rate of [γ-32P]ATP (8, 11). The similarity in the rates among ASL volumes ranging from 25 to 500 μl suggests that the basal ATP release rate is independent of ASL volume. Since these release rates were obtained in the absence of external stimuli, we speculate that basal ATP release reflects a “constitutive” process.
A recent study suggested that when cultures were maintained under phasic shear stress, which mimics conditions in vivo, P2Y2-R signaling becomes a key contributor to ASL volume regulation, likely reflecting enhanced ATP release (9); however, the regulation of cell surface ATP concentrations is unknown. In the current study, we asked whether hypotonic challenge increases cell-surface ATP concentrations into the range that activate P2Y2-R. Real-time luminometry enabled us to closely monitor dynamic ATP levels, including peak ATP concentrations, which sampling techniques could miss. The ATP concentrations measured by cell-attached SPA-luc (Fig. 6, C and D) were markedly greater than those detected by off-line luminometry (Fig. 6A) for any given time and ASL volume, reflecting differences in ATP concentrations at the cell surface and in bulk ASL. Moreover, ATP concentrations measured by luciferase dissolved in bulk solution (Fig. 6B) were intermediate between those measured by cell-attached SPA-luc (Fig. 6, C and D) and those measured by pipette- or micro-sampling (Fig. 6A). These findings support the notion that measurement by soluble luciferase reflects the ATP concentration throughout the ASL, averaging a gradient from at or near the site of release (Fig. 6, C and D) and the upper aspect of the mucosal liquid (Fig. 6A). The apparent development of a vertical gradient in ATP concentrations and a delay in observing peak ATP concentration after hypotonic challenge was progressively more evident in larger volumes, which likely reflected: 1) dilution of released ATP into a larger volume, 2) rapid hydrolysis of released ATP before diffusion into the bulk, and 3) delayed diffusion of ATP due to unstirred surface layer effects.
Interestingly, in smaller volume, i.e. 25 or 50 μl of ASL, ATP measurements with soluble luciferase approximated those with cell-attached SPA-luc (Fig. 6, B, C, and H), suggesting that soluble luciferase, when present in a small enough volume, can be used to assess near surface ATP concentrations even under conditions of high and rapidly changing ATP release. Importantly, 25 μl volume on 1.13-cm2 culture surface (which establishes ~14 μm ASL height on Transwells due to the surface tension) exceeds the ASL height/volume on normal human airway surfaces (~1 μl/cm2 and 7 μm high), suggesting that vertical ATP gradients are not generated in vivo.
Pharmacological studies have illustrated that mucosal UTP and ATP are equipotent and equi-efficacious in promoting Ca2+i mobilization and facilitating Cl− secretion in polarized primary human airway epithelial cultures (16, 17), suggesting that the P2Y2-R is a major nucleotide receptor on human airway epithelial lumen. In addition to P2Y2-R, P2X4, and P2X6 receptors also have been reported to be expressed in airway epithelial cells (47–49). The EC50 values for P2Y2, P2X4, and P2X4/6 receptors are ~1, 1.7, and 12 μM, respectively (50, 51). Therefore, the ~1 μM ATP concentration, detected by cell-attached SPA-luc following hypotonicity, is sufficient for activation of nucleotide receptors endogenously expressed on HBE cells.
Consequently, we explored how ATP release contributes to the physiological epithelial responses to hypotonic challenge. Similar to the data previously reported in murine airway epithelia (15), hypotonic luminal challenge produced an acute increases in cell volume followed by a RVD response in HBE cells (Figs. 7A and B). Data from apyrase, ATP, UTP, or 8-SPT-pretreated cultures (Fig. 7, A and B) suggest that the released ATP triggered RVD via P2Y2-R but not A2b receptor activation. These data were consistent with the observation that RVD was preserved in CFTR-deficient HBE cells (Fig. 9B), demonstrating that RVD is independent of A2b receptor-mediated CFTR activation (Fig. 7B). Interestingly, inhibition of P2Y2-R-mediated increases in Ca2+i had little effect on swelling nor did it cause significant impairment of RVD (Fig. 8C). These observations contrast with reports of Ca2+i-dependent swelling and RVD in Mz-ChA-1 human cholangiocarcinoma cells (52), HeLa cells (53), and Calu-3 human airway epithelial cells.3 Thus, we speculate that primary HBE cells can maintain RVD function even when the P2Y2-R-Gq/phospholipase C-mediated Ca2+i mobilization is blocked, possibly via alternative pathways such as Ca2+i-independent members of protein kinase C or other protein kinases. Indeed, ATP-phospholipase C-dependent, Ca2+i-independent activation of extracellular signal regulated kinase 1/2 has been reported in primary human skeletal muscle cells (54).
Hypotonic challenge triggered a robust increase in cell height, which began to relax within ~15 s (Fig. 7D). The rates of ATP release tightly paralleled those of changes in cell height with a 1–3-s delay, suggesting that increases in cell volume triggers ATP release (Fig. 7D, inset). Thus, our data suggest that the major fraction of ATP release occurred during the cell swelling phase, which contrasts with a previous report in which ATP release predominantly occurred during the cell volume plateau period subsequent to the swelling (34). The discrepancy may be explained by the different ATP measurement approaches used. Features of our current cell-surface ATP detection approach, in contrast to the previous off-line luminometry from collected bulk solution (34), include a more accurate assessment of magnitude of cell-surface ATP concentrations and improved time resolution for detecting ATP release.
After swelling, the RVD process returned the swollen cells to the prestimulus condition without detectable calcein leakage from the cytoplasm, illustrating that there was little, if any, contribution of cell lysis to swelling-induced ATP release (15). Non-lytic mechanisms for hypotonicity-induced ATP release may include regulated exocytosis and/or conductive/transporter pathways (41, 55, 56). The driving force for ATP release onto the surface of HBE cells via conductive pathways is large, i.e. ~5 mM in cytosol versus <10 nM in ASL. The mass of ATP in vesicles available for rapid release is unknown, although it is likely large as well (57). The ~1000-fold increase in ATP release rates triggered by hypotonic challenge may be contributions from either pathway. Regulated exocytosis typically requires Ca2+i (58), whereas the Ca2+i dependence of conductive/transporter pathways is mostly unknown. We tested the Ca2+i dependence of hypotonicity-induced ATP release from primary HBE cells. Under the condition where Ca2+i mobilization was completely blocked by BAPTA (Fig. 8A), HBE cells exhibited only a ~10% decrease in peak ATP concentrations (Fig. 8B), without changes in swelling/RVD properties (Fig. 8C). The relative absence of Ca2+i dependence of ATP release in WD HBE cells contrasts to the large Ca2+i dependence reported in immortalized airway cells (34). Our data, therefore, suggest that regulated exocytosis is not a major pathway for ATP release from primary WD HBE cells, although we cannot unambiguously rule out the possibility that local Ca2+i concentrations necessary for vesicle-plasma membrane fusion were not accessible by BAPTA. We speculate that Ca2+i-independent conductive/transporter pathways that contributed to hypotonicity-induced ATP release from WD HBE cells are contained within the ciliated cells that are the predominant cell type within our culture system (59).
Whether CFTR contributes to conductive ATP release from ciliated cells has been controversial. Many studies support the notion that CFTR mediates ATP release (60–62) or potentiates ATP release by regulating a separate ATP path (63–65). A recent model proposed that constitutive fusion and insertion of CFTR at the plasma membrane is required for ATP release from retinal pigment epithelial cells (41). However, other studies failed to detect a difference in extracellular ATP concentrations and ATP release rates between CFTR-deficient epithelial cells and controls (8, 11, 12, 36, 66, 67). Our current data illustrate that ATP concentrations at the cell surface and ATP release rates were comparable in CF and non-CF HBE cells and that the CFTR inhibitor (inh-172) did not affect swelling-induced ATP release (see “Results” and Fig. 9A). These results strongly argue against contribution of CFTR in ATP release in WD HBE cells. Other candidates for conductive pathways, e.g. connexin 38 hemichannels (68) or maxi-anion channels (23, 69–71), remain to be investigated. Our data suggest, however, that connexin 32 hemichannels (Cx32) are not largely involved in swelling-induced ATP release since Cx32 required Ca2+i elevation to efflux ATP from ECV304 bladder cancer epithelial cells (72).
Airway epithelia exhibit a complex phenotype, with differentiated surface cells that comprise ciliated cells and goblet cells covering layers of basal cells. Although WD HBE cultures are dominated by ciliated cells, the contribution of ciliated cells versus non-ciliated cells (e.g. goblet cells) to ATP release in airway epithelia is not known. Since anti-KS antibodies mostly labeled ciliated cells (73), while anti-MUC1 antibodies labeled non-ciliated cells (Fig. 2), our cell-attached SPA-luc approach could potentially be useful to investigate the cell-type specificity of ATP release. However, because of the rapid horizontal diffusion of ATP from one cell to a neighboring cell, the ATP signals from cell-attached SPA-luc may not accurately reflect released ATP from the cell to which it is attached. Indeed, SPA-luc attached to different antigens reported similar kinetics of ATP release following a hypotonic challenge (Fig. 6, C and D), which illustrates the limitation of the SPA-luc approach in horizontal spatial resolution with the current luminometer techniques (i.e. Turner TD-20/20).
In summary, we demonstrated that the ATP concentrations near the cell surface of airway epithelia are similar to those in bulk ASL under resting conditions but are higher in conditions where ATP release rates are dynamically changing. ATP concentrations, maintained in the 1–10 nM range on resting airway epithelia, represent the steady state contributions of basal ATP release (~300 fmol/min/cm2) and ecto-metabolism. In response to hypotonic challenge, however, cell surface ATP concentrations rise rapidly to ~1 μM, into the range of P2 receptor activation, reflecting 3-log increases in ATP release rates. A minor portion of hypotonicity-induced ATP release was Ca2+i-dependent, suggesting that a Ca2+i-independent pathway, e.g. a conductive pathway, provided the burst release of ATP from hypotonicity-stimulated HBE cultures. However, the CFTR Cl− channel was not required in this function. ATP release triggered by hypotonic cell swelling facilitated RVD via P2Y2-R activation, demonstrating a dynamic interplay among ATP release, cell-surface ATP concentrations, and cell volume regulation. Finally, this approach that measures ATP at the cell surface of polarized epithelia should be of use for future studies of ATP release in response to other physiological stimuli, e.g. flow-induced shear, and for studies to identify the mechanisms of epithelial ATP release.
Acknowledgments
We are grateful to Dr. George Dubyak (Case Western Reserve University) for providing pMALU5 construct, Dr. Wanda O’Neal and Lisa Jones for help in generating pT7-HTb/SPA-luc construct, Dr. Anthony Paradiso for help in Ca2+ experiments, Dr. Brian Button for access to the in-house phasic motion device, Drs. Maryse Picher and Raymond Pickles for helpful discussions, Dr. Scott Randell and University of North Carolina Tissue Core Facility for supply of primary HBE cells, and the University of North Carolina Michael Hooker Microscopy Facility for support in laser scanning confocal microscopy studies.
Footnotes
*This work was supported by the National Institutes of Health Grant NIH/NHLBI 5 P01 HL 34322-18 and Cystic Fibrosis Foundation Grant CFF R026-CR02 (both to R. C. B.).
2The abbreviations used are: P2Y2-R, P2Y2 receptor; ADO, adenosine; CF, cystic fibrosis; CFTR, cystic fibrosis transmembrane conductance regulator; ASL, airway surface liquid; Ca2+i, intracellular calcium; SPA-luc, Staphylococcus aureus protein A-luciferase; HBE, human bronchial epithelial; WD, well differentiated; KS, keratan sulfate; WGA, wheat germ agglutinin; ELISA, enzyme-linked immunosorbent assay; HRP, horseradish peroxidase; PBS, phosphate-buffered saline; BSA, bovine serum albumin; HBSS, Hanks’ balanced salt solution; ALU, arbitrary light unit; BAPTA, 1,2-bis(2-amino-pheoxy)ethane-N,N,N′,N′-tetraacetic acid; AM, acetoxymethyl ester; RVD, regulatory volume decrease; 8-SPT, 8-(p-sulfophenyl)theophylline; ATPγS, adenosine 5′-O-(thiotriphosphate).
3S. F. Okada et al., unpublished observation.
References
Full text links
Read article at publisher's site: https://doi.org/10.1074/jbc.m603019200
Read article for free, from open access legal sources, via Unpaywall:
http://www.jbc.org/article/S0021925819476382/pdf
Citations & impact
Impact metrics
Citations of article over time
Alternative metrics

Discover the attention surrounding your research
https://www.altmetric.com/details/102674692
Article citations
Extracellular Purine Metabolism-Potential Target in Multiple Sclerosis.
Mol Neurobiol, 61(10):8361-8386, 18 Mar 2024
Cited by: 0 articles | PMID: 38499905
Review
Pharmacological Nature of the Purinergic P2Y Receptor Subtypes That Participate in the Blood Pressure Changes Produced by ADPβS in Rats.
Pharmaceuticals (Basel), 16(12):1683, 03 Dec 2023
Cited by: 0 articles | PMID: 38139810 | PMCID: PMC10747513
Pharmacological potentiators of the calcium signaling cascade identified by high-throughput screening.
PNAS Nexus, 2(1):pgac288, 09 Dec 2022
Cited by: 2 articles | PMID: 36712939 | PMCID: PMC9830948
Ratiometric ECL sensor based on Apt-AuNS@Lu nanoprobe for analyzing cell swelling-induced ATP release.
Mikrochim Acta, 189(11):423, 18 Oct 2022
Cited by: 0 articles | PMID: 36255523
ER-resident STIM1/2 couples Ca2+ entry by NMDA receptors to pannexin-1 activation.
Proc Natl Acad Sci U S A, 119(36):e2112870119, 29 Aug 2022
Cited by: 9 articles | PMID: 36037373 | PMCID: PMC9456761
Go to all (142) article citations
Similar Articles
To arrive at the top five similar articles we use a word-weighted algorithm to compare words from the Title and Abstract of each citation.
Nucleotide release provides a mechanism for airway surface liquid homeostasis.
J Biol Chem, 279(35):36855-36864, 21 Jun 2004
Cited by: 156 articles | PMID: 15210701 | PMCID: PMC2943374
Cystic fibrosis transmembrane regulator-independent release of ATP. Its implications for the regulation of P2Y2 receptors in airway epithelia.
J Biol Chem, 273(22):14053-14058, 01 May 1998
Cited by: 111 articles | PMID: 9593757
Purinergic signaling underlies CFTR control of human airway epithelial cell volume.
J Cyst Fibros, 3(2):99-117, 01 Jun 2004
Cited by: 27 articles | PMID: 15463893
Adenosine receptors, cystic fibrosis, and airway hydration.
Handb Exp Pharmacol, (193):363-381, 01 Jan 2009
Cited by: 15 articles | PMID: 19639288
Review
Funding
Funders who supported this work.
NHLBI NIH HHS (5)
Grant ID: P01 HL034322
Grant ID: R01 HL071131
Grant ID: P01 HL034322-21A10012
Grant ID: R01 HL076303
Grant ID: R01 HL076303-01A2


