Abstract
Free full text

Inducible formation of breast cancer stem cells and their dynamic equilibrium with non-stem cancer cells via IL6 secretion
Abstract
Tumors are often heterogeneous, being composed of multiple cell types with different phenotypic and molecular properties. Cancer stem-like cells (CSCs) are a highly tumorigenic cell type found in developmentally diverse tumors or cancer cell lines, and they are often resistant to standard chemotherapeutic drugs. The origins of CSCs and their relationships to nonstem cancer cells (NSCCs) are poorly understood. In an inducible breast oncogenesis model, CSCs are generated from nontransformed cells at a specific time during the transformation process, but CSC formation is not required for transformation. MicroRNA profiles indicate that CSCs and NSCCs are related, but different cell types arising from a common nontransformed population. Interestingly, medium from the transformed population stimulates NSCCs to become CSCs, and conversion of NSCCs to CSCs occurs in mouse xenografts. Furthermore, IL6 is sufficient to convert NSCCs to CSCs in genetically different breast cell lines, human breast tumors, and a prostate cell line. Thus, breast and prostate CSCs and NSCCs do not represent distinct epigenetic states, and these CSCs do not behave as or arise from classic stem cells. Instead, tumor heterogeneity involves a dynamic equilibrium between CSCs and NSCCs mediated by IL6 and activation of the inflammatory feedback loop required for oncogenesis. This dynamic equilibrium provides an additional rationale for combining conventional chemotherapy with metformin, which selectively inhibits CSCs.
Cancer stem cells (CSCs; also called tumor-initiating cells) are a highly tumorigenic cell type that exist as a minority population within tumors and have been hypothesized to be key drivers of cancer (1–6). CSCs have been isolated from developmentally diverse tumors and established cell lines via cell-surface markers (7–17), and they are defined by the following properties: self-renewal under nondifferentiation conditions, ability to differentiate into nonstem cancer cells (NSCCs), and high tumorigencity upon injection in immunodeficient mice. CSCs typically have the ability to grow as spheres (e.g., mammospheres for breast CSCs) and are often resistant to chemotherapeutic drugs. In addition, CSCs share many molecular similarities to embryonic and normal adult stem cells (18–22). However, the origin(s) of CSCs are poorly understood, and it is unclear whether CSCs are analogous to classic stem cells in normal development or whether they contribute to tumor heterogeneity during clonal evolution.
In some tumors, it has been suggested that CSCs arise as mutated versions of normal adult stem cells, whereupon they can induce tumor formation and differentiate into the various cell types within the tumor. Alternatively, CSCs might represent a specific stage along the multistep mutational process by which normal, differentiated cells become transformed. In this view, it is often thought that CSCs are precursors of differentiated cancer cells (NSCCs), but it is also possible that CSCs are derived from NSCCs or arise independently. In established cancer cell lines, the proportion of CSCs remains constant over multiple generations, but the basis of this phenomenon is unknown.
Here, we address these questions using an inducible model of oncogenesis that involves nontransformed mammary epithelial cells (MCF-10A) containing ligand-binding domain of estrogen receptor (ER-Src), a derivative of the Src kinase oncoprotein (v-Src) that is fused to the ligand-binding domain of the estrogen receptor (21, 23). Treatment of such cells with tamoxifen (TAM) rapidly induces Src, and transformation occurs within 24–36 h, thereby making it possible to kinetically follow the transition between normal and transformed cells. Transformation is initiated by a transient inflammatory signal that causes an epigenetic switch from stably nontransformed to stably transformed cells (21). This epigenetic switch is mediated by a positive feedback loop involving NF-κB, Lin28, Let-7 microRNA, and IL6 (21) as well as STAT3, miR-21, miR-181b-1, PTEN, and CYLD (24).
Results
Inducible Formation of CSCs Occurs During a Specific Time During Cellular Transformation.
Flow cytometric analysis of the transformed population (36 h after TAM addition) reveals that ~10% of cells express high levels of CD44 and low levels of CD24 antigen markers (CD44high/CD24low), which are typical of CSCs. In accord with the phenotypic definition of breast CSCs (3, 8), this CD44high/CD24low subpopulation is capable of forming self-renewing mammospheres (Fig. 1A), and it generates tumors at high frequency in mouse xenografts (Fig. 1B). In contrast, the remaining 90% of the transformed population express low levels of CD44 and high levels of CD24 (CD44low/CD24high), are unable to form mammospheres and are 100-fold less efficient at causing tumors in mouse xenografts. As observed in human breast cancers (25), the CSC population is more resistant to treatment with chemotherapeutic agents (doxorubicin, paclitaxel, 5-fluorouracil) than the non-CSC population (Fig. 1C). Thus, the transformed population consists of a minority population of CSCs and a majority population of nonstem cancer cells (NSCCs).
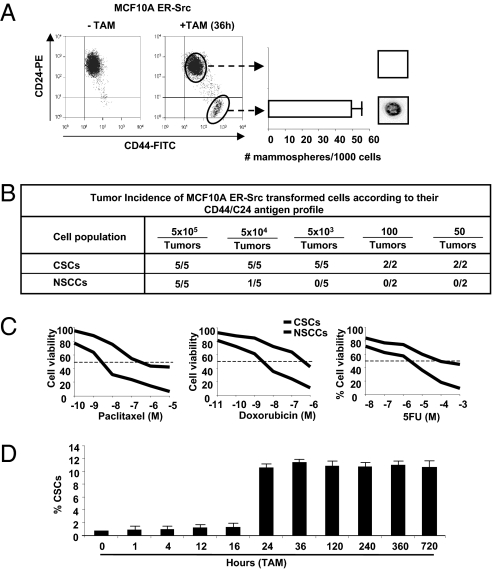
Breast CSCs are induced at a specific time during transformation. (A) CD44/CD24 profiles of ER-Src cells that were or were not treated with TAM for 36 h. Number of mammospheres per 1,000 cells (representative mammosphere shown) generated by sorted CSCs (CD44high/CD24low) and NSCCs (CD44low/CD24high). (B) Tumor incidence in mouse xenografts injected with the indicated number of CSCs or NSCCs isolated by sorting. (C) Percent viable CSCs and NSCCs after treatment with indicated concentrations of paclitaxel, doxorubicin, and 5-fluorouracil. (D) Proportion (percent) of CSCs at the indicated times after treatment of ER-Src cells with TAM.
The above results suggest that CSCs can be generated directly from nontransformed cells during the process of cellular transformation. To test this hypothesis and exclude the possibility that a small preexisting CSC population was selectively enriched during the 36-h TAM treatment, we performed a kinetic analysis of CSC formation. CSCs (defined as CD44high/CD24low cells) are not observed up to 16 h after the induction of cellular transformation, but they represent 10% of the population 24 h after induction (Fig. 1D). Once formed, CSCs represent 10% of the transformed population for at least 30 d of subsequent growth, which is in accord with the stable maintenance of CSCs in a variety of genetically distinct breast cancer cell lines (26). Thus, CSCs can be derived directly from nontransformed cells at a specific time during the process of cellular transformation, and the proportion of CSCs within the transformed population is stable over multiple generations.
CSCs and NSCCs Generated During the Transformation Process Have Distinct MicroRNA Profiles.
Although CSCs and NSCCs are formed from nontransformed cells concomitantly upon the induction of transformation, profiling of 365 microRNAs indicates that two cell populations have distinct expression patterns (Fig. 2A). Nineteen microRNAs are expressed at lower levels in CSCs than NSCCs, and three microRNAs are expressed at higher levels. As expected, the same set of microRNAs is also differentially expressed in mammospheres compared with the mixed transformed population (Fig. 2A). The miR-200 and let-7 families together with miR-145 and miR-146 are also differentially expressed in CSCs and NSCCs isolated from genetically distinct breast cancer cell lines and human breast tumors described here (Fig. 2B and Figs. S1 and S2) and elsewhere (20).
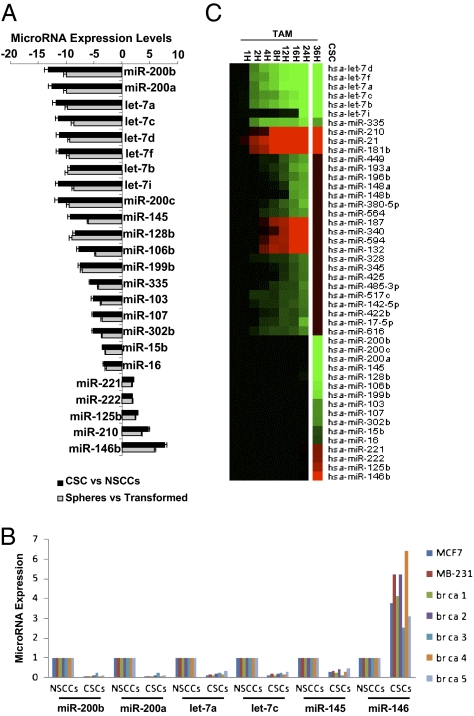
MicroRNAs differentially regulated in CSCs vs. NSCCs. (A) Relative expression levels (fold-effect) of microRNAs down-regulated (- numbers) or up-regulated (+ numbers) in isolated CSCs vs. NSCCs (black bars) or mammospheres vs. nonsorted transformed cells (gray bars). (B) Relative expression levels of the indicated microRNAs in NSCCs (defined as 1.0) and CSCs from MCF7, MDA-MB-231, and five human beast tumors. (C) Heat map representations of up-regulated (red) and down-regulated (green) microRNAs in CSCs (compared with NSCCs) or at different time points during ER-Src transformation (24), with the three different classes of microRNAs indicated.
Importantly, the set of 22 microRNAs differentially expressed in CSCs vs. NSCCs is quite different from the set of 29 microRNAs independently shown (24) to be differentially affected in the nontransformed vs. transformed population (Fig. 2C). Indeed, most microRNAs differentially expressed in CSCs vs. NSCCs have similar expression levels during the process of cellular transformation (i.e., at various time points after TAM addition). Conversely, most microRNAs differentially expressed during the process of cellular transformation are expressed at comparable levels in sorted CSCs and NSCCs. However, the let-7 family and miR-335 are down-regulated during transformation and further down-regulated in CSCs, whereas miR-210 is up-regulated in both situations. Thus, in some respects (let-7, miR-335, and miR-210), CSCs represent a more extreme version of transformed cells and, indeed, CSCs have a more robust inflammatory feedback loop (high NF-κB, high Lin28, low let-7, and high IL6) than NSCCs (21). More generally, however, CSCs and NSCCs represent two distinct cell types within a transformed population generated through a common induction step.
CSC Formation Depends on, but Is Not Required for, Transformation.
Cellular transformation and CSC formation are both induced upon addition of TAM to ER-Src cells, but it is unclear if one cell type is a precursor of the other or whether they arise independently. To address this issue, we took advantage of previous observations that miR-200, which is strongly down-regulated in CSCs, inhibits CSC growth and the epithelial-mesenchymal transition (27–31). Addition of miR-200b before TAM treatment essentially abolishes CSC formation, but it has no detectable effect on cellular transformation [assayed morphologically (22) or by colony formation in soft agar; Fig. 3A], indicating that CSC formation is not required for transformation. Conversely, addition of miR-200b antisense RNA to parental ER-Src cells does not result in transformation or formation of CSCs. The observation that CSC formation depends on, but is not required for, transformation, suggests that NSCCs are precursors of CSCs.
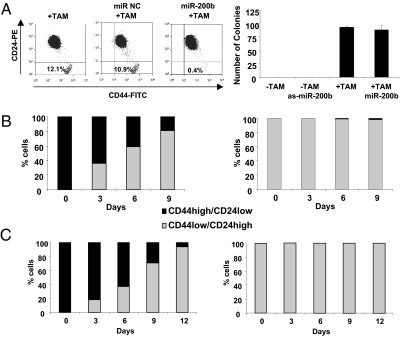
Relationship of CSC and NSCC formation and stability of the isolated cell types. (A) Transformation assays (morphology or colony formation in soft agar) of ER-Src cells that were or were not treated with TAM in the presence or absence of miR-200b or anti-sense miR-200b. (B) Number of CSCs (black) or NSCCs (gray) after growth of isolated CSCs (Left) or isolated NSCCs (Right) from ER-Src transformed cells for the indicated number of days. (C) Same as B except that sorted CSCs and NSCCs were derived from a breast tumor.
CSCs Rapidly Differentiate into NSCCs, but NSCCs Are Not Easily Converted to CSCs.
There are two basic models by which the proportion of CSCs within a transformed cell population remains constant over multiple generations. In one model, CSCs and NSCCs represent distinct epigenetically stable cell types that copropagate independently. Alternatively, the two cell types can switch from one type to the other in a dynamic equilibrium that maintains the proportion of CSCs. To distinguish between these possibilities, we sorted a transformed population of ER-Src cells (36 h after TAM addition) into CSCs and NSCCs and examined the distribution of cell types after multiple generations of growth. Sorted CSCs rapidly differentiate into NSCCs, such that after 9 d, the population was ~15% CSCs and 85% NSCCs (Fig. 3B). Over more extended times, the CSC population is maintained at the 10% level typical of the transformed cell line. In contrast, the sorted NSCCs generate very few CSCs over the same period (Fig. 3B). Similar results were obtained with CSCs and NSCCs derived directly from a breast tumor (Fig. 3C). Thus, although NSCCs and CSCs can form concomitantly during the process of cellular transformation, the conversion of NSCCs to CSCs is very inefficient. The failure of the sorted CSCs to be stably propagated under these conditions indicates that CSCs do not represent a stable epigenetic state.
Conversion of NSCCs to CSCs Within Tumors in Mouse Xenografts.
The nonreciprocal conversion between sorted NSCCs and CSCs should result in ever-decreasing numbers of CSCs and, hence, is paradoxical in light of the constant proportion of CSCs within the transformed population. This apparent paradox suggests that CSCs and NSCCs interact with each other in a mixed population in a manner that does not occur when the cell types are propagated separately. As a first test of this hypothesis, we performed a mixed xenograft experiment (Fig. 4A) involving coinjection of NSCCs from an ER-negative, PKCα-positive cell line (MDA-MB-231) and CSCs from ER-Src cells (ER-positive, PKCα-negative). In comparison with tumors generated by ER-Src CSCs alone, the CSC population in the tumor derived by coinjection had 5- to 10-fold fewer ER-positive cells (assayed by ER DNA and RNA levels) and 10-fold higher PKCα-positive cells (assayed by RNA levels) (Fig. 4B), indicating that most of the CSCs in the tumor were derived from the ER-negative NSCCs. Because injection of the same number of ER-negative NSCCs is insufficient to generate tumors (Fig. S1), this experiment suggests that ER-negative NSCCs can be converted to CSCs in the presence of the ER-positive CSCs during tumor formation.

Conversion of NSCCs to CSCs in tumors in mouse xenografts. (A) Scheme of mixed xenograft experiment. The 104 ER-Src CSCs were combined (or not) with 104 NSCCs from MDA-MB-231, injected into nude mice. CSCs were obtained by sorting cells from excised tumors 15 d after injection, and the resulting material examined for ER and PKCα RNA levels or ER copy number (B).
IL6 Can Convert NSCCs to CSCs in Breast and Prostate Cell Lines as Well as from Cells Derived from Human Breast Tumors.
As more direct experimental support, medium from the culture of ER-Src transformed cells results in the conversion of isolated NSCCs to CSCs, with the proportion of CSCs approaching that occurring in the nonsorted population of transformed cells (Fig. 5A). Breast CSCs have an enhanced inflammatory feedback loop compared with NSCCs (21), suggesting that the key component(s) of the medium might be a secreted inflammatory molecule. In this regard, when an antibody against IL6 is added to the medium, the conversion of NSCCs to CSCs is largely blocked, suggesting that secreted IL6 is important for generating CSCs from NSCCs. Indeed, the addition of IL6 to NSCCs results in a rapid generation of a CSC subpopulation at a proportion typical of the transformed ER-Src cells, and similar results occur when isolated NSCCs are treated with TAM. The IL6-mediated conversion of NSCCs to CSCs is also observed in a genetically different breast cancer cell line (MB-231) and in NSCCs obtained directly from five human breast tumors (Fig. 5A). Importantly, the IL6-treated NSCCs from ER-Src, MB-231, and the five breast tumors are truly CSCs, as defined by their cell surface markers (Fig. 5A), mRNA and microRNA profiles (Fig. 5B), and the ability to form mammospheres (Fig. 5C). Furthermore, s.c. injection of 50 IL6-derived CSCs from both cancer cell lines and both breast tumors tested causes tumors in nude mice (Fig. S3). Lastly, IL6 is highly expressed in prostate CSCs (CD44+/CD133+) relative to NSCCs (CD44−/CD133−) (Fig. S4), and IL6 treatment converts prostate NSCCs to sphere-forming CSCs in a dose-dependent manner (Fig. 5 D and E).
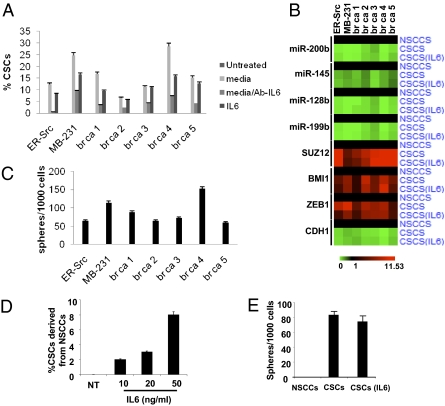
Dynamic equilibrium between CSCs and NSCCs mediated by IL6 secretion. (A) Number of CSCs formed from NSCCs from the indicated cell lines and five human breast tumors (br ca) that were treated with medium from ER–Src-transformed cells in the presence or absence of antibody against IL6 or with IL6. (B) mRNA and microRNA profiles of CSC expression markers in NSCCs, CSCs, and IL6-treated NSCCs from the indicated cell lines and human breast tumors. (C) Number of mammospheres formed from untreated and IL6-treated NSCCs from the indicated cell lines and human breast tumors. (D) Number of prostate CSCs (CD44+/CD133+) formed from NSCCs (CD44−/CD133−) obtained by sorting PC3 prostate cancer cells upon treatment with the indicated concentration of IL6. (E) Number of prostate spheres formed from PC3 NSCCs, CSCs, and IL6-treated NSCCs.
Discussion
Dynamic Equilibrium Between CSCs and NSCCs via IL6 Secretion.
Our results demonstrate that CSCs and NSCCs in transformed cell lines and in cells from breast tumors are in dynamic equilibrium such that the proportion of these two cell types within the transformed population remains constant over many generations (Fig. 6). Under standard growth conditions, CSCs differentiate into NSCCs, but they also secrete IL6 (and perhaps other molecules) that converts some NSCCs into CSCs. In this regard, the positive feedback loop involving NF-κB, Lin28, Let-7, and IL6 that links inflammation to cancer is more robust in CSCs than in NSCCs, such that CSCs express and secrete higher levels of IL6 than NSCCs (21).
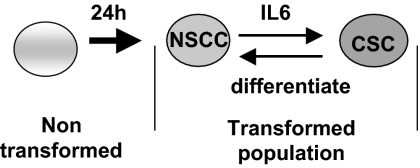
Model for formation of NSCCs and CSCs and the dynamic equilibrium between these cell types mediated by IL6. Transformation and generation of NSCCs is required for CSC formation. CSCs rapidly differentiate back into NSCCs, but they also secrete IL6 to allow conversion of NSCCs to CSCs, thereby maintaining the dynamic equilibrium.
To maintain a stable equilibrium, the rate of CSC differentiation is balanced by the rate of CSC formation, the latter of which depends on the proportion of CSCs in the population, the amount of IL6 secreted by CSCs, the level of IL6 receptor, and the overall response of NSCCs to the concentration of IL6. The set point for this equilibrium can differ among cell lines, thereby explaining why the proportion of CSCs varies among transformed cell lines even though it remains constant in a given cell line. Thus, although CSCs and NSCCs have different microRNA and mRNA profiles, conversion from one cell type to the other occurs fairly rapidly in both directions. The molecular mechanisms for how these different transcriptional profiles are generated from nontransformed cells or from the other transformed cell type remain to be elucidated. In any event, it is remarkable that CSCs and NSCCs exist in a dynamic equilibrium, as opposed to one cell type taking over the population, and it seems highly likely that the balanced interconversion between these distinct cell types is biologically important. More generally, the IL6-mediated conversion of NSCCs to CSCs suggests that, despite their name and phenotypic similarities, breast (and likely prostate) CSCs behave differently than classic stem cells.
Implications for Breast Cancer, the Cancer Stem Cell Hypothesis, and Combinatorial Chemotherapy Involving Metformin.
The dynamic equilibrium between breast CSCs and NSCCs observed in transformed cells lines and breast tumors is likely to be relevant for heterogeneous breast cancers that contain a small number of CSCs within a large population of nontumorigenic cancer cells. We suggest that CSCs derive from NSCCs that arise from multiple mutations in oncogenes and tumor suppressors, and this conversion is required for tumor formation. Once formed, CSCs self-renew, continuously generate NSCCs via differentiation, and convert some NSCCs back into CSCs by secreting extracellular signals such as IL6 within the confines of the tumor. A similar equilibrium is observed in a prostate cell line, and it may also occur in other cancer types in which CSCs are found (7–17). As inflammation is associated with many cancer types (23, 32, 33), the IL6-based mechanism may be involved in nonbreast cancers, although analogous mechanisms using other secreted molecules could perform the same function.
The cancer stem cell hypothesis suggests that standard chemotherapeutic treatment can effectively kill NSCCs, thereby dramatically reducing tumor size, but CSCs largely survive this treatment (1, 2). As a consequence, after chemotherapy is ended, the CSCs reinitiate tumor formation and differentiate into NSCCs that make up the bulk of the tumor. In mouse xenografts, such relapse is prevented by the combination of conventional chemotherapy and metformin, which selectively kills cancer stem cells (26). In addition, such combinatorial therapy reduces tumor growth more rapidly than chemotherapy alone (26), and we suggest that metformin not only selectively kills existing CSCs, but that it indirectly lowers the CSC burden by inhibiting the conversion of NSCCs to CSCs. More generally, the dynamic equilibrium between CSCs and NSCCs provides an additional rationale for combining conventional chemotherapy and metformin for treatment of breast (and potentially other) cancers.
Materials and Methods
Cell Culture.
The nontransformed breast cell line MCF-10A (34) contains an integrated fusion of the v-Src oncoprotein with ER-Src (35). These cells were grown in DMEM/F12 medium supplemented with 5% donor horse serum, 20 ng/mL epidermal growth factor (EGF), 10 μg/mL insulin, 100 μg/mL hydrocortisone, 1 ng/mL cholera toxin, 50 units/mL pen/step, with the addition of puromycin. Src induction and cellular transformation was achieved by treatment of 1 μM 4-OH TAM, typically for 36 h as described (21, 23, 26). MDA-MB-231 and MCF7 breast cancer cells were grown in DMEM, 10% FBS, and pen/step.
Sorting of CSCs and NSCCs Subpopulations from Cancer Cells.
For ER-Src–transformed cells, MCF7 and MDA-MB-231 cancer cells, to separate CSCss from NSCCs, flow cytometric cell sorting was performed on single-cell suspensions that were stained with CD44 antibody (FITC-conjugated) (555478; BD Biosciences) and with CD24 antibody (PE-conjugated) (555428; BD Biosciences) for 30 min (21, 22, 26). As used throughout this work, CSCs are defined by the minority CD44high/CD24low population, whereas NSCCs are defined by the majority CD44low/CD24high.
To separate CSCs from NSCCs for PC3 prostate cells, flow cytometric cell sorting was performed on single-cell suspensions that were stained with CD44 antibody (FITC-conjugated) (555478; BD Biosciences) and CD133 antibody (PE-conjugated) (239C3; Miltenyi Biotech Ltd.) for 20 min. Prostate CSCs were defined by the minority CD133high/CD44high population, whereas NSCCs are defined by the majority CD133low/CD44low population.
Purification and Experiments Using CSCs and NSCCs from Human Breast Tissues.
Five human invasive ductal carcinoma tissues (stage III) were purchased from AMS Biotechnology and Biochain Inc. All these tissues were negative for ER, PR, and HER2 expression (triple negative). Immunomagnetic purification of CSCs and NSCCs was performed according to Shipitsin et al. (36). Briefly, the breast tissues were minced into small pieces (1 mm) by using a sterile razor blade. The tissues were digested with 2 mg/mL collagenase I (C0130; Sigma) and 2 mg/mL hyalurinidase (H3506; Sigma) in 37 °C for 3 h. Cells were filtered, washed with PBS, and followed by Percoll gradient centrifugation. The first purification step was to remove the immune cells by immunomagnetic purification by using an equal mix of CD45 (leukocytes), CD15 (granulocytes), CD14 (monocytes), and CD19 (B cells) Dynabeads (Invitrogen). The second purification step was to isolate fibroblasts from the cell population by using CD10 beads for magnetic purification. The third step was to isolate the endothelial cells by using an “endothelial cocktail” beads (CD31, BD Pharmingen cat no. 555444; CD146 P1H12 MCAM, BD Pharmingen cat no. 550314; CD105, Abcam cat no. Ab2529; Cadherin 5, Immunotech cat no. 1597; and CD34, BD Pharmingen cat no. 555820). In the final step, from remaining cell population, only the CD44high cells were purified by using CD44 beads. These cells were sorted for CD44high/CD24low (CSC) cells. On the other hand, CD24high cells were purified by using CD24 beads. These cells were sorted for CD44low/CD24high (NSCCs) cells. These CSC and NSCC populations were sorted again to increase their purity (>99.2% in all cases).
Mammosphere Formation Assay.
Mammospheres were generated by placing transformed cell lines in suspension (1,000 cells per mL) in serum-free DMEM/F12 media, supplemented with B27 (1:50, Invitrogen), 0.4% BSA, 20 ng/mL EGF, and 4 μg/mL insulin. After 6 d of incubation, mammospheres were typically >75 mM in size with ~97% being CD44high/CD24low. For serial passaging, 6-d-old mammospheres were harvested by using a 70-μm cell strainer, whereupon they were dissociated to single cells with trypsin (37), and then regrown in suspension for 6 d.
Chemotherapy Treatment of CSCs and NSCCs.
CSCs and NSCCs were sorted from ER-Src transformed (36 h tam-treated) cells, seeded in monolayer culture, and treated with different doses of paclitaxel, doxorubicin, and 5-fluorouracil for 24 h and cell viability was assessed by the CCK8 assay (Dojindo).
MicroRNA Transfection Experiments.
ER-Src MCF10A cells were transfected with 100 nM microRNA negative control (miR NC) or miR-200b by using siPORT NeoFX transfection agent. In these cells, 24 h later, tamoxifen was added for 36 h. After that, the cells were sorted for CD44 and CD24 antigens. In addition, untransformed or transformed (36 tam-treated) ER-Src cells were treated with 100 nM miR-200b or as-miR-200b for 48 h, and then the cells were plated in soft agar. The number of colonies was counted 15 d later.
Conditions for Differentiation of CSCs.
For differentiation experiments, CSCs sorted from ER-Src MCF10A transformed (+TAM for 36 h) cells were plated at 1 × 10⁵ cells per mL on six-well plates precoated with Collagen IV (BD BioSciences) in DMEM/F12 supplemented with 5% serum without growth factors and passaged when they reached >95% confluence. CSC differentiation was monitored every 6 d and tested by flow cytometry analysis.
MicroRNA Analysis.
RNA extracted from untreated (0 h) or tamoxifen-treated (1, 2, 4, 8, 12, 16, 24, 36 h) ER-Src cells together with RNA extracted from CSCs derived from tamoxifen-treated (36 h) ER-Src cells were used for testing the expression levels of 365 microRNAs (microRNA TLDA v1.0 card; Applied Biosystems) in the Dana–Farber Molecular Diagnostics Facility. In addition, microRNA expression levels were tested by using the mirVana qRT–PCR miRNA Detection Kit and qRT–PCR Primer Sets, according to the manufacturer's instructions (Ambion). RNU48 expression was used as an internal control. Specifically, microRNA expression levels by quanitative RT-PCR (qRT-PCR) were tested in: (i) 6-d mammospheres derived from ER-Src transformed (36 h tam-treated) cells; (ii) sorted CSCs and NSCCs from MCF7 and MDA-MB-231 breast cancer cells; and (iii) CSCs and NSCCs isolated by immunomagnetic purification followed by cell sorting.
Xenograft Experiments.
Nude mice experiments were performed in accordance with Institutional Animal Care and Use Committee procedures and guidelines of Tufts University. In initial experiments 5 × 10⁵, 5 × 10⁴, 5 × 10³, 100, 50 CSCs, and NSCCs sorted from ER-Src transformed (36 tam-treated) cells were injected s.c. in the right flank of athymic nude mice (Charles River Laboratories). The presence or absence of a visible or palpable tumor was evaluated 60 d after the initial injection of these cells. In addition, the mixed xenograft experiment was performed by coinjecting 104 CSCs sorted from ER-Src transformed cells (PKCα-negative) in the presence of absence of 104 NSCCs sorted from MDA-MB-231 cells (ER-negative, PKCα-positive). ER and PKCα were used as markers of these genetically distinct populations.
Acknowledgments
We thank Marianne Lindahl-Allen for help with the kinetic analysis of CSC formation and for useful comments on the work, and Philip N. Tsichlis for providing facilities for performing the xenograft experiments. This work was supported by a postdoctoral fellowship from the American Cancer Society (to H.A.H.) and National Institutes of Health research Grant CA 107486 (to K.S.).
Footnotes
The authors declare no conflict of interest.
This article contains supporting information online at www.pnas.org/lookup/suppl/10.1073/pnas.1018898108/-/DCSupplemental.
References
Articles from Proceedings of the National Academy of Sciences of the United States of America are provided here courtesy of National Academy of Sciences
Full text links
Read article at publisher's site: https://doi.org/10.1073/pnas.1018898108
Read article for free, from open access legal sources, via Unpaywall:
https://www.pnas.org/content/pnas/108/4/1397.full.pdf
Free after 6 months at www.pnas.org
http://www.pnas.org/cgi/content/abstract/108/4/1397
Free after 6 months at www.pnas.org
http://www.pnas.org/cgi/reprint/108/4/1397.pdf
Free after 6 months at www.pnas.org
http://www.pnas.org/cgi/content/full/108/4/1397
Citations & impact
Impact metrics
Citations of article over time
Alternative metrics
Article citations
Lactylation in cancer: Mechanisms in tumour biology and therapeutic potentials.
Clin Transl Med, 14(11):e70070, 01 Nov 2024
Cited by: 0 articles | PMID: 39456119 | PMCID: PMC11511673
Review Free full text in Europe PMC
Tumor Microenvironment Landscapes Supporting EGFR-mutant NSCLC Are Modulated at the Single-cell Interaction Level by Unesbulin Treatment.
Cancer Res Commun, 4(3):919-937, 01 Mar 2024
Cited by: 1 article | PMID: 38546390 | PMCID: PMC10964845
Advances in the study of autophagy in breast cancer.
Breast Cancer, 31(2):195-204, 05 Feb 2024
Cited by: 1 article | PMID: 38315272 | PMCID: PMC10901946
Review Free full text in Europe PMC
Generation of Cancer Stem Cells by Co-Culture Methods.
Methods Mol Biol, 2777:219-230, 01 Jan 2024
Cited by: 0 articles | PMID: 38478347
The endocrine disruptor cadmium modulates the androgen-estrogen receptors ratio and induces inflammatory cytokines in luminal (A) cell models of breast cancer.
Endocrine, 83(3):798-809, 18 Nov 2023
Cited by: 0 articles | PMID: 37979099 | PMCID: PMC10902028
Go to all (414) article citations
Data
Data behind the article
This data has been text mined from the article, or deposited into data resources.
BioStudies: supplemental material and supporting data
Similar Articles
To arrive at the top five similar articles we use a word-weighted algorithm to compare words from the Title and Abstract of each citation.
Arsenic exposure transforms human epithelial stem/progenitor cells into a cancer stem-like phenotype.
Environ Health Perspect, 118(1):108-115, 01 Jan 2010
Cited by: 96 articles | PMID: 20056578 | PMCID: PMC2831952
Role of the IL-6-JAK1-STAT3-Oct-4 pathway in the conversion of non-stem cancer cells into cancer stem-like cells.
Cell Signal, 25(4):961-969, 16 Jan 2013
Cited by: 174 articles | PMID: 23333246 | PMCID: PMC3595341
By promoting cell differentiation, miR-100 sensitizes basal-like breast cancer stem cells to hormonal therapy.
Oncotarget, 6(4):2315-2330, 01 Feb 2015
Cited by: 30 articles | PMID: 25537513 | PMCID: PMC4385854
Breast cancer stem cells and intrinsic subtypes: controversies rage on.
Curr Stem Cell Res Ther, 4(1):50-60, 01 Jan 2009
Cited by: 73 articles | PMID: 19149630
Review
Funding
Funders who supported this work.
NCI NIH HHS (2)
Grant ID: CA 107486
Grant ID: R01 CA107486


