| PMC full text: | Published online 2011 Apr 23. doi: 10.1093/carcin/bgr075
|
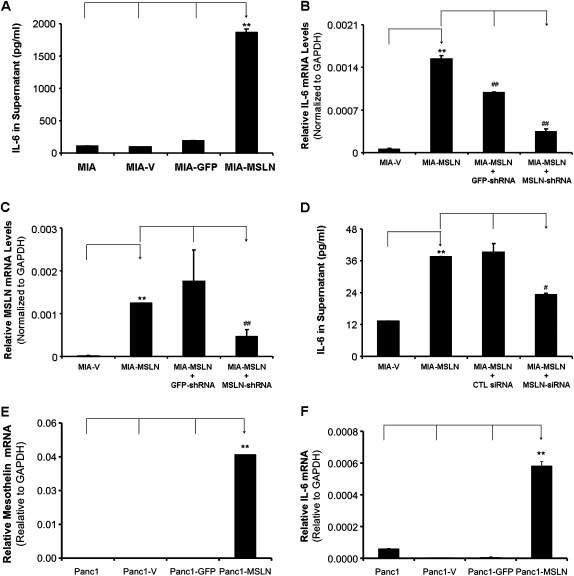
Fig. 2.

MSLN overexpression leads to increased IL-6 production in PC cells. (A). MIA, MIA-V, MIA-GFP and MIA-MSLN cells were seeded at 1 × 10⁶ cells per well in six-well plates and cultured until 60% confluence. Thereafter, the medium was replaced and the supernatants were harvested at 48 h of further incubation and the levels of IL-6 were determined by using the Luminex-based IL-6 assay kit. Y-axis represents IL-6 concentration in pg/ml. (B) Silencing MSLN using MSLN-specific shRNA plasmid. MIA-V and MIA-MSLN cells were transfected with MSLN-specific shRNA plasmids or GFP shRNA control plasmids. The cells collected 48 h posttransfection were used to detect MSLN mRNA by real-time polymerase chain reaction. The MSLN-expressing levels were detected by using real-time polymerase chain reaction. Y-axis represents MSLN mRNA level normalized to the GAPDH mRNA level. Relative mRNA level is presented as 2 [Ct(GAPDH)−Ct(IL-6)]. The bars denote SD of duplicate data. Experiment was performed several times using separate MIA-MSLN pools and different siRNA/shRNAs against MSLN with similar results. (C) Silencing MSLN decreases IL-6 mRNA production in MIA-MSLN cells. MIA-V and MIA-MSLN cells were transfected with MSLN-specific shRNA plasmids or GFP shRNA control plasmids. The cells collected 48 h posttransfection were used to detect IL-6 mRNA by real-time polymerase chain reaction. Y-axis represents IL-6 mRNA level relative to GAPDH. The bars denote SD of duplicate data. Experiment was performed several times using separate MIA-MSLN pools and different siRNA/shRNAs against MSLN with similar results. (D) Silencing MSLN decreases IL-6 secretion in MIA-MSLN cells. MIA-V and MIA-MSLN cells were transfected with MSLN-specific siRNA or scrambled siRNA. The cells collected 48 h posttransfection from 24-well plates in 2 ml of medium were used to detect IL-6 by Luminex-based IL-6 assay kit. Values on Y-axis show the amount of IL-6 in pg/ml, bars denoting SD of duplicate data. (E) Stable overexpression of MSLN in human PC cell Panc1. The GAPDH-normalized MSLN expression levels in the stably MSLN expressing (Panc1-MSLN) and control MIA cells generated by retroviral gene transfer and subsequent puromycin selection are shown. (F) Panc1, Panc1-V, Panc1-GFP and Panc1-MSLN cells were seeded at 1 × 10⁶ cells per well in six-well plates and cultured until 80% confluence, cells collected were used to detect IL-6 mRNA by real-time polymerase chain reaction. Y-axis represents IL-6 mRNA level relative to GAPDH. The bars denote SD of duplicate data. *, # denote P < 0.05, and **, ## denote P < 0.01, compared with controls, t-test. * and # denote comparison to different base lines and hence are denoted differently.


