Abstract
Free full text

An evaluation of the performance of cDNA microarrays for detecting changes in global mRNA expression
Abstract
The cDNA microarray is one technological approach that has the potential to accurately measure changes in global mRNA expression levels. We report an assessment of an optimized cDNA microarray platform to generate accurate, precise and reliable data consistent with the objective of using microarrays as an acquisition platform to populate gene expression databases. The study design consisted of two independent evaluations with 70 arrays from two different manufactured lots and used three human tissue sources as samples: placenta, brain and heart. Overall signal response was linear over three orders of magnitude and the sensitivity for any element was estimated to be 2 pg mRNA. The calculated coefficient of variation for differential expression for all non-differentiated elements was 12–14% across the entire signal range and did not vary with array batch or tissue source. The minimum detectable fold change for differential expression was 1.4. Accuracy, in terms of bias (observed minus expected differential expression ratio), was less than 1 part in 10 000 for all non-differentiated elements. The results presented in this report demonstrate the reproducible performance of the cDNA microarray technology platform and the methods provide a useful framework for evaluating other technologies that monitor changes in global mRNA expression.
INTRODUCTION
The construction of gene expression databases is a high priority of today’s research community. Such databases, closely integrated with other types of genomic information, promise not only to facilitate our understanding of many fundamental biological processes, but also to accelerate drug discovery and lead to customized diagnosis and treatment of disease (1–6).
These databases will require the development of one or more underlying supporting technologies that can accurately and reproducibly measure changes in global mRNA expression levels. The ideal technology should be able to process large numbers of samples, require minimal amounts of biological source material and be applicable across a wide range of cell or tissue types. Several different technologies are currently being investigated for their ability to meet these stringent requirements (7–12). While many of these technologies show significant promise in preliminary studies, it is critically important that each technology be comprehensively evaluated as a complete system for producing accurate, precise and reliable expression data (13,14).
The Incyte cDNA microarray technology platform simultaneously analyzes the relative expression levels of up to 10 000 genes, each of which is present as a unique cDNA element (7). The platform is potentially scalable to include all of the elements in the human genome. PCR-derived elements averaging 1000 nt in length are physically arrayed in a two-dimensional grid on a chemically modified glass slide. Aliquots from two purified mRNA samples are separately reverse transcribed using primer sets labeled with two different fluorophores and the resulting dye-labeled cDNA populations are used to probe the target elements in a competitive hybridization reaction. After hybridization the glass slide is analyzed in a two-channel fluorescence scanner and the ratio between the two fluorophores detected for any given element defines the relative amount of the mRNA corresponding to that element present in the original two samples.
There are many process variables that will impact on the quality of the data generated by any microarray technology platform. In this report we describe parameters for the manufacture of effective cDNA microarrays with highly reproducible performance characteristics, the quality and quantity of sample mRNAs used to create the dye-labeled cDNA probe and the effects of these optimized procedures on the overall performance, accuracy, precision and reliability of expression data generated from the two-channel ratiometric approach.
MATERIALS AND METHODS
Synthesis of PCR products
PCR was used to generate large quantities of defined target DNA for microarray production. Plasmids containing cloned genes were grown in Escherichia coli and were amplified using vector primers SK536 (5′-GCGAAAGGGGGATGTGCTG-3′) and SK865 (5′-GCTCGTATGTTGTGTGGAA-3′) (Operon Technologies, Alameda, CA). Briefly, 1 µl of bacterial cell culture was added to 75 µl of reaction buffer, containing 10 mM Tris–HCl pH 8.3, 1.5 mM MgCl2, 50 mM KCl, 0.2 mM each dNTP, 0.5 µM each primer and 2 U Taq polymerase. The mixture was incubated for 3 min at 95°C and 30 cycles of PCR were performed at 94°C for 30 s, 56°C for 30 s and 72°C for 90 s. A final incubation for 5 min at 72°C was followed by reduction of the temperature to 4°C in order to terminate the reaction. PCR products were then purified by centrifugal chromatography with Sephadex S400 resin (Amersham-Pharmacia Biotech, Uppsala, Sweden) in a 96-well format. Briefly, 400 µl of S400 resin pre-equilibrated in 0.2× standard saline citrate buffer (SSC) was added to each well of a 96-well microtiter plate. A unique PCR product prepared as described above was loaded into each well and the plate was centrifuged in an Eppendorf 5810 centrifuge at 885 r.c.f. (relative centrifugal force). Purified PCR products were concentrated to dryness and resuspended in 10 µl of H2O. DNA was resolubilized by thermal cycling (five cycles of 85°C for 30 s and 20°C for 30 s).
Qualification and quantification of PCR products
PCR products were routinely analyzed for quality by agarose gel electrophoresis and samples that failed to amplify or had multiple bands were annotated in the GEMTools database management software (Incyte Genomics, Fremont, CA). PCR products were quantified using PicoGreen dye (Molecular Probes, Eugene, OR) in a fluorescent assay specific for measuring double-stranded DNA concentration according to the manufacturer’s instructions.
Arraying and post-processing
Ten thousand PCR products were arrayed by high speed robotics (7) on amino-modified glass slides (M.Reynolds, unpublished results). Each element occupied a spot of ~150 µm in diameter and spot centers were 170 µm apart. DNA adhesion to the glass was achieved by irradiation in a Stratalinker Model 2400 UV illuminator (Stratagene, San Diego, CA) with light at 254 nm and an energy output of 120 000 µJ/cm2. To minimize any potential non-specific probe interactions with the glass the microarrays were washed for 2 min in 0.2% SDS (Life Technologies, Rockville, MD), followed by three rinses in H2O for 1 min each. The microarrays were treated with 0.2% (w/v) I-block (Tropix, Bedford, MA) in phosphate-buffered saline (PBS) for 30 min at 60°C. They were washed again for 2 min in 0.2% SDS, rinsed three times in H2O for 1 min each and finally dried by a brief centrifugation. Dried microarrays were routinely stored in opaque plastic slide boxes at room temperature.
Array qualification: SYTO 61 dye
As SYTO 61 nucleic acid staining has generally been applied to cells, the standard procedure was modified to allow its use for measurement of DNA bound to microarrays. A 5 µM stock solution of SYTO 61 dye (Molecular Probes) in DMSO was diluted 1:100 in 10 mM Tris–HCl pH 7, 0.1 mM EDTA (TE). Several microarrays from each manufactured batch were immersed in this solution for 5 min at room temperature, rinsed with TE, rinsed with H2O and finally with absolute ethanol. After drying the microarrays were scanned on a GenePix 4000A scanner (Axon Instruments, Foster City, CA) at 535 nm.
mRNA preparation and probe synthesis
Briefly, mRNA was isolated by a single round of poly(A) selection using Oligotex resin (Qiagen, Valencia, CA) from commercially available human placenta, brain and heart total RNA (Biochain, San Leandro, CA). The purified mRNA was quantified using RiboGreen dye (Molecular Probes) in a fluorescent assay. RiboGreen dye was diluted 1:200 (v/v final) and mixed with known RNA concentrations (determined by absorbance at 260 nm) ranging from 1 to 5000 ng/ml. A Millennium RNA size ladder (Ambion, Austin, TX) was used to generate standard curves and unknown samples were diluted as necessary. Fluorescence was measured in 96-well plates with a FLUOstar fluorometer (BMG Lab Technologies, Germany) fitted with 485 nm (excitation) and 520 nm (emission) filters.
Between 25 and 100 ng mRNA were separated on an Agilent 2100 Bioanalyzer, a high resolution electrophoresis system (Agilent Technologies, Palo Alto, CA), to examine the mRNA size distribution. 200 ng of purified mRNA were converted to either a Cy3- or Cy5-labeled cDNA probe using a custom labeling kit (Incyte Genomics). Each reaction contained 50 mM Tris–HCl pH 8.3, 75 mM KCl, 15 mM MgCl2, 4 mM DTT, 2 mM dNTPs (0.5 mM each), 2 µg Cy3 or Cy5 random 9mer (Trilink, San Diego, CA), 20 U RNase inhibitor (Ambion), 200 U MMLV RNase H-free reverse transcriptase (Promega, Madison, WI) and mRNA. Correspondingly labeled Cy3 and Cy5 cDNA products were combined and purified on a size exclusion column, concentrated by ethanol precipitation and resuspended in hybridization buffer.
Array qualification: complex and vector-specific hybridizations
Hybridization of labeled cDNA probes was performed in 20 µl of 5× SSC, 0.1% SDS, 1 mM DTT at 60°C for 6 h. Hybridization with a Cy3-labeled vector-specific oligonucleotide (5′-TTCGAGCTTGGCGTAATCATGGTCATAGCTGTTTCCTGTGTGAAATTGTTATCCGCTCA-3′) (Operon Technologies) was performed at 10 ng/µl in 5× SSC, 0.1% SDS, 1 mM DTT at 60°C for 1 h. The microarrays were washed after hybridization in 1× SSC, 0.1% SDS, 1 mM DTT at 45°C for 10 min and then in 0.1× SSC, 0.2% SDS, 1 mM DTT at room temperature for 3 min. After drying by centrifugation, microarrays were scanned with an Axon GenePix 4000A fluorescence reader and GenePix image acquisition software (Axon) at 535 nm for Cy3 and 625 nm for Cy5. An image analysis algorithm in GEMTools software (Incyte Genomics) was used to quantify signal and background intensity for each target element. The ratio of the two corrected signal intensities was calculated and used as the differential expression ratio (DE) for this specific gene in the two mRNA samples.
The Axon scanner was calibrated using a primary standard and a secondary standard to account for the differences in scanner performance [laser and photomultiplier tube (PMT)] between the Cy3 and Cy5 channels. For the primary standard hundreds of probe samples were prepared that were fluorescently balanced in the Cy3 and Cy5 channels as determined by a Fluorolog3 fluorescence spectrophotometer (Instruments SA, Edison, NJ). These probes were hybridized to microarrays and the scanner PMTs were adjusted to give balanced fluorescence and the greatest dynamic range. Using these PMT values a fluorescent plastic slide was scanned to obtain corresponding fluorescent values. This secondary standard was used to calibrate scanners on a daily basis.
Data acquisition and analysis
Two low frequency data correction algorithms were applied to compensate for systematic variations in data quality. The first procedure, a gradient correction algorithm, modeled the signal response surfaces of each channel. On a 10 000 element microarray the signal responses of Cy3 and Cy5 should be random due to the random physical location of the target elements. The signal response surfaces were first examined for non-random patterns. If non-random patterns were detected, a second order response model was applied to model the gene signal responses according to their positions on the surface. The non-randomness was then corrected using the fitted model. The second procedure, a signal correction algorithm, corrected for differential rates of incorporation of the Cy3 and Cy5 dyes. In an idealized homotypic hybridization, a scatter plot of log Cy3 signal versus log Cy5 signal should show a signal distribution along a line with a slope of 1. If the center line of the signals does not have a slope of 1 there may be different rates of incorporation of the Cy3 and Cy5 dyes. The signal correction algorithm tested whether the slope of the regression line for log Cy3 signal versus log Cy5 signal was 1 and applied a regression model to rotate the regression line to a slope of 1 if necessary.
RESULTS AND DISCUSSION
Impact of arrayed DNA concentration on DEs
Because of the competitive nature of two channel fluorescent hybridizations it has been assumed that the amount of target DNA deposited on the glass slide would have little or no impact on any observed DEs (15). We tested this assumption directly by hybridizing a series of samples at predetermined input ratios to microarrays containing varying amounts of target DNA. For these experiments the target DNAs were yeast fragments, a set of PCR products derived from the non-coding regions of Saccharomyces cerevisiae. The amount of PCR product was quantified using a fluorescent dye (PicoGreen) specific for double-stranded DNA. The targets were spotted in three sets containing quadruplicate points from a 2-fold dilution series of DNA concentrations ranging from 2.0 to 0.062 µg/well (10 µl/well).
Probes for hybridization to the yeast fragments were made from T7 RNA transcripts of PCR products. Templates for in vitro transcription were made by incorporating a T7 promoter in the upstream PCR primer and poly(A) sequences in the downstream PCR primer. In vitro transcripts of the yeast fragments were purified, quantified and included in every labeling reaction at predetermined Cy3:Cy5 input levels (fragment 22, 123:4 pg; fragment 6, 123:123 pg; fragment 25, 4:123 pg). All probe labeling reactions were done in the presence of 200 ng poly(A) mRNA, from either human brain or heart (Biochain, Hayward, CA). Hybridization of these probes was performed on three different days, across 20 microarrays representing two different batches and by multiple operators. A comparison of the expected differential expression and the experimentally observed differential expression is shown in Figure Figure1. 1. These results indicate that target DNA arrayed at input concentrations <1.0 µg/10 µl results in an underestimate or compression of the observed differential expression, with more compression occurring at lower DNA concentrations.
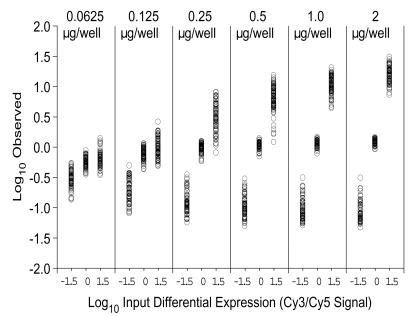
Impact of input DNA concentration on differential gene expression. A dilution series of PCR product for three yeast control fragments was arrayed in triplicate in each of four quadrants. The amount of PCR product in the well prior to arraying is indicated above each panel. Input RNA ratios for labeling with Cy3 versus Cy5 for the three fragments were 30:1, 1:1 and 1:30. The log10 of observed differential expression is plotted as a function of log10 of input RNA ratios.
Quantification of DNA amplimers on the array by a hybridization-independent method
The DNA concentration of the input printing solutions may not be directly predictive of the amount of DNA actually retained on the glass. Variations in the transfer efficiency of individual DNA sequences to the glass and variations in its subsequent retention through the post-arraying and processing procedures may have an impact on the amount of DNA retained. Therefore, a second DNA staining assay was developed using SYTO 61 fluorescent dye, which directly measured the amount of DNA actually retained on the glass, independent of hybridization.
Qualification of 10 000 element cDNA microarrays
Based on the preliminary experiments we applied the PicoGreen and SYTO 61 assays to evaluate two independent 10 000 element microarrays (Fig. (Fig.2).2). Each of the 104 96-well plates used to print the arrays was qualified by PicoGreen analysis and all plate sets had high levels of PCR amplimer (>1.0 µg/well) (Fig. (Fig.2A).2A). The plate sets used to prepare the HGG1 arrays, however, had a greater overall average DNA concentration than those used to prepare the UGV1 arrays: median 3.6 versus 1.85 µg/well, respectively.

Quality control analysis of microarray batches. A set of eight wells randomly selected from each of 104 96-well plates from microarray types UGV1 and HGG1 was analyzed with PicoGreen. The distribution of DNA concentrations is shown in (A). The amount of hybridization signal with a complex probe (Cy3 Brain/Cy5 Heart) is shown as a function of the amount of DNA retained on the glass for microarray types UGV1 (B) and HGG1 (C). Signal distributions from hybridizations with a vector-specific oligonucleotide probe for each array type are shown in (D).
An array from each batch was hybridized with a complex cDNA probe derived from placenta RNA in both the Cy3 and Cy5 channels. SYTO 61 staining was performed on an additional array from each batch and a comparison of the signal outputs for SYTO 61 and hybridization probes for both array batches is shown in Figure Figure2B2B and C. Observed hybridization signals were generally higher for the HGG1 array (Fig. (Fig.2C) 2C) as compared to the UGV1 array (Fig. (Fig.2B): 2B): median Cy3 1049 versus 310 relative fluorescence units (r.f.u.), median Cy5 1137 versus 302 r.f.u., respectively. This was consistent with the higher amount of DNA on the glass for the HGG1 array: median 2532 versus 1905 r.f.u. Higher hybridization signals (>10 000 r.f.u.) were routinely observed when the amount of target DNA bound to the glass approached 2000 r.f.u. by SYTO 61 staining (data not shown). In the examples shown, 35% of the elements on the UGV1 microarray have SYTO 61 stain values <2000 r.f.u., as compared to only 9% of the elements on the HGG1 array. There was an apparent discrepancy in the UGV1 microarray, 65% of all elements on the UGV1 array having higher levels of bound DNA but few yielding hybridization signals >10 000 r.f.u..
To address this issue a third assay was developed. An array from each batch was hybridized with a Cy3-labeled oligonucleotide probe specific for the common vector sequence found in all the PCR products. The signal distribution for these vector hybridizations is presented in Figure Figure2D.2D. The majority of elements on the UGV1 microarray had significantly lower hybridization signals than the HGG1 array: median 1901 versus 6507 r.f.u. These results correlated better with complex probe hybridization than SYTO 61 staining (Fig. (Fig.2B2B and C).
The manufacture of high quality, reproducible arrays with 10 000 or more unique PCR products is an expensive and time-consuming effort. It requires considerable attention to the details of each step in the process and defined procedures to ensure quality and reproducibility. The data presented in this report show that low concentrations of DNA in the input printing solutions result in reduced amounts of arrayed DNA and this, in turn, reduces the dynamic signal range and produces an apparent compression or underestimation of differential expression. The assay procedures reported here have been implemented in the large-scale production of microarrays for use in generating expression databases.
mRNA input
The impact of varying the amount of input mRNA on net cDNA probe synthesis and hybridization was evaluated. Placental mRNAs of varying amounts (25–400 ng) were labeled with Cy3 and hybridized to an equal aliquot labeled with Cy5. Increasing the placental mRNA input yielded increasing amounts of total cDNA product (Fig. (Fig.3A).3A). Hybridization signal-to-background and dynamic range also increased as the mRNA input increased, although a clear point of ‘diminishing returns’ occurs above 200 ng mRNA input (Fig. (Fig.3B3B and C). Based on this mRNA titration series, we believe that using 200 ng mRNA as the standard input for labeling reactions is the optimal amount. A representative example of a competitive hybridization with balanced RNA inputs (200:200 ng) is presented in Figure Figure44A.
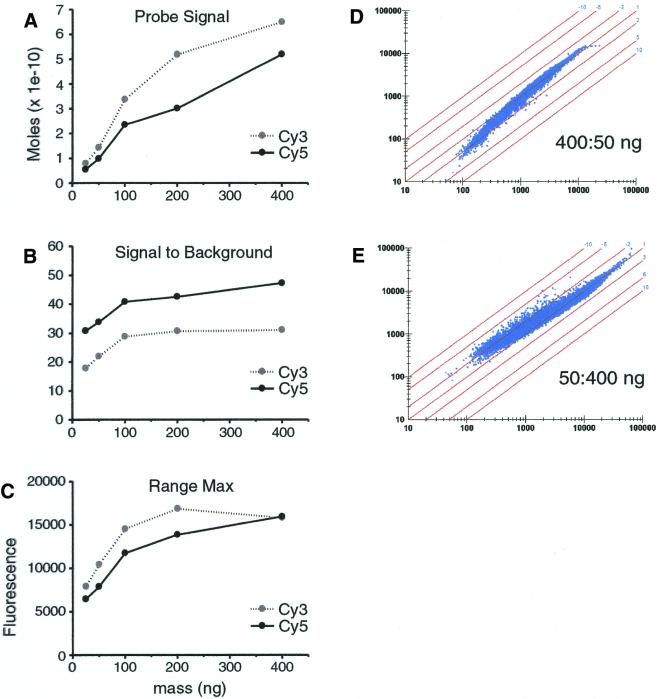
mRNA titration and balance. (A–C) Probe fluorescent signals, signal-to-background and dynamic range as a function of input mRNA mass. Duplicate labeling reactions containing equal amounts of placenta mRNA in both the Cy3 and Cy5 channels were labeled and hybridized to UniGEM V2 arrays. Each data point is an average from the two hybridizations. Probe fluorescence signal was converted to moles product using a standard curve. Range minimum values remained between 100 and 200 U for all hybridizations. (D and E) An aliquot of 50 or 400 ng placenta mRNA was labeled with Cy3 and hybridized to either 400 or 50 ng mRNA labeled with Cy5, respectively, in duplicate. Only one of the two hybridizations is shown. The axes are in arbitrary fluorescent units.
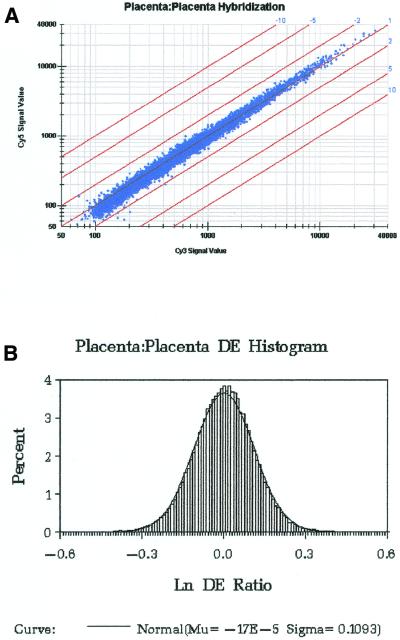
(A) Scatter plot of the calibrated Cy3 versus Cy5 fluorescence response from a typical placenta:placenta hybridization. The diagonal line through the origin corresponds to the expected DE of 1. The other diagonal lines define DE values as indicated next to the line. (B) Histogram showing the distribution of elements by logn of their experimentally derived DEs for 10 homotypic placental hybridizations.
We tested the effect of unbalanced competitive hybridization by hybridizing product prepared from different input levels of placental mRNA in the labeling process (Fig. (Fig.3D3D and E). We observed significant loss in precision and a distortion of the population from the theoretical DE of 1, especially in the lower signal range. This distortion reflects both the impact of differential labeling and hybridization of transcripts with different amounts of mRNA input. Reversing the ratio of input mRNA for probe synthesis resulted in the opposite curvature (Fig. (Fig.3E).3E). We conclude that accurate quantification and use of an equivalent mRNA mass for labeling in both channels is essential for optimum results.
Homotypic response
An estimate of the accuracy and precision of array-generated expression data was first made by performing a series of replicate experiments using various homotypic hybridizations. A competitive hybridization of fluorescently labeled Cy3 and Cy5 cDNA, both prepared from the same placental mRNA, should theoretically give a DE (or Cy3 fluorescence divided by Cy5 fluorescence) of 1 for all 10 000 elements arrayed on the slide. With replicate hybridizations we can evaluate the overall precision of the data using various statistical parameters and obtain an estimate of accuracy from any deviation(s) observed from the theoretical value.
A scatter plot of the Cy3- versus Cy5-calibrated fluorescent response from a single placenta:placenta hybridization is shown in Figure Figure4A.4A. Virtually all gene elements lie close to the diagonal line corresponding to the expected DE of 1. Overall system response was observed to be linear over about three orders of magnitude.
Approximately 100 000 data points from 10 homotypic placenta hybridizations were used to construct a histogram showing the frequency or distribution of gene elements (as a percentage of the total) around logn of the expected DE (ln 1.0 = 0). Effectively, the histogram (Fig. (Fig.4B)4B) is a graphical measure of the range of the signal response for each selected element. The coefficient of variation (CV), or relative standard deviation, provides a quantitative estimate of the precision of differential expression. The calculated CV for differential expression for all elements was 12% across the entire signal range. The same 12% variance was observed across two independently manufactured batches of cDNA microarrays (data not shown).
Ten similar homotypic hybridization experiments were conducted with both human brain and heart samples and the data were compared to the placenta results described above. Results for both sets of hybridizations were identical (data not shown). The same 12% CV for differential expression was observed independent of tissue type over the entire signal range.
Accuracy, in terms of bias, was estimated by calculating an average experimental DE directly from observed fluorescence output and comparing it to the expected value of 1.00. For each of the three tissue types above (placenta, brain and heart) the average (n = 10) experimental DE values were 0.999983, 0.99977 and 0.9998, respectively. The overall average was 0.9999, or less than 1 part in 10 000. These values are in good agreement not only within the group, but also with the expected theoretical value of 1.00.
The observed variation in individual element responses (from the expected DE = 0) for 180 randomly selected genes across the full range of observed signal response (as a function of Cy5 signal) is shown in Figure Figure5A–C 5A–C for placenta, brain and heart tissue. For each of the 180 elements selected all 10 replicate data points are plotted for each gene from each tissue type. Regardless of tissue type we observed few data points with a differential expression greater than 2, even at low overall signal levels.
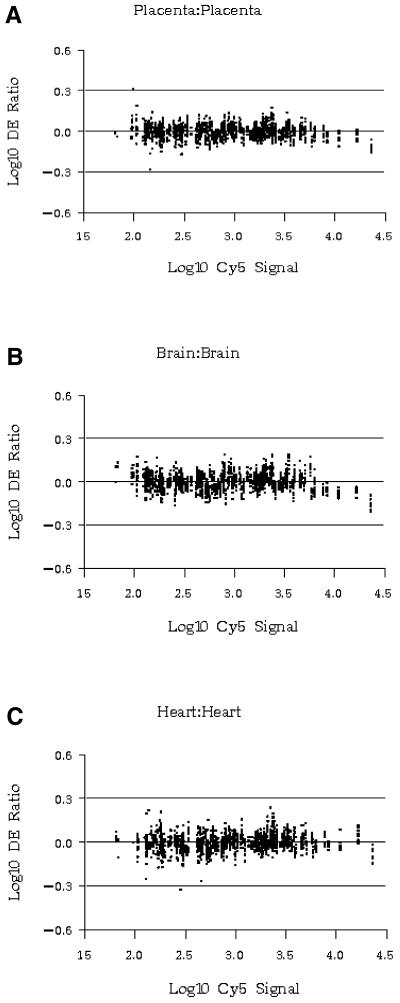
Variation in individual element responses for 180 randomly selected genes over the full range of observed signal response (expressed as log Cy5 signal). All 10 replicate data points for each selected element are plotted along the vertical axis. Horizontal lines define the tolerance interval outside of which DE was deemed significant (see text). (A) Homotypic placental hybridizations. (B) Homotypic brain hybridizations. (C) Homotypic heart hybridizations.
From the above data we can calculate the change in DE required before the value has statistical significance. Mathematically this can be written in terms of the two-sided statistical tolerance interval for the differential expression of non-differentiated elements (16). A statistical tolerance interval is one that contains a specified portion, p, of the entire sampled population with a specified degree of confidence, 100(1 – q)%. Table Table11 shows the 99.5% tolerance intervals for 99% of the elements from each tissue type: all observed differential expression values fall between ±1.4.
Table 1.
| Source | Tolerance interval |
| Placenta:placenta | (–1.332, 1.332) |
| Brain:brain | (–1.397, 1.397) |
| Heart:heart | (–1.384, 1.384) |
| All combined | (–1.370, 1.370) |
The 99.5% tolerance intervals contain at least 99% of the elements on each microarray.
Analysis of variance (ANOVA) was used to estimate the contribution of specific potential sources of variance to the overall variance measured. Analyses were performed using the method of restricted maximum likelihood under SAS for Windows v.6.12 procedure PROC MIXED (17). All of the homotypic placenta, brain and heart data sets were used for this analysis.
There are four general sources of variation in the DE ratios: microarray batch, array-to-array hybridization variance (including sample preparation), biological source tissue and gene sequence variance. Table Table22 lists the estimated contribution of these potential sources of variation to the overall variance measured. The two sources contributing most significantly to the overall variation were hybridization variance and sequence variance. Hybridization variance represents a source of variation from hybridization to hybridization. Sequence variance indicates that different elements demonstrate different levels of variation. Microarray batches and source tissues were not significant sources of variance.
Table 2.
| Variation source | Estimated CV contribution |
| Microarray batch | 0.0% |
| Source tissue | 0.0% |
| Hybridization | 7.8% |
| Gene sequence | 9.4% |
| Total | 12.0% |
ANOVA was performed on placenta, brain and heart homotypic hybridizations.
Differential expression
Using placental mRNA as a common reference, four sets of experimental conditions to measure differential expression were evaluated. Each set contained 10 replicate hybridizations: brain:placenta, placenta:brain, heart:placenta and placenta:heart. Estimates of system precision and detection limits were made as described above for the homotypic hybridizations.
Figure Figure66 shows the fluorescence response plot of a single representative experiment conducted with Cy3-labeled cDNA from heart competitively hybridized to the array with Cy5-labeled cDNA prepared from placenta. Most of the elements (>90%) fell on or close to the 45° line representing no differential expression (or DE = 1.00). However, in contrast to the homotypic hybridizations (Fig. (Fig.4A), 4A), 10% of the elements were also observed to fall outside the tolerance interval, which may indicate significant differential expression (Table (Table11).

Scatter plot of Cy3-labeled cDNA from heart (x-axis) hybridized to the array with Cy5-labeled cDNA from placenta (y-axis) (single experiment). Compare with Figure 4A.
From 10 such replicate experiments in this set we calculated a CV for each of the 10 000 elements and plotted the values against the overall dynamic signal range (as a function of log Cy5 fluorescence signal) as shown in Figure Figure7A.7A. The average CV was observed to be 10–12% across the entire signal range, although there was slightly greater variation at low signal levels. Figure Figure7B7B shows the CV for the same 10 000 elements above plotted as a function of average DE. Most elements are observed to cluster near the value 0, indicating no differential expression. However, the CV of 12% observed for non-differentiated elements, on average, was slightly smaller than the CV for differentiated elements in either direction. The observed average CV ranged from 12% for non-differentiated elements to a maximum value of 25% for elements differentially expressed by a factor of 100. Since the DE is a ratio of the signals from the two channels, variations in the denominator at lower signal levels have a larger impact. Despite these minor differences, overall system precision remains excellent.
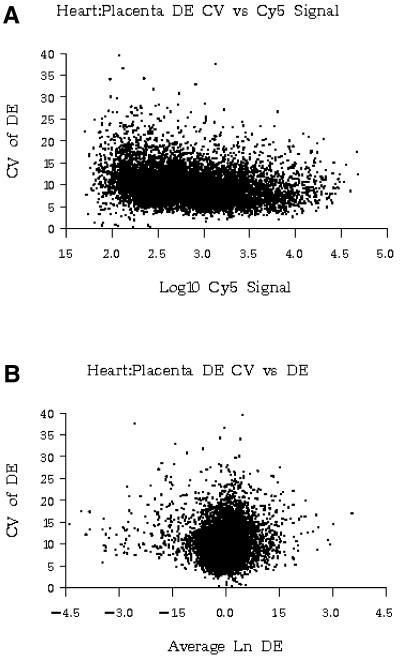
(A) CV for each of 10 000 elements derived from 10 replicate heart:placenta hybridizations plotted as a function of the average observed signal (as Cy5 signal). (B) CV for the same 10 000 elements plotted as a function of logn of the average observed DE (ln DE).
The same 180 random elements in Figure Figure55 were evaluated in ‘reciprocal dye labeling’ experiments. Theoretically, the Cy3- and Cy5-labeled primers should function equivalently for cDNA synthesis. However, any differences in incorporation of label would, if significant, identify differential expression where none exists. It could also account for some of the variation we observe in the different parameters evaluated in this study. Therefore, we performed a series of additional experiments specifically designed to address this issue.
The data from 10 replicates of the brain:placenta hybridizations were compared to the data from 10 replicates of the reciprocally labeled placenta:brain hybridizations. Figure Figure5A 5A shows a plot of the DE for 180 random elements from both sets of data. The DE for any given element in the first set of hybridizations should simply be the reciprocal of the DE for the same element in the second set (when the labeling is reversed). As Figure Figure8A8A shows, the cluster of 10 data points for each element from set 1 lies the same distance above the horizontal line through log10 1.0 = 0 as the corresponding cluster from set 2 lies below it. Figure Figure8B8B shows a similar plot generated from 20 microarrays, where 10 heart:placenta hybridizations were compared to the reciprocally labeled placenta:heart hybridizations, with essentially equivalent results.

Reciprocal labeling experiments showing the data plotted from 180 random elements from (A) 10 replicate brain:placenta (black symbols) and 10 replicate placenta:brain (blue symbols) hybridizations versus log DE, and (B) 10 replicate heart:placenta (black) and 10 replicate placenta:heart (blue) hybridizations.
For each element we can define the axial symmetry of reflection (ASR) as the inflection point between the DEs from the reciprocal labeling experiments, calculated by averaging the two DE ratios. Calculated average ASR values of 0.998 and 0.999 were obtained from the placenta:brain and placenta:heart data sets, respectively, in good agreement with the theoretical value of 1.00. Thus any systematic bias introduced into the DE by reciprocal labeling must be less than 1–2 parts in 1000. These results independently verify the precision in measuring differential expression, as well as in identifying those genes that are not differentially expressed. Histograms showing the distribution of all elements (as a percentage of the total) as a function of ln ASR (Fig. (Fig.9A9A and B) were similar to the histogram observed for non-differentiated elements (Fig. (Fig.4B).4B). They also had the same standard deviation. Therefore, any variation observed in DE was likely a result of real variations in experimental mRNA levels, rather than an artifact of the labeling system.
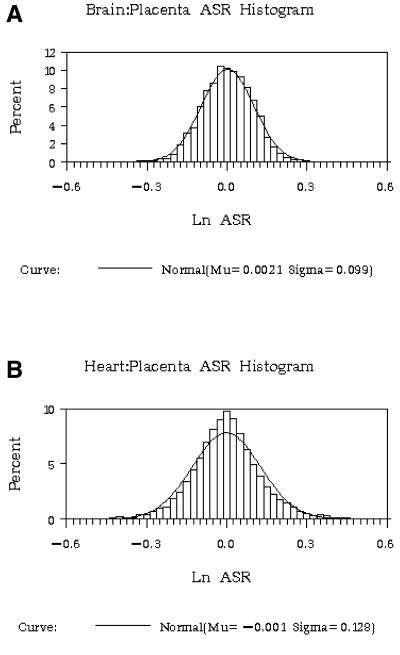
Histograms showing the distribution of all elements as a function of ln ASR from reciprocal labeling experiments. (A) Data for brain:placenta and placenta:brain hybridizations. (B) Data for heart:placenta and placenta:heart hybridizations.
A series of independent yeast standards was also included on each microarray to assist in evaluating overall system performance. These controls demonstrated linearity in overall signal response over three orders of magnitude, a CV of 12% and a limit of detection of 2 pg mRNA at a signal-to-background ratio of 2.5 (data not shown).
CONCLUSION
In this report we have described measures important in the manufacture of cDNA microarrays and in the preparation and labeling of mRNAs for use in a two-channel hybridization system. Furthermore, the results presented in this report demonstrate in a quantitative fashion the performance of the cDNA microarray technology platform. The usefulness of any expression database is ultimately dependent on the quality of the underlying data used to construct it. We report that the cDNA microarray platform does provide the high quality data needed to establish reliable gene expression databases.
The analytical methods used to evaluate the performance of the cDNA microarray platform described in this report provide a practical framework for evaluating the performance of other technologies that purport to measure global mRNA expression. Only by disclosing the performance characteristics in a rigorous manner can researchers gauge the utility of any data produced by other platforms.
ACKNOWLEDGEMENTS
We thank the Incyte Microarray Production Facility (Fremont, CA) for manufacturing the microarrays, preparing the probes and performing the hybridizations used in this report. We also thank Drew Watson for providing resources and his encouragement to complete these experiments and Jeanne Loring for useful discussions.
References
Articles from Nucleic Acids Research are provided here courtesy of Oxford University Press
Full text links
Read article at publisher's site: https://doi.org/10.1093/nar/29.8.e41
Read article for free, from open access legal sources, via Unpaywall:
https://academic.oup.com/nar/article-pdf/29/8/e41/9900977/2900e41.pdf
Citations & impact
Impact metrics
Article citations
Calcium sensing and signaling are impaired in the lumbar spine of a rat model of congenital kyphosis.
Eur Spine J, 32(10):3403-3412, 09 Aug 2023
Cited by: 1 article | PMID: 37555955
Microarray Data Preprocessing: From Experimental Design to Differential Analysis.
Methods Mol Biol, 2401:79-100, 01 Jan 2022
Cited by: 2 articles | PMID: 34902124
Trypanosoma cruzi specific mRNA amplification by in vitro transcription improves parasite transcriptomics in host-parasite RNA mixtures.
BMC Genomics, 18(1):793, 16 Oct 2017
Cited by: 1 article | PMID: 29037144 | PMCID: PMC5644099
Systematic identification of human housekeeping genes possibly useful as references in gene expression studies.
Mol Med Rep, 16(3):2397-2410, 06 Jul 2017
Cited by: 38 articles | PMID: 28713914 | PMCID: PMC5548050
Gene expression variability and the analysis of large-scale RNA-seq studies with the MDSeq.
Nucleic Acids Res, 45(13):e127, 01 Jul 2017
Cited by: 19 articles | PMID: 28535263 | PMCID: PMC5737414
Go to all (164) article citations
Similar Articles
To arrive at the top five similar articles we use a word-weighted algorithm to compare words from the Title and Abstract of each citation.
Accuracy and calibration of commercial oligonucleotide and custom cDNA microarrays.
Nucleic Acids Res, 30(10):e48, 01 May 2002
Cited by: 331 articles | PMID: 12000853 | PMCID: PMC115302
Sequence-matched probes produce increased cross-platform consistency and more reproducible biological results in microarray-based gene expression measurements.
Nucleic Acids Res, 32(9):e74, 25 May 2004
Cited by: 118 articles | PMID: 15161944 | PMCID: PMC419626
Reproducibility of alternative probe synthesis approaches for gene expression profiling with arrays.
J Mol Diagn, 2(3):124-127, 01 Aug 2000
Cited by: 26 articles | PMID: 11229515 | PMCID: PMC1906904
Post-analysis follow-up and validation of microarray experiments.
Nat Genet, 32 Suppl:509-514, 01 Dec 2002
Cited by: 233 articles | PMID: 12454646
Review


