Abstract
Free full text

Comparative Metabolic Flux Profiling of Melanoma Cell Lines

Abstract
Metabolic rewiring is an established hallmark of cancer, but the details of this rewiring at a systems level are not well characterized. Here we acquire this insight in a melanoma cell line panel by tracking metabolic flux using isotopically labeled nutrients. Metabolic profiling and flux balance analysis were used to compare normal melanocytes to melanoma cell lines in both normoxic and hypoxic conditions. All melanoma cells exhibited the Warburg phenomenon; they used more glucose and produced more lactate than melanocytes. Other changes were observed in melanoma cells that are not described by the Warburg phenomenon. Hypoxic conditions increased fermentation of glucose to lactate in both melanocytes and melanoma cells (the Pasteur effect). However, metabolism was not strictly glycolytic, as the tricarboxylic acid (TCA) cycle was functional in all melanoma lines, even under hypoxia. Furthermore, glutamine was also a key nutrient providing a substantial anaplerotic contribution to the TCA cycle. In the WM35 melanoma line glutamine was metabolized in the “reverse” (reductive) direction in the TCA cycle, particularly under hypoxia. This reverse flux allowed the melanoma cells to synthesize fatty acids from glutamine while glucose was primarily converted to lactate. Altogether, this study, which is the first comprehensive comparative analysis of metabolism in melanoma cells, provides a foundation for targeting metabolism for therapeutic benefit in melanoma.
Introduction
Metabolism in cancer cells differs from that of normal non-proliferative cells. Perhaps the most common variation from the norm in cancer metabolism is “aerobic glycolysis” or the Warburg effect. Under the Warburg effect, metabolism of glucose is largely fermentative rather than respiratory, with increased production of lactate, in normal atmospheric oxygen conditions (1). This is also associated with increased uptake of glucose, a common characteristic of cancers detectable in tumors in patients via 18F-deoxyglucose-PET (2). However, the extent to which the Warburg effect represents a rebalancing of metabolism (increasing fermentation while decreasing respiration) versus an amplification of metabolism (increasing fermentation while maintaining, or even increasing, respiration) is the subject of debate (3, 4). The Warburg effect contrasts with the Pasteur effect, in that the latter describes the switch from fermentation to respiration when oxygen is plentiful, and its reversal when oxygen is limiting (5), while the Warburg effect describes fermentative activity of cancer cells irrespective of oxygen. In the progression of tumors, cancer cells are subject to a range of oxygen concentrations, and low oxygen induces hypoxia-inducible factor (HIF),2 which leads to a metabolic re-wiring of cancer cells, resulting in a more glycolytic metabolism (6). Therefore, cancer cells may potentially demonstrate both Warburg and Pasteur effects. Furthermore, beyond glycolysis, altered oncogene expression has strong effects on other branches of central carbon metabolism. For instance, c-Myc expression leads to increased glutamine catabolism providing an alternative input of nutrients into the tricarboxylic acid (TCA) cycle (anaplerosis) (7).
Melanoma is a severe disease if not detected early, but allowed to progress to the deadly metastatic stage (8). Melanoma metabolism likely has specific features, apart from those of general cancer metabolism, controlled by its environment and specific signaling mutations. In terms of environment, the normal cells that give rise to melanoma, melanocytes, are located in a naturally mildly hypoxic environment (10% or less O2) (9), which may pre-adapt melanoma to hypoxia. In signal transduction pathways, melanomas typically are mutated in BRAF or NRAS (10). Both of these mutations may affect metabolism via HIF or other mechanisms (9). In contrast to numerous studies of melanoma-associated signaling cascades, relatively little effort has been invested so far in the analysis of melanoma metabolism. Currently, there is only one agent in clinical trials for melanoma which targets central carbon metabolism (11, 12). Better understanding of metabolic changes associated with melanoma incidence and progression is expected to assist in pursuing novel diagnostic and therapeutic targets.
In a growing number of studies, the central carbon metabolism of tumors is being explored as an interconnected system (13, 14). Stable isotope (13C) tracking of central metabolic pathways provides a dynamic picture of metabolism, which complements metabolite pool size data that are typically assessed by conventional targeted metabolomics. In previous studies we used a comparative approach based on 13C-labeling to reveal up-regulation of proline and fatty acid biosynthesis in metastatic breast cancer (15, 16). Here we extended this methodology to perform comparative profiling of metabolic fluxes in a panel of melanoma cell lines and melanocytes grown under normoxic and hypoxic conditions. This analysis revealed a number of common and distinctive features of melanoma cell lines. Interesting differences were observed in the metabolic response to hypoxia between melanocytes and the analyzed melanoma lines. The melanoma cells showed the Warburg effect, and an additional Pasteur effect with hypoxia, yet not all glucose was consumed in glycolysis. Glutamine provided a strong anaplerotic input to the TCA cycle and specifically contributed to fatty acid synthesis in hypoxia via reductive flux from α-ketoglutarate to citrate.
EXPERIMENTAL PROCEDURES
Cell Culture, Labeling, and Sample Collection
The following melanoma cell lines were used: WM35, Mel501, UACC903, WM793, Lu1205, and MeWo (17–20). These cell lines were cultured in RPMI with 10% fetal bovine serum. Immortalized human melanocyte Hermes 3A (H3A) (21) and primary human melanocytes (NEM-LP; Invitrogen) were cultured in media as described (22). Melanoma cell lines and primary melanocytes were cultured in 5% CO2/air and H3A melanocytes in 10% CO2/air (both at 37 °C). Labeling was started with cell cultures at ~40% confluency. At that point (t) = 0 h, the medium was replaced with MEM (Cellgro 15–010: 1 g/liter glucose, no glutamine) supplemented with 1 g/liter [U-13C6]glucose (Sigma-Aldrich), 10% (v/v) fetal bovine serum, 1 mm l-glutamine, 1% (v/v) antibiotic/antimycotic solution (Omega), and 1% v/v MEM vitamins (Irvine Scientific). The final glucose concentration, factoring in dilution by serum, was 1.9 g/liter with 47% [U-13C]glucose (confirmed by GC-MS analysis of medium samples). Alternately, in some experiments, the same labeling medium was used except that in MEM, 50% [U-13C5]glutamine (Sigma-Aldrich) replaced 50% [U-13C]glucose. All cell lines were passaged less than 10 times between thawing and the completion of [U-13C]glucose labeling. During the labeling period, cells were maintained in 5% CO2/air (“normoxia”) or 1% oxygen/5% CO2/94% nitrogen (“hypoxia”).
A sample of the labeling media was taken at t = 0 and stored as a reference for analysis. Additional samples of the labeling media were collected at 24 h. Following the 24-h labeling period cells were rinsed with phosphate-buffered saline, detached with trypsin and subjected to centrifugation at 500 × g for 5 min. Cell pellets were stored at −80 °C for subsequent analysis.
GC-MS
Cell pellets (1–5 × 10⁶ cells) were resuspended in 0.6 ml of cold (−20 °C) 50% methanol (in water) containing 100 μm 2-amino-butyrate or 100 μm l-norvaline (internal standard), left to freeze on dry ice for 30 min, then thawed on ice for 10 min before centrifugation. The liquid phase was removed to a separate tube, and 0.3 ml of chloroform with 4 μg/ml C17:0 fatty acid internal standard was added to the pellet. The tube was vortexed (15 s ×5), before centrifugation for 5 min at 14,000 rpm/4 °C. This chloroform extract was re-combined with the initial methanol/water extract, vortexed, and centrifuged as above. The top (methanol extract) layer and lower (chloroform) were divided into 2–3 separate lots, dried by centrifugal evaporation and stored at −80 before analysis. Samples of culture medium (0.1 ml) were processed similarly, except that 0.5 ml of methanol-water mixture was added initially.
Dried methanol extracts were derivatized first by addition of 50 μl 20 mg/ml methoxyamine-hydrochloride (Sigma, in dry pyridine) and incubation for 20 min at 80 °C. After cooling, 50 μl N-tert-butyldimethylsilyl-N-methyltrifluoroacetamide (Sigma) was added and samples were re-incubated for 60 min at 80 °C before centrifugation for 5 min at 14,000 rpm/4 °C. The supernatant was transferred to an autosampler vial for gas chromatography-mass spectrometry (GC-MS) analysis. A Shimadzu QP2010 Plus GC-MS was programmed with an injection temperature of 250 °C, injection split ratio 1/10, with (typically) injection volume 0.5 μl. GC oven temperature started at 130 °C for 4 min, rising to 230 °C at 4 °C/min and to 280 °C at 20 °C/min with a final hold at this temperature for 2 min. GC flow rate with helium carrier gas was 50 cm/s. The GC column used was a 15 m × 0.25 mm × 0.25 μm SHRXI-5ms (Shimadzu). GC-MS interface temperature was 300 °C and (electron impact) ion source temperature was 200 °C, with 70 V/150 μA ionization voltage/current. The mass spectrometer was set to scan m/z range 50–600, with ~1 kV detector sensitivity (modified as necessary). For analysis of pyruvate, the derivatization procedure was modified by the substitution of ethylhydroxylamine for methoxyamine, and the initial GC-MS oven temperature was 110 °C for 4 min, rising to 230 °C at 6 °C/min and thereafter as above. Glucose in medium extracts was analyzed using the aldonitrile derivatization method of Price (23).
To analyze fatty acids as methyl esters, dried chloroform extracts were resuspended in 200 μl of 0.5 n HCl in methanol, and heated for 30 min at 60 °C before drying and resuspension in 100 μl of chloroform and transfer to autosampler vials. GC-MS conditions were as above, except that typical injection volume was 2 μl and GC oven temperature was initially 140 °C for 4 min, rising to 210 °C at 4 °C/min and to 280 °C at 20 °C/min with a final hold at this temperature for 2 min. The EI source was tuned with 30 eV/20 μA ionization voltage/current, and the mass spectrometer was set to scan m/z range 200–600, with ~1.7 kV detector sensitivity (modified as necessary).
GC-MS data for polar metabolites were analyzed to determine 13C-labeling and quantities of metabolites. Metabolites were quantified on the basis of total ion count peak area or specific mass ions, using standard curves generated from running standards in the same batch of samples. To determine 13C-labeling, mass information for known fragments of labeled amino acids or other carboxylic acids was retrieved. These fragments contained either the whole carbon skeleton of the metabolite, or lacked the α-carboxyl carbon, or (for some amino acids) contained only the backbone minus the side-chain (24). For each fragment, the retrieved data comprised mass intensities for the lightest isotopomer (without any heavy isotopes, M0), and isotopomers with increasing unit mass (up to M6) relative to M0. These mass distributions were normalized by dividing by the sum of M0 to M6, and corrected for the natural abundance of heavy isotopes of the elements H, N, O, Si, and C, using matrix-based probabilistic methods as described (24, 25) implemented in Microsoft Excel (26). 13C-labeling data are expressed as average percentage 13C-labeling per carbon in a measured metabolite, or these average 13C-labeling data were converted to percentage from glucose or glutamine by dividing by percent labeling of glucose or glutamine.
Mass data for [U-13C]glucose labeling of malate (which showed similar mass distribution to aspartate and fumarate and therefore was reasonably assumed to be in equilibrium with oxaloacetate), were used to assess the relative inputs to malate or oxaloacetate from the TCA cycle versus the anaplerotic reaction pyruvate carboxylase. In broad terms, input from anaplerosis was apparent as a peak at M3 in the labeling of malate, indicative of incorporation of linked 13C 3-carbon units arising from pyruvate, while input from the TCA cycle appeared as a peak at M2 indicative of input of 2-carbon units originating as acetyl-CoA. Input from the TCA cycle direction was estimated based on the mass distribution of glutamate (C2-C5 fragment, equivalent to the same fragment in α-ketoglutarate), and input via pyruvate carboxylase was estimated as the combination of lactate (for pyruvate) labeling plus CO2, assumed to be unlabeled. Similarly with [U-13C]glutamine labeling, relative inputs to citrate via citrate synthase or via reverse flux in the TCA cycle were calculated by fitting the oxaloacetate plus acetyl-CoA mass distributions (the latter inferred from the labeling of the C2-C3 fragment of lactate) for input from citrate synthase, and the glutamate (C1-C5) mass distribution plus unlabeled CO2 for the reverse input. Fitting calculations were done in Matlab.
To estimate relative ATP production from glucose or glutamine, the following calculation was made. First, the relative proportion of malate formed from either substrate via one forward turn of the TCA cycle was calculated as (for glucose) the ratio of [M2 labeling of malate] to [labeling of input glucose]; (for glutamine) the ratio of [M4 labeling of malate] to [labeling of input glutamine]. As noted above, malate labeling was assumed to match oxaloacetate labeling and could therefore be used to calculate flux through the complete TCA cycle. Next, it was assumed that one full turn of the TCA cycle produced the equivalent of 10 molecules of ATP (from 3 NADH, plus FADH2, plus GTP (27)), and that labeled malate was fully oxidized in the TCA cycle, so the ATP yield from M4-labeled malate from glutamine was twice the yield from M2-labeled malate from glucose. ATP yield in the TCA cycle from glutamine was corrected proportionately for the measured reverse flux from glutamine to citrate by assuming the reverse flux consumed 2.5 molecules of ATP, representing the equivalent of 1 molecule of NADH or NADPH used in the reverse isocitrate dehydrogenase reaction. Relative ATP production from glucose or glutamine in the TCA cycle was then calculated as the ratio of (relative forward flux from glucose x10) to (relative forward flux from glutamine ×20 minus proportionate reverse flux from glutamine ×2.5). For ATP yield from total cellular metabolism, the yield from glucose was adjusted by adding ATP derived from glucose in glycolysis en route to acetyl-CoA synthesis and the TCA cycle (2 NADH plus 1 ATP or 6 ATP equivalents per acetyl-CoA unit), plus ATP from the fraction of glucose that was converted to lactate or pyruvate (and excreted), and not oxidized in the TCA cycle (2 ATP per lactate and 4.5 ATP (2 ATP and 1 NADH) per pyruvate). A range of total ATP yield from glutamine was calculated with glutamine input to the TCA cycle either being routed 100% through glutamate dehydrogenase and therefore generating an extra 1 NADH (2.5 ATP) per glutamine, or being 100% routed through alternate pathways (e.g. transaminases) that produce no additional ATP.
GC-MS mass distributions for fatty acid methyl esters for C14:0 (myristate) and C16:0 (palmitate) fatty acids were corrected for isotope natural abundance as above, and the corrected isotope patterns were used to calculate the labeling of acetyl-CoA as described before (15, 28), based on a binomial probability distribution of the incorporation of labeled acetyl units into the fatty acid chain.
To visualize results as heat maps, data were imported into Gene Cluster 3.0 (29) (as revised by Michiel de Hoon) as tables with samples along one axis and percent 13C-labeling of measured metabolites on the other axis. Data were centered, first along the sample axis by subtraction of values in each row from the row mean (this compensates for differences in overall labeling between samples), and secondly along the metabolite axis by subtraction of values in each column from the column mean (this compensates for general differences between labeling of metabolites and prevents the clustering from being dominated by highly labeled metabolites such as lactate). Data in both directions (metabolite and sample) were hierarchically clustered using Pearson's correlation in Gene Cluster. Results were visualized using Java TreeView 1.1.4r3 (30).
Quantification of Total Protein
The amount of protein present in cell samples was determined using the DC Protein Assay kit (Bio-Rad). The assay was performed generally according to the manufacturer's protocol in microplate format. Briefly, 2.5 μl of cell lysate was added to 225 μl of reaction mixture and incubated at room temperature for 30 min. The reaction was monitored via UV absorbance at 650 nm using a Bio-Rad 3550-UV microplate reader. Each measurement was performed in triplicate. The protein concentration was calculated using a bovine serum albumin standard curve.
Quantification of Glucose and Glutamine Consumption and Lactate Production
The amount of glucose present in the media samples was determined using the Glucose Hexokinase kit (GAGK-20) from Sigma. The assay was performed generally according to the manufacturer's protocol but scaled down to microplate format. Briefly, 2 μl of medium was added to 95 μl of enzyme mixture and incubated at 37 °C for 30 min. Glutamine concentration in media samples was determined using a glutamine assay kit (Megazyme), per manufacturer's instructions except that 20-μl samples were assayed in 250 μl of final assay volume, and plates were incubated for 30 min at room temperature after glutamate dehydrogenase addition, before reading final absorbance at 340 nm.
The amount of lactate present in media samples was determined by generally following the Sigma Diagnostics Procedure No. 826-UV. All components were purchased from Sigma. Nicotinamide adenine dinucleotide (10 mg) was dissolved in 2 ml of glycine buffer, 4 ml of water, and 100 μl lactate dehydrogenase (1000 units/ml). A sample of medium (2.5 μl) was added to 145 μl of this enzyme mixture and incubated at room temperature for 30 min. The amount of lactate was calculated from the observed decrease in absorbance at 340 nm.
RESULTS
Melanoma Cell Lines Exhibit the Warburg and Pasteur Effects
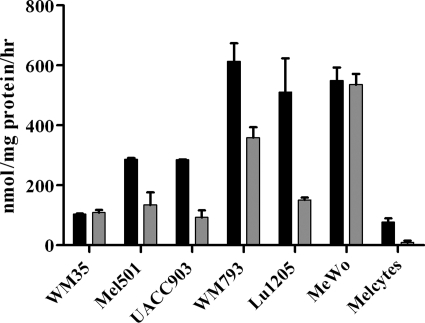
Glucose uptake and lactate production were compared in melanoma cells lines and melanocytes. Measurements were made on conditioned medium after 24 h (Fig. 1, A and B). As expected, glucose uptake and lactate output were greater in melanoma cells than melanocytes. In all cases, more than 90% of secreted lactate was produced from glucose (result not shown). These observations are consistent with the Warburg effect. Furthermore, in hypoxia, lactate production was greater in all cells (Fig. 1B), consistent with the Pasteur effect (increased fermentation with reduced oxygen supply), although cell lines WM793 and Lu1205 did not match this with increased glucose utilization (Fig. 1A).
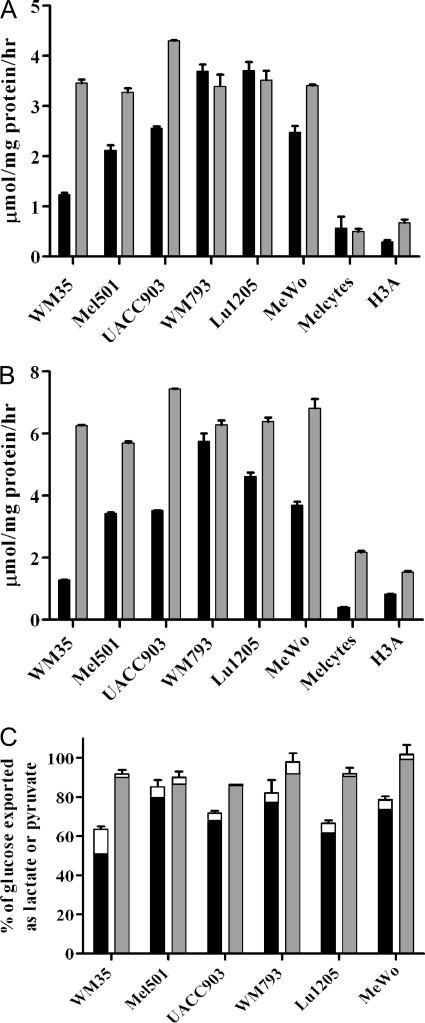
Flux from glucose to lactate in melanoma cells and melanocytes. Six melanoma lines and two melanocyte (Melcytes, H3A) lines were incubated for 24 h in [13C]glucose medium under normoxic (black bars) or hypoxic (gray bars) conditions. Samples were analyzed for consumption of glucose (A), production of lactate (B), and the percentage of consumed glucose converted to lactate plus pyruvate (C). The small fraction of glucose converted to pyruvate is indicated by the upper open sections of bars in panel C. Melanocytes are not shown in panel C, because low glucose uptake and lactate output rates yielded large errors. Error bars show range of results from repeat assays.
Using [13C]glucose labeling, we also determined the fraction of glucose that was converted to lactate or pyruvate in conditioned media. In melanoma cells, on average 75% of glucose was converted to lactate or pyruvate in normoxia, and 93% in hypoxia (Fig. 1C; metabolism to alanine was also calculated but was relatively insignificant; data including flux to alanine are shown in supplemental Table S1). This observation implied that on average in hypoxia in melanoma cells, only 7% of utilized glucose was potentially available for respiration via the TCA cycle. Nevertheless, this fraction is significant because oxidation of glucose via the TCA cycle yields ~30 molecules of ATP (27). In contrast, conversion of glucose to lactate yields only 2 molecules of ATP. Consequently, the small fraction of glucose that was not converted to lactate or pyruvate could potentially produce as much ATP if completely oxidized via the TCA cycle.
Hypoxia Alters Central Carbon Metabolism in Melanoma Cells More Than in Melanocytes
To study the effects of hypoxia on the metabolism of melanoma cells and melanocytes in more detail, the 13C-labeling of metabolites of central metabolism in cell extracts from [13C]glucose cultures was analyzed by GC-MS. Data were normalized to compensate for overall differences in labeling between samples and between metabolites (see “Experimental Procedures”). Normalized values were clustered in an unsupervised manner and visualized as a heat map (Fig. 2). The heat map thus provides a global picture of relative flux from glucose to each metabolite (raw labeling data are provided in supplemental Table S2). Not surprisingly, clustering along the x axis resulted in association of biochemically coupled metabolites. For example, lactate and alanine, which are both end-products of glycolysis, clustered together. Similarly, serine and glycine, which are linked through serine hydroxymethyltransferase, were grouped, while a third cluster included the remaining six metabolites, all components of, or produced via, the TCA cycle. Beyond the clustering of metabolites, the heat map also reveals differences in the flux from glucose. Lactate and alanine were generally highly labeled in hypoxia. In contrast, metabolites of the TCA cycle and related amino acids were labeled to a lower degree in hypoxia. These findings are consistent with the high flux from glucose to lactate, and reduced relative flux through the TCA cycle in hypoxic conditions (see Fig. 1).
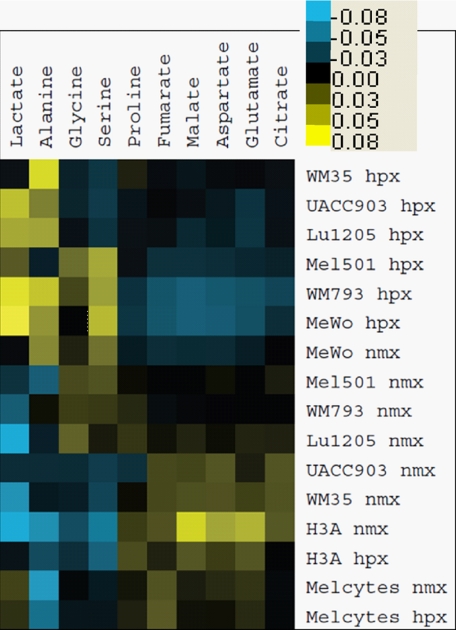
Flux from glucose to intracellular metabolites in normoxia and hypoxia. Cell samples from 24-h [13C]glucose labeling experiments as in Fig. 1 were analyzed by GC-MS for 13C-labeling of metabolites. Data were averaged from 2 experiments and converted to a heat map as described under “Experimental Procedures.” Shades of yellow indicate labeling above the mean, and shades of blue indicate labeling below the mean of adjusted data. The scale bar indicates variation from mean of adjusted data. Melanocyte line names are as in Fig. 1. Normoxic samples are indicated as nmx, and hypoxic as hpx. Source data (percent 13C-labeling) for this figure are given in supplemental Table S2.
The most striking observation that is evident from the clustering of cell samples (Fig. 2) is a significant division in samples collected under normoxic versus hypoxic conditions. This difference is primarily driven by the opposite trends of relative flux from glucose to glycolytic and TCA cycle metabolites in response to hypoxia (as mentioned above). However, these changes were much less pronounced (if present at all) in melanocytes, where samples clustered together irrespective of oxygen levels (Fig. 2). In melanocytes, flux from glucose into the TCA cycle was relatively well maintained, while on the glycolytic side of the balance, low synthesis of alanine from glucose only slightly increased with hypoxia in melanocytes (Fig. 3A). Indeed, a consistent difference between the melanocytes and melanoma cell lines was that, in melanocytes, a smaller fraction of the alanine pool was produced from glucose (~5%) compared with melanoma cells (>10%) (Fig. 3A). Data for extracellular alanine production from glucose similarly showed greater production by melanoma cells than melanocytes (supplemental Table S1). Alanine and lactate are both potential end-products of glycolysis, but no cell-specific difference in percentage of lactate synthesized from glucose was observed (Fig. 3B), even though melanocytes were quantitatively producing less lactate than melanoma cells (Fig. 1). The lower alanine labeling in melanocytes was not because they were consuming alanine from the medium, as analysis of spent medium showed that all cell lines studied were net producers of alanine (result not shown), but might relate to low glutamine usage, and therefore a lower requirement to excrete excess nitrogen in the form of alanine.
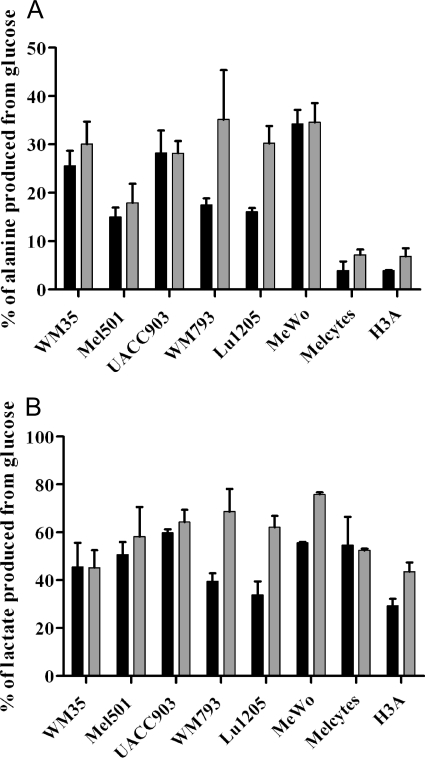
Proportion of intracellular alanine and lactate derived from glucose in melanoma cells and melanocytes. 13C-labeling of cell samples (as in Fig. 2) was measured to determine the fraction of alanine or lactate derived from glucose. Black bars, normoxia; gray bars, hypoxia. Error bars show range of results from biological repeats. Melanocyte line names are as in Fig. 1. A, alanine; B, lactate.
The Melanoma TCA Cycle Continues to Function in Hypoxia
In hypoxic melanoma cells, not all glucose was secreted in the form of lactate or pyruvate (Fig. 1C), indicating that glucose could still be channeled into the TCA cycle. In fact, metabolites of the TCA cycle metabolites were labeled in hypoxia (supplemental Table S2). To assess the functionality of the TCA cycle more critically, we analyzed the labeling of malate in normoxic and hypoxic conditions. Malate is a suitable reporter because it is synthesized in the TCA cycle, but can also be made independently from pyruvate via oxaloacetate by the anaplerotic action of pyruvate carboxylase. These two biosynthetic routes can be distinguished in mass spectrometry because malate synthesized within the TCA cycle contains 2 additional mass units from glucose, but the pyruvate carboxylase reaction adds 3 mass units (Fig. 4). Only in a few cases (most notably in melanoma cell line UACC903 and to some extent in melanocytes) was a measureable contribution from pyruvate carboxylase input observed (Fig. 4). This analysis confirmed that the TCA cycle operated in all cell lines even under hypoxia, and entry into the cycle via pyruvate carboxylase was minor at most.
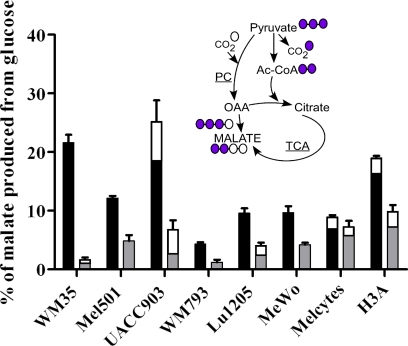
Intracellular malate derived from glucose in melanoma cells and melanocytes. 13C-labeling of malate was analyzed to determine the percentage derived from glucose and whether input of 13C was via the TCA cycle or pyruvate carboxylase. Black bars, normoxia; gray bars, hypoxia. The fractional input to malate via pyruvate carboxylase (where present) is indicated by the upper open sections of bars. Cell lines are as in Fig. 1. The inset cartoon illustrates how the alternate inputs to malate produce 13C3-labeled or 13C2-labeled malate via pyruvate carboxylase (PC) or via the TCA cycle, respectively. 13C carbons are color-coded violet. Unlabeled carbons are color-coded white. OAA: oxaloacetate; Ac-CoA: acetyl-coenzyme A.
Glutamine Contributes a Strong Anaplerotic Flux in WM35 Melanoma Cells
The relatively low labeling of TCA cycle metabolites by [13C]glucose suggested a substantial contribution from other nutrients. Glutamine is a known alternate carbon source for cancer cells, so we measured glutamine utilization by melanoma cells and melanocytes (Fig. 5). Glutamine uptake from the medium was greater in melanoma cells than in melanocytes, and particularly so under hypoxic conditions. To assess the use of glutamine in melanoma, we labeled WM35 cells under normoxia and hypoxia with [13C]glutamine. Flux from glutamine to each metabolite was quantified, and then results were combined with flux from glucose (see Fig. 2) to calculate the proportion of metabolites originating from each substrate (Fig. 6). Interestingly, there was a clear demarcation between the contributions of these two nutrients to different parts of metabolism. Glucose was the primary carbon source for glycolytic intermediates (black/gray bars in Fig. 6). Glutamine made almost no contribution to these metabolites, indicating the absence of gluconeogenetic flux. However, glutamine was the primary source of carbon for metabolites of the TCA cycle (red/pink bars in Fig. 6), so it made a major anaplerotic contribution. Hypoxia markedly increased the contribution from glutamine to TCA cycle intermediates. Using labeling data and with certain assumptions as detailed under “Experimental Procedures,” we estimated the relative production of ATP from glucose or glutamine in WM35 cells as 33–36% from glucose/64–67% from glutamine in normoxia; 6–7% from glucose/93–94% from glutamine in hypoxia. (Higher values for glutamine assume oxidation via glutamate dehydrogenase; lower values, other, non-ATP-generating pathways. ATP from glutamine calculations include a correction for the “reverse” TCA cycle flux from glutamine described in the next section. The fraction of ATP production from glucose that was due to fermentation to lactate or pyruvate and not full oxidation was calculated as 12% in normoxia and 49% in hypoxia).
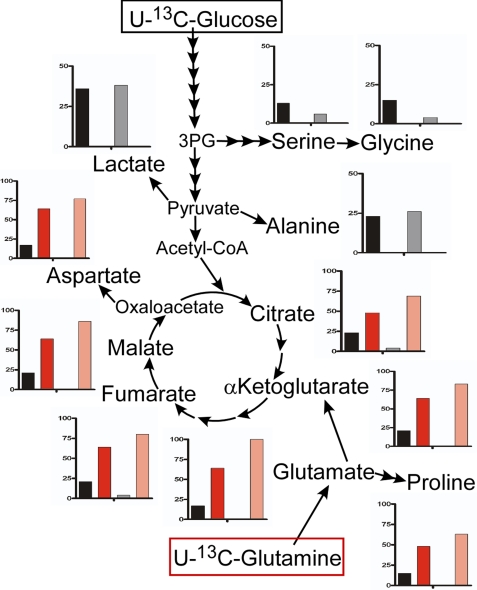
Comparative 13C-labeling from glucose or glutamine in WM35 melanoma cells. WM35 cells were labeled for 24 h with [13C]glucose or [13C]glutamine, and fractions of metabolites that were derived from either substrate were calculated. These fractions are shown as charts adjacent to each assayed metabolite. Input from glucose, black (normoxia) or gray (hypoxia); input from glutamine, red (normoxia) or pink (hypoxia). The vertical axis of each chart indicates 100% input at full scale, except for serine, glycine, lactate, and alanine, where full scale equals 50% input.
Glutamine Contributes to Fatty Acid Synthesis via Reverse Flux through the TCA Cycle
Although in mammalian cells the TCA cycle typically runs in the oxidative direction, several recent studies reported the existence of the reverse (reductive) flux between citrate and α-ketoglutarate (31–34). When [U-13C]glutamine is used as labeling substrate, reverse flux can be identified by the presence of M5 (+5 mass units) citrate (Fig. 7A). Indeed, we observed a significant M5 fraction of citrate in [13C]glutamine-labeled WM35 cells (Fig. 7B). Citrate mass distributions in normoxia and hypoxia were fitted to 13C-labeled inputs from the forward (citrate synthase) and reverse (isocitrate dehydrogenase/aconitase) directions to determine the ratio of the inputs. These calculations showed that in normoxia the reverse flux contributed 12%, and in hypoxia 38%, of the total citrate synthesized. Because citrate is exported to the cytosol where it is converted to acetyl-CoA (Fig. 7A), it can be a source for fatty acid synthesis. Therefore, we quantified the 13C-labeling of acetyl-CoA in fatty acids in these samples labeled with [13C]glutamine or [13C]glucose (Fig. 7C). The only route whereby glutamine could be directly converted to fatty acids is via reductive carboxylation, given that glutamine did not significantly label lactate or alanine (and therefore pyruvate and acetyl-CoA; Figs. 6 and and77A). Going from normoxia to hypoxia showed a reversal in the contribution of glucose and glutamine as fatty acid precursors (Fig. 7C). Remarkably, the increase in labeling from glutamine with hypoxia matched the increase in reverse flux to citrate under the same conditions. Overall, these results confirmed the role of glutamine as an important carbon source providing an appreciable anaplerotic flux not only in the oxidative but also in the reductive direction of the TCA cycle, and especially in hypoxia.
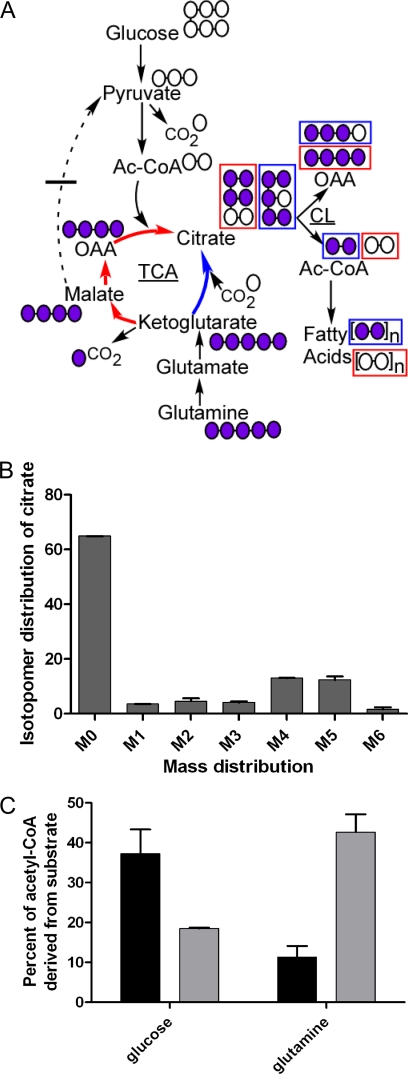
Citrate and fatty acid labeling from [13C]glutamine. A, diagram of the TCA cycle and accessory pathways showing how metabolites are labeled from [U-13C]glutamine depending on the direction of metabolic flux in the cycle. Labeled/unlabeled carbons are coded violet/white. Red boxes indicate labeling of metabolites consequent upon oxidative TCA cycle flux (red arrows). Blue boxes indicate labeling of metabolites consequent upon reductive TCA cycle flux (blue arrows). B, mass profile of citrate following [13C]glutamine labeling of WM35 cells under hypoxia. The x axis shows mass labeling, after correction for 13C natural abundance; y axis percentage of distribution. C, percentage of acetyl units in fatty acids in WM35 under normoxia or hypoxia derived from glucose or glutamine after treatment with the respective 13C substrate. Error bars are range of results obtained from calculated labeling of myristate or palmitate fatty acids. Black bars, normoxia; gray bars, hypoxia.
DISCUSSION
Recent 13C-labeling studies have provided new insights in the seemingly well-understood field of central metabolism. Notable findings have included discovery of reverse flux in pathways generally regarded as unidirectional (31, 35), and new data on utilization of glutamine and other amino acids by cancer cells (36, 37). However, the scope of studies in cancer cells has typically been limited to one or a few cell lines. A comparative approach helps to reveal the most significant metabolic changes potentially associated with a transformed phenotype (15). In the present study we applied this approach to a panel of several melanoma and melanocyte cell lines, and included a multidimensional comparison of metabolite flux distributions in normoxic versus hypoxic growth conditions and (for one of the melanoma lines) [13C]glucose and [13C]glutamine labeling. Although tracking individual metabolites in different cell lines helps to diagnose changes in particular pathways, we found that a global comparison of multiple metabolites allowed us to assess overall metabolic status and the metabolic response characteristic of a subset of cell lines. This type of comparative analysis based on bi-directional clustering (illustrated in Fig. 2) substantially improves the significance of observations that are consistently reproduced in multiple samples. Flux-based signatures of melanoma lines showed a strong correlation with oxygenation conditions. Interestingly, melanocytes did not follow this trend, showing very little difference in flux distribution between hypoxia and normoxia. It suggests that not only are melanoma cells inherently more glycolytic than melanocytes but that they are more capable of adapting their metabolic program to environmental challenges. Generally, utilization of major energy substrates glucose (Fig. 1) or glutamine (Fig. 5) was lower in melanocytes, and glutamine utilization was particularly low under hypoxia (Fig. 5). This could indicate an inability to switch to glutamine for production of TCA metabolites under hypoxia in melanocytes.
Alanine, another end point of glycolysis, has not received the same amount of attention as lactate, the standard marker of glycolytic activity in cancer cells. We found that although melanocytes produced as much alanine as the melanoma cell lines, alanine 13C-labeling was lower in these cells (Fig. 4), indicating less synthesis from glucose (see also supplemental Table S1). The origins of the extra unlabeled alanine in melanocytes requires further investigation, but it is unlikely to originate from glutamine, which is not actively consumed by melanocytes (Fig. 5). Alanine overproduction in cancer cells is typically attributed to the need for excreting excess nitrogen, which results from the use of glutamine as a carbon source (38). Conversion of glutamate to α-ketoglutarate, a committed step in the anaplerotic utilization of glutamine, may proceed via glutamate dehydrogenase or transaminase reactions. The former reaction generates free ammonia, which is not without metabolic consequences, as it was recently shown to induce autophagy in some cancer cell lines (39). Transaminases transfer glutamate nitrogen onto keto-acids, generating α-ketoglutarate and amino acids. Thus, alanine aminotransferase generates alanine from pyruvate. Knockdown of the mitochondrial alanine aminotransferase gene has been shown to reduce growth of HCT116 colon cancer cells, an effect reversed by a cell-permeable derivative of α-ketoglutarate (40). The observed increased production of alanine from glucose in melanoma suggests that this enzyme may strongly contribute to the active utilization of glutamine, demonstrated here by the example of the WM35 line.
Our results show that the TCA cycle was functional in all melanoma cell lines, even under hypoxia (Fig. 4), indicating that melanoma metabolism is not purely glycolytic. Analysis of glucose flux showed that, generally less than 100% of consumed glucose (on average, 93%) was converted to lactate or other glycolytic end point metabolites (Fig. 1C). Due to the energetic inefficiency of glycolysis, oxidation of the remaining 7% glucose via the TCA cycle could generate as much ATP as the glycolytic 93%. However, the relative labeling of TCA cycle intermediates by [13C]glucose typically decreased in hypoxic conditions (Figs. 2 and and4).4). The lowered input from glucose in hypoxia was expected given the known stimulation of pyruvate dehydrogenase kinase via HIF (41, 42), which leads to inhibition of pyruvate dehydrogenase activity restricting flux between glycolysis and the TCA cycle. Labeling of WM35 cells using [13C]glutamine revealed a strong anaplerotic flux from glutamine via α-ketoglutarate into the TCA cycle in normoxia, and this flux further increased under hypoxia (Fig. 6). This shift with hypoxia toward glutamine use in melanoma may be a mechanism to keep the TCA cycle (and therefore ATP production) functioning when entry to the cycle from glycolysis is restricted, but the metabolic advantage of using glutamine rather than glucose as a primary metabolic precursor is unclear. The general importance of glutamine as a substrate for cancer metabolism has been well recognized, but glutamine metabolism in hypoxia has received little study (38). However, as this manuscript was in preparation, the Gottlieb group reported a similar maintenance of TCA cycle activity by a hypoxic colon tumor cell line (43). The fact that we observe such a pronounced anaplerotic contribution to the TCA cycle from glutamine provides a key insight into how this cycle can still function while being uncoupled from glycolysis by the Warburg effect.
An important driver of glutaminolysis in many cancer lines is the c-Myc oncogene, and its expression is important in suppressing senescence in melanoma cell lines with activating BRAF or NRAS mutations (44). The additional effects of c-Myc in cooperating with HIF in the inhibition of pyruvate entry to the TCA cycle have led to the belief that it attenuates mitochondrial respiration under hypoxia (7). However, our results suggest that c-myc expression might simply change the point of entry into the TCA cycle.
Alternate labeling with [13C]glutamine or [13C]glucose also allowed us to observe and assess the relative contribution of a reverse (reductive) flux in the TCA cycle (Fig. 7). Reductive carboxylation between α-ketoglutarate and citrate has been recently identified in various cell types (31–34), but it has been generally overlooked as a direct metabolic route between glutamine, citrate, and fatty acid synthesis (38). Our study for the first time provides evidence of an appreciable contribution of reductive carboxylation to fatty acid synthesis in a human tumor cell line. This contribution appears to be particularly important in hypoxia providing another aspect of the switch to glutamine use. The particular cellular location of this “reverse TCA cycle” flux and the enzymes responsible for the pathway remain to be determined. The initial step of glutamine utilization is driven by glutaminase, which is mitochondrial (45). Subsequent steps, catalyzed by (in order) transaminases or glutamate dehydrogenase; isocitrate dehydrogenase; aconitase, could be performed by either cytosolic or mitochondrial isoforms.
In summary, a multidimensional comparative analysis of metabolites and metabolic fluxes performed in this study allowed us to map unique and common metabolic features of melanoma cell lines. All melanoma lines produced more lactate and consumed more glucose than melanocytes, and also synthesized more alanine from glucose. However, metabolism was not strictly glycolytic, as all melanoma lines maintained TCA cycle activity even under hypoxia. Labeling of WM35 cells with glutamine showed that glutamine was an important anaplerotic substrate for the TCA cycle, especially under hypoxia, but that there was also reverse flux in the TCA cycle feeding from glutamine via α-ketoglutarate to fatty acids. In addition to specific novel findings, this study validated the applied comparative methodology and provided an illustration of how stable isotope labeling can complement conventional metabolomics studies in the examination of metabolism under different conditions.
*This work was supported, in whole or in part, by National Institutes of Health Grants CA-128814 (to Z. A. R.), CA-147978 (to A. D. R.), and CA-154887 (to F. V. F.).
 The on-line version of this article (available at http://www.jbc.org) contains supplemental Tables S1 and S2.
2The abbreviations used are:
- HIF
- hypoxia-inducible factor
- TCA
- tricarboxylic acid
- H3A
- Hermes 3A
- GC-MS
- gas chromatography-mass spectrometry.
REFERENCES
Articles from The Journal of Biological Chemistry are provided here courtesy of American Society for Biochemistry and Molecular Biology
Full text links
Read article at publisher's site: https://doi.org/10.1074/jbc.m111.282046
Read article for free, from open access legal sources, via Unpaywall:
http://www.jbc.org/content/286/49/42626.full.pdf
Citations & impact
Impact metrics
Article citations
Targeting the glutamine-arginine-proline metabolism axis in cancer.
J Enzyme Inhib Med Chem, 39(1):2367129, 25 Jul 2024
Cited by: 0 articles | PMID: 39051546 | PMCID: PMC11275534
Review Free full text in Europe PMC
Therapeutic implications of the metabolic changes associated with BRAF inhibition in melanoma.
Cancer Treat Rev, 129:102795, 28 Jun 2024
Cited by: 0 articles | PMID: 38972133
Review
Targeted Metabolomics of Tissue and Plasma Identifies Biomarkers in Mice with NOTCH1-Dependent T-Cell Acute Lymphoblastic Leukemia.
Int J Mol Sci, 25(12):6543, 13 Jun 2024
Cited by: 0 articles | PMID: 38928249
The PI3K/Akt Pathway and Glucose Metabolism: A Dangerous Liaison in Cancer.
Int J Biol Sci, 20(8):3113-3125, 27 May 2024
Cited by: 4 articles | PMID: 38904014 | PMCID: PMC11186371
Review Free full text in Europe PMC
Metabolism-dependent secondary effect of anti-MAPK cancer therapy on DNA repair.
NAR Cancer, 6(2):zcae019, 30 Apr 2024
Cited by: 0 articles | PMID: 38690580 | PMCID: PMC11059277
Go to all (222) article citations
Data
Data behind the article
This data has been text mined from the article, or deposited into data resources.
BioStudies: supplemental material and supporting data
Similar Articles
To arrive at the top five similar articles we use a word-weighted algorithm to compare words from the Title and Abstract of each citation.
Reverse TCA cycle flux through isocitrate dehydrogenases 1 and 2 is required for lipogenesis in hypoxic melanoma cells.
Pigment Cell Melanoma Res, 25(3):375-383, 27 Mar 2012
Cited by: 113 articles | PMID: 22360810 | PMCID: PMC3329592
Glutamine-fueled mitochondrial metabolism is decoupled from glycolysis in melanoma.
Pigment Cell Melanoma Res, 25(6):732-739, 01 Oct 2012
Cited by: 67 articles | PMID: 22846158 | PMCID: PMC3639292
Review Free full text in Europe PMC
High extracellular lactate causes reductive carboxylation in breast tissue cell lines grown under normoxic conditions.
PLoS One, 14(6):e0213419, 10 Jun 2019
Cited by: 10 articles | PMID: 31181081 | PMCID: PMC6557470
Analysis of Melanoma Cell Glutamine Metabolism by Stable Isotope Tracing and Gas Chromatography-Mass Spectrometry.
Methods Mol Biol, 2265:91-110, 01 Jan 2021
Cited by: 4 articles | PMID: 33704708
Funding
Funders who supported this work.
NCI NIH HHS (9)
Grant ID: K99 CA154887
Grant ID: K99 CA154887-02
Grant ID: R00 CA154887
Grant ID: CA-128814
Grant ID: CA-147978
Grant ID: K99 CA154887-01
Grant ID: P01 CA128814
Grant ID: CA-154887
Grant ID: R21 CA147978
