| PMC full text: | J Immunol. Author manuscript; available in PMC 2015 Apr 1. Published in final edited form as: J Immunol. 2014 Apr 1; 192(7): 3029–3042. Published online 2014 Mar 3. doi: 10.4049/jimmunol.1302911 |
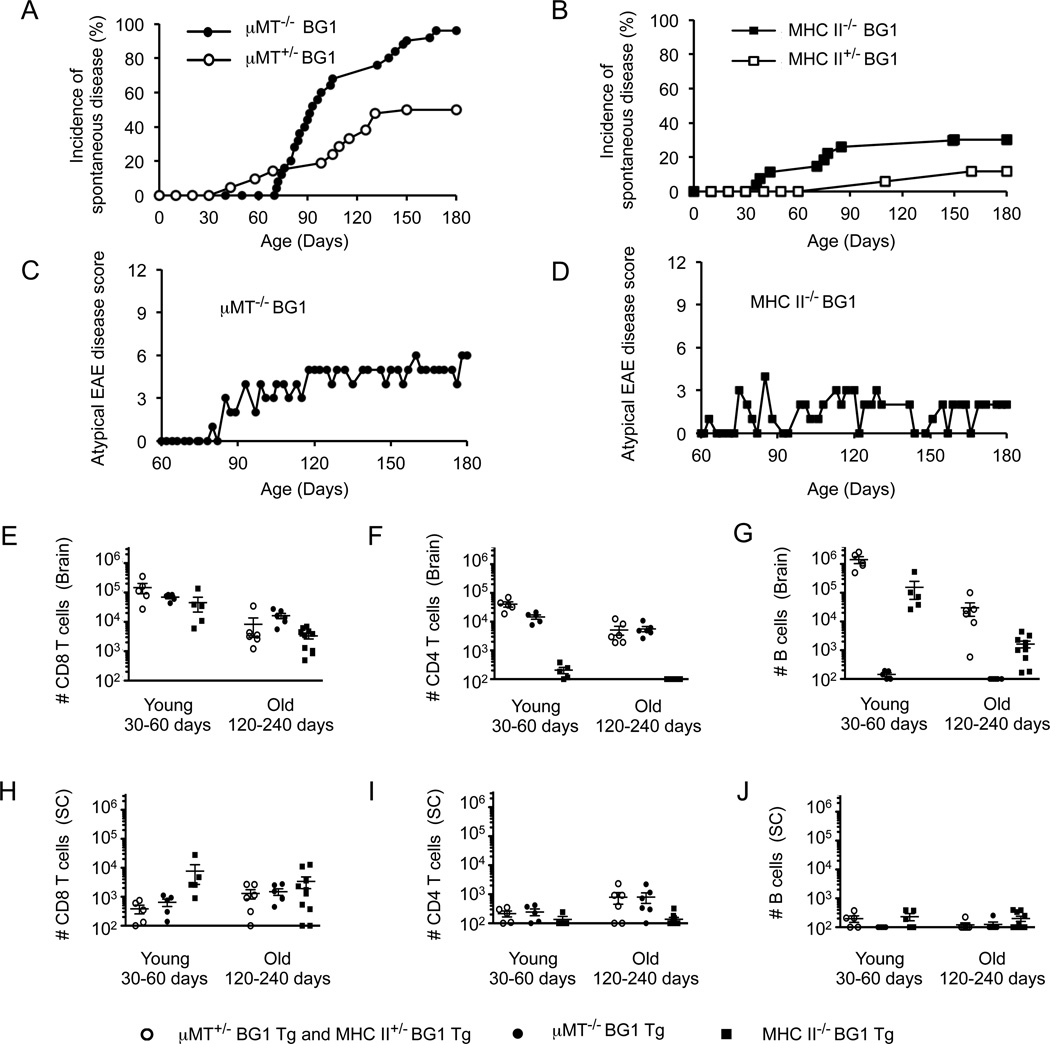
FIGURE 7

B cell-deficient BG1 mice are highly susceptible to chronic atypical EAE-like disease. Incidence of first clinical signs of EAE-like symptoms in (A) µMT−/− BG1 (n = 25) or µMT+/− BG1 (n = 21) and (B) MHC II−/− BG1 (n = 27) or MHC II+/− BG1 (n = 17). (C) Representative examples of clinical disease in µMT−/− BG1 and (D) MHC II−/− BG1 mice. (E–J) Absolute numbers of lymphocytes in the (E–G) brain or (H–J) spinal cord were determined. Each cell population was identified as shown in Fig. 4. Results are from at least five individual mice. Error bars represent SEM.


