| PMC full text: | Published online 2014 Apr 17. doi: 10.1172/JCI70577
|
Figure 1

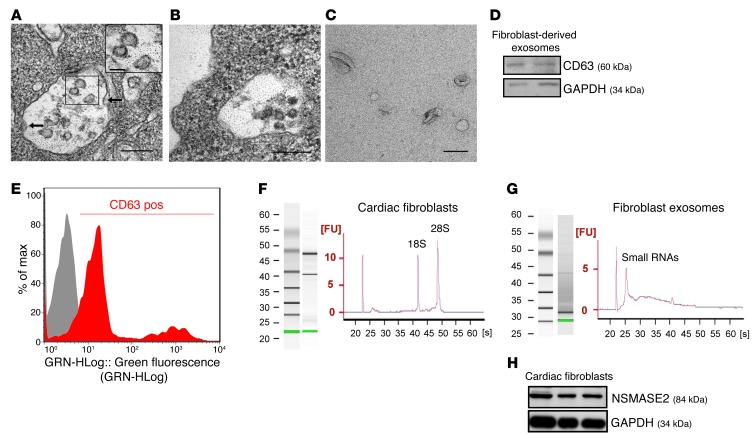
(A and B) Electron microscopy images of rat cardiac fibroblasts. (A) Cytoplasm of rat cardiac fibroblasts with MVB. MVB membrane invaginated inward (arrows), forming intraluminal vesicles (inset: higher magnification of intraluminal vesicles; scale bar: 100 nm). (B) MVB fusing with the cell membrane. (A and B) Scale bar: 200 nm (n = 3). (C) Electron microscopy image of rat cardiac fibroblast–derived exosomes, showing a size of approximately 50 to 100 nm in diameter. Scale bar: 100 nm (n = 4). (D) Western Blot of fibroblast-derived exosomes for CD63 (60 kDa) and GAPDH (34 kDa). (E) Flow cytometry analysis of CD63 of fibroblast-derived exosomes. Fibroblast-derived exosomes were immunostained against CD63 (red curve) and compared with the appropriate isotype control (gray curve). (F and G) Total RNA from (F) rat cardiac fibroblasts and (G) fibroblast-derived exosomes was analyzed by bioanalyzer. Gels and electropherograms are shown. The left gel lane is the ladder standard and the right lane is the total RNA from (F) cardiac fibroblasts or (G) exosomes. Y axis of the electropherogram is the arbitrary fluorescence unit intensity (FU) and x axis is migration time in seconds (s). (H) Western blot analysis of NSMASE2 (84 kDa) and GAPDH (34 kDa) in neonatal rat cardiac fibroblast lysates (n = 3).


