| PMC full text: | Science. Author manuscript; available in PMC 2015 Mar 26. Published in final edited form as: Science. 2014 Sep 26; 345(6204): 1251086. doi: 10.1126/science.1251086 |
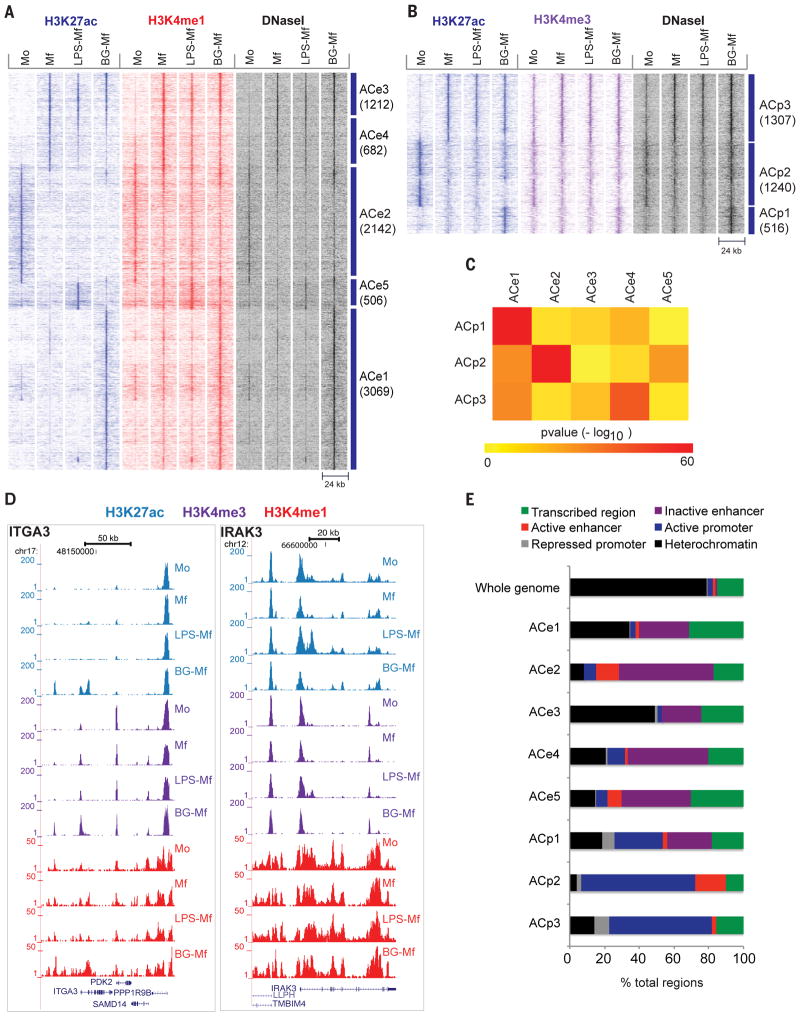
Fig. 2

(A, B) Heat map showing dynamic acetylation marks in enhancers (A) and promoters (B). Dynamic H3K4me regions devoid of H3K27ac are displayed in fig. S2. (C) Heat map of pair-wise overlaps of genes associated with dynamic promoter (ACp) and distal regulatory element (ACe) cluster. P-values (−log10) were obtained by the hypergeometric test, reflecting the probability that the obtained number of shared target genes would be shared by any two equivalent random gene sets. (D) Two representative gene loci corresponding to ITGA3 and IRAK3 that gain H3 lysine modifications in BG-Mf and LPS-Mf, respectively. (E) Epigenetic clusters as assigned by ChromHMM analysis (37) for primary human monocytes. For each cluster, the percentage of elements with the designations heterochromatic (H3K9me3, H3K27me3 or empty), active promoter (H3K4me3), inactive promoter (H3K4me3 and H3K27me3), active regulatory element (H3K4me1 and H3K27ac), inactive regulatory element (H3K4me1) and transcribed segment (H3K36me3), was calculated.


