Abstract
Free full text

Deconstructing transcriptional heterogeneity in pluripotent stem cells
SUMMARY
Pluripotent stem cells (PSCs) are capable of dynamic interconversion between distinct substates, but the regulatory circuits specifying these states and enabling transitions between them are not well understood. We set out to characterize transcriptional heterogeneity in PSCs by single-cell expression profiling under different chemical and genetic perturbations. Signaling factors and developmental regulators show highly variable expression, with expression states for some variable genes heritable through multiple cell divisions. Expression variability and population heterogeneity can be influenced by perturbation of signaling pathways and chromatin regulators. Strikingly, either removal of mature miRNAs or pharmacologic blockage of signaling pathways drives PSCs into a low-noise ground state characterized by a reconfigured pluripotency network, enhanced self-renewal, and a distinct chromatin state, an effect mediated by opposing miRNA families acting on the c-myc / Lin28 / let-7 axis. These data illuminate the nature of transcriptional heterogeneity in PSCs.
INTRODUCTION
PSCs are defined by their unique capacity to differentiate into all the cell types of a organism, while self-renewing in culture. How they reconcile pluripotency and self-renewal and decide among fate choices is a topic of intense interest, with relevance to regenerative medicine and developmental biology. Genomic maps of the regulatory circuitry underlying pluripotency reveal a network of sequence-specific autoregulatory transcription factors (TFs) targeting self-renewal genes that are active in PSCs, as well as repressed lineage-specific developmental regulators that exist in a poised state and are capable of driving cells towards differentiated fates1-5. These core TFs are thought to interact with chromatin modifiers, non-coding RNAs, and external signaling pathways to maintain pluripotency. This self-sustaining transcriptional program becomes reactivated during reprogramming of somatic cells to pluripotency5.
The discoveries that levels of Nanog and other key PSC regulators fluctuate over time, that PSCs exist in multiple interconvertible states, and that distinct subpopulations of PSCs vary in their capacity to self-renew or differentiate, hint at the dynamism of the PSC transcriptional program6-13, which may be fundamental to pluripotency14-23. Here, we apply single-cell analytics to PSCs subjected to a range of perturbations to systematically dissect the factors underlying PSC heterogeneity. By doing so, we map the structure of gene expression variability in PSCs and identify regulatory circuits governing transitions between pluripotent cell states.
The landscape of gene expression variability in PSCs
To gain insight into the distinct substates of pluripotency, we first used single-cell RNA-Seq24, 25 to characterize the transcriptome of 183 individual mouse embryonic stem cells (mESCs) grown under standard culture conditions, in the presence of serum and leukemia inhibitory factor (LIF) (Extended Data Fig. 1, Supplementary Information, and SI Tables 1–3). Most cells (~92%) grouped together by principal component and cluster analysis, while 14 cells (8%) were characterized by reduced expression of fluctuating pluripotency regulators that may indicate a distinct poised state (Extended Data Fig. 2 and Supplementary Information).
Some transcripts were detected in the vast majority of cells examined and showed a log-normal distribution of transcript abundance within the population, as for the core pluripotency regulator Oct4 (Figure 1A). Other transcripts had bimodal expression, present in some cells and absent in others, as for the pluripotency regulator Esrrb (Figure 1A). Another set of genes displayed sporadic expression, being undetected in most cells but exhibiting relatively high expression in several cells, as for the lineage regulator and Polycomb target gene NeuroD1 (Figure 1A, Extended Data Figs. 3–4 and Supplementary Information). Expression distributions for 14 transcripts were validated by single-molecule FISH (Figure 1B, Extended Data Fig. 3). Stable and variable regulators were also identified in neural precursor cells derived from mESCs (Supplementary Information, Extended Data Fig. 4, and SI Table 4), suggesting this may be a general feature of progenitor cell regulatory networks.
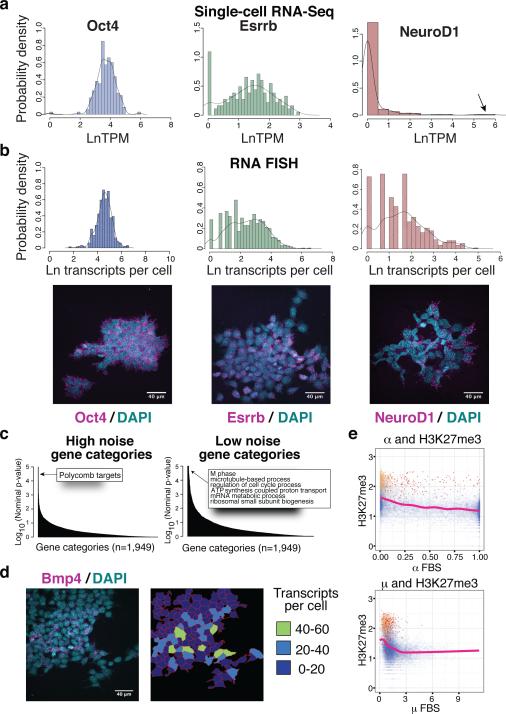
(A) Histograms of transcript distributions from single-cell RNA-Seq of v6.5 mESCs cultured in serum+LIF. Arrow indicates high NeuroD1 expressing cells. (B) Histograms and representative images of transcript distributions for Oct4, Esrrb, and NeuroD1 from single-molecule FISH. (C) Gene categories showing high or low noise. (D) Sporadic expression of the Polycomb target gene Bmp4 within an mESC colony as measured by smFISH. (E) Relationship between population H3K27me3 levels, fraction of cells a gene is detected in (α, top), and average expression level when detected (μ, bottom). Overall trend lines are shown. All relevant statistical information can be found in the ‘Statistics’ section of the Methods.
We examined Gene Ontology (GO) categories for gene sets that showed more uniform or noisier expression in PSCs as compared to control gene sets. Genes involved in housekeeping and metabolic functions displayed relatively uniform expression, while previously identified targets26 of the Polycomb family of epigenetic regulators in PSCs exhibited greater variability (Figure 1C and Extended Data Fig. 4). The Polycomb target genes include many developmental regulators and signaling factors governing lineage specification, and are thought to exist in a repressed yet poised state with a unique chromatin signature in PSCs26, 27.
Certain Polycomb target genes were expressed in some cells at levels comparable to pluripotency regulators, up to 60 transcripts per cell, despite the presence of the repressive H3K27me3 chromatin mark associated with Polycomb activity (Figure 1DExtended Data Fig. 4, and SI Table 5). As expected, Polycomb target genes showed higher average levels of H3K27me3, were detected in a smaller fraction of cells, and were expressed at lower levels than non-Polycomb target genes (Figures 1E). However, within this set of genes, those with detectable expression showed lower average levels of H3K27me3 than those that were not detected (Student's T-Test P-value = 4.82e-5), suggesting that dynamic fluctuations in chromatin state are associated with sporadic expression of certain Polycomb targets in PSCs. This subset of Polycomb target genes may represent regulators governing inital steps in lineage commitment, and may therefore be subject to particularly dynamic regulation in PSCs.
To determine the stability of expression states over rounds of cell division, we seeded individual mESCs onto culture plates, allowed them to form colonies over 3–4 days, and quantified the level of inter- and intra-colony variability for selected genes using smFISH (Figure 2A). Individual colonies showed distinct expression states for Esrrb, with some locked into a high level, some locked into a low level, and others that displayed mixed expression suggesting a sudden switching between high and low states during the process of colony formation (Figure 2B). Other pluripotency regulators, including Nanog, Nr0b1, and c-myc, as well as lineage regulators and Polycomb targets NeuroD1, Otx2, Olig2, and Pax6, also exhibited high inter-colony variability suggestive of slow fluctuations in expression states (Figure 2C). As clusters of neighboring cells or entire colonies tended to be in similar expression states (Extended Data Fig. 5), we estimate that transitions between transcriptional states for these variable regulators occurs relatively infrequently with respect to the ES cell cycle, happening on the order of one to a few days, in line with measurements of Nanog transcriptional fluctuations6, 9, 28. To confirm that ‘variable expression’ colonies were clonally derived, we performed time-lapse imaging to monitor colony formation over four days. Individual colonies formed from single cells showed substantial differences in growth rate and bimodal Nr0b1 expression (Figure 2D), validating our approach and highlighting the pronounced variability and persistence of growth rate, morphology, and expression state of mESCs grown in serum+LIF (serum+LIF mESCs). This expression state persistence extended to the protein level (Figure 2E and Extended Data Fig. 5), indicating that slow fluctuations in expression of certain pluripotency regulators might underlie distinct phenotypic responses of individual mESCs to external stimuli29.
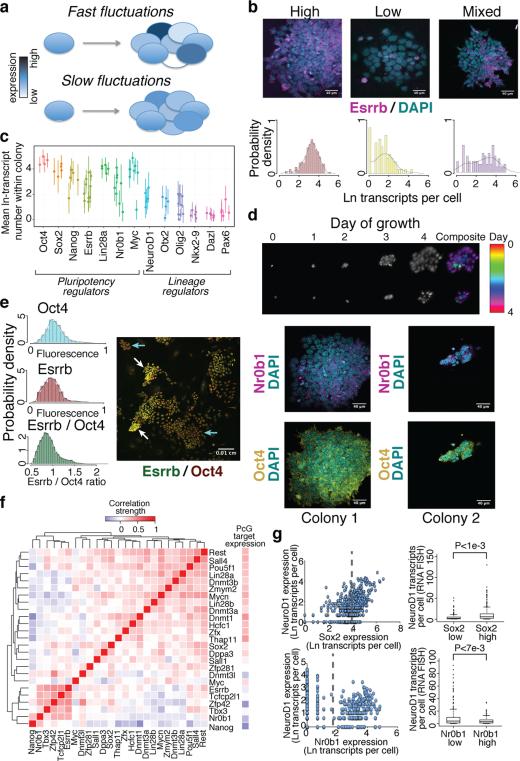
(A) Slowly fluctuating genes show a high degree of intercolony variability. (B) Expression of the pluripotency regulator Esrrb within individual colonies. (C) Intra- and inter-colony variability in expression for selected pluripotency and lineage regulators. Average transcript number and standard deviation within colonies are indicated. (D) Time-lapse imaging of colony formation from single cells, and Nr0b1 and Oct4 expression within these colonies. (E) Relative Oct4 and Esrrb protein levels within mESCs cultured in serum+LIF. Groups of high and low Esrrb cells are indicated. (F) Correlation of pluripotency regulator polycomb target gene expression between individual cells. (G) Dependence of NeuroD1 expression on the level of Sox2 and Nr0b1 within individual cells. Dashed lines indicate high and low expression states, and P-values for differences between states were calculated using the Kolmogorov-Smirnov test.
Clustering of pluripotency regulators revealed that they partitioned into several co-expressed modules, with some modules positively correlated with Polycomb target expression and others negatively correlated (Figure 2F and Extended Data Fig. 5). Nanog, Nr0b1 (Dax1), and Zfp42 (Rex1) were among those showing the strongest negative correlation with Polycomb target gene expression. To test these associations, we examined the dependence of selected Polycomb target genes on individual pluripotency regulators by two-color FISH (Figure 2G and Extended Data Fig. 5). Consistent with the RNA-Seq data, NeuroD1 was more likely to be expressed at high levels in cells expressing high levels of Sox2 (which also functions to specify the neural lineage) and low levels of Nr0b1, while Bmp4 expression was positively associated with Esrrb and Otx2 expression was negatively associated with Nanog. Notably, the eight percent of cells separated from the main population by principal component analysis tended to be in low expression states for Nr0b1, Nanog, and Zfp42, and showed higher Polycomb target gene expression than did the majority of cells (Extended Data Fig. 2), suggesting that the RNA-Seq-detected correlations reflect biologically meaningful states in which pluripotency factor expression influences the probability of lineage regulator expression.
Perturbing regulatory pathways influences PSC heterogeneity and cell state
To better understand the factors governing PSC heterogeneity, we examined mPSCs cultured under different growth conditions13, treated with chemical inhibitors of epigenetic regulators, genetically modified to lack particular regulators30-34, or in different states of pluripotency35 (Extended Data Table 1, SI Table 6, and Extended Data Fig. 6). While unimodally expressed genes such as Oct4 and Rest remained relatively invariant across a range of perturbations, the distributions of bimodally expressed genes such as c-myc and Tcfcp2L1 shifted markedly in response to particular perturbations (Figure 3A). Strikingly, both culturing mESCs in 2i+LIF conditions13 and impairing miRNA production30, 34 resulted in more uniform gene expression across 15 pluripotency regulators examined by single-cell QPCR, while knocking out PRC2 function through loss of the Polycomb-group (PcG) protein Eed31 resulted in greater population heterogeneity across all genes measured (Figure 3B).
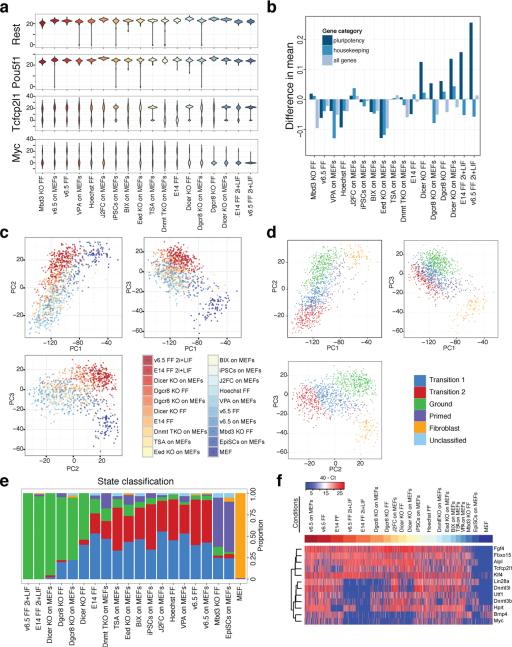
(A) Population distributions for the unimodally expressed genes Pou5f1 (Oct4) and Rest, and the bimodally expressed genes Tcfcp2l1 and Myc. (B) Comparison of population heterogeneity as measured by mean intra-condition distances. (C) Principal component analysis (PCA) of single-cell qPCR data. (D) PCA colored by the most likely state classification. (E) Cell state classification of PSCs exposed to different perturbations and conditions. (F) Expression heatmap of genes contributing the most to the top three principal components, excluding housekeeping and fibroblast genes.
We next performed principal component analysis on the single-cell QPCR data and applied an automated classification algorithm to assign cells to discrete states (Figure 3C–3E and Extended Data Fig. 6). Surprisingly, a large fraction of both Dgcr8−/− and Dicer knockout mESCs, which lack mature miRNAs due to loss-of-function of separate miRNA processing factors30, 36, were assigned to the ground state suggesting that blocking external signaling pathways and removing miRNAs from PSCs results in common modes of self-renewal (Figure 3E). PSCs in most other conditions were predominantly classified as a distinct state, which we term the ‘transition state,’ as it is primarily associated with cells cultured under serum+LIF conditions and a higher probability of spontaneous differentiation. Epiblast stem cells (EpiSCs) were assigned to a separate state we term ‘primed,’ in keeping with the view of these cells as more developmentally advanced35. Genes contributing the most to the principal components that distinguished Dgcr8−/− and Dicer knockout mESCs in serum+LIF and wt mESCs in 2i+LIF from mESCs in other conditions included c-myc, Lin28a, Bmp4, Dnmt3b and Dnmt3l, all of which showed sharply reduced expression in ground state cells (Figure 3F). Our perturbation analysis therefore implicates miRNAs as key mediators of the transition and primed states, with their absence mimicking the inhibition of the Erk and GSK3 signaling pathways observed in 2i culture.
2i and microRNA deficiency promote ground state self-renewal
To further investigate the apparent similarity between wild-type mESCs cultured in 2i+LIF conditions (2i+LIF mESCs) and Dgcr8−/− mESCs cultured in serum+LIF (Dgcr8−/− mESCs), we performed single-cell RNA-Seq on mESCs from each condition (SI Tables 2 and 7–9). Gene expression changes between serum+LIF and 2i+LIF mESCs were highly correlated with changes between serum+LIF mESCs and Dgcr8−/− mESCs (Figure 4A, Extended Data Fig. 7). As a population, 2i+LIF mESCs showed reduced heterogeneity as compared serum+LIF mESCs, in keeping with the notion that inhibiting Erk and GSK3 signaling drives mouse PSCs into a low-noise ground state20, 28, 37 (Figure 4B and Extended Data Fig. 7). By contrast, Dgcr8−/− mESCs displayed increased heterogeneity, consistent with a role for miRNAs in buffering gene expression noise38. When compared across conditions, however, individual Dgcr8−/− mESCs were more similar to 2i+LIF than serum+LIF mESCs, supporting a model in which removal of miRNAs drives a portion of Dgcr8−/− mESCs towards the ground state, and results in a similar phenotype to that produced by Erk and GSK3 inhibition.
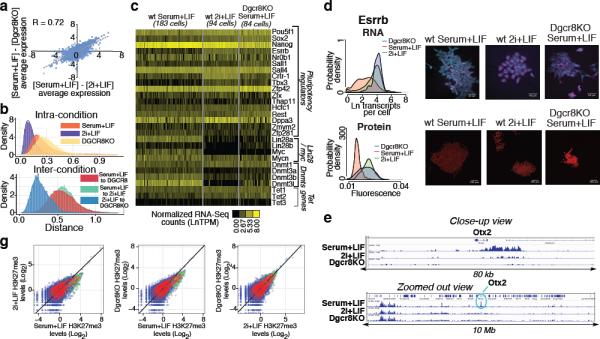
(A) Correlation between single-cell RNA-Seq gene expression changes in different conditions. (B) Distances between individual cells for pluripotency regulators shown in panel C. (C) Heat map of single-cell RNA-Seq data for selected pluripotency regulators. (D, E) Single-molecule FISH (D) and quantitative immunofluorescence (E) showing a shift towards the high expression state of Esrrb in 2i+LIF and Dgcr8KO mESCs. (F) Promoter H3K27me3 levels in the three conditions examined by single-cell RNA-Seq. Polycomb target genes are shown in green. (H) H3K27me3 ChIP-Seq tracks from the three conditions profiled showing the selective loss of H3K27me3 at the Otx2 promoter in Dgcr8KO and 2i+LIF mESCs.
While some pluripotency regulators such as Esrrb and Tbx3 increased in expression in 2i+LIF and Dgcr8−/− mESCs, other factors traditionally associated with pluripotency (e.g. c-myc and Lin28a) showed a sharp reduction in expression under both conditions (Figure 4C). DNA methyltransferases Dnmt3a, Dnmt3b, and Dnmt3l showed reduced expression in both 2i+LIF and Dgcr8−/− mESCs, suggesting that miRNA activity may be linked to the reduction in DNA methylation observed in the naïve pluripotent state28, 39. Regulators displaying bimodal expression patterns in serum+LIF mESCs showed altered distributions in both 2i+LIF and Dgcr8−/− mESCs. Expression was confirmed by smFISH and quantitative immunofluorescence, and was recapitulated in an independent mESC line (Figure 4D and Extended Data Fig. 7). Thus, the pluripotency regulatory network adopts distinct configurations in the ground and transition states.
mESCs cultured in 2i+LIF exhibit a unique chromatin state characterized by lower levels of H3K27me3 at promoters and increased amounts of transcriptional pausing40. Both culture in 2i+LIF and removal of mature miRNAs resulted in a reduction in H3K27me3 at promoters (Figures 4E–4F, Extended Data Fig. 8, and SI Table 5). Therefore, Dgcr8−/− mESCs manifest features of ground-state self-renewal including altered gene expression, a reconfigured pluripotency regulatory network, increased expression of Polycomb target genes, and a common chromatin state.
miRNA balance and cell state
We profiled miRNA expression in two mESC lines cultured under both serum+LIF and 2i+LIF conditions, and mouse embryonic fibroblasts (MEFs) cultured under standard conditions (SI Table 10). Surprisingly, while levels of ES cell-specific cell cycle regulating (ESCC) miRNAs36, which are known to be expressed at high levels in PSCs, remained elevated in both serum+LIF and 2i+LIF growth conditions, let-7 family members and miR-152, which act as tumor suppressors and are typically associated with differentiated cells41-43, were expressed at higher levels in 2i+LIF as compared to serum+LIF culture (Figure 5A and Extended Data Fig. 9).
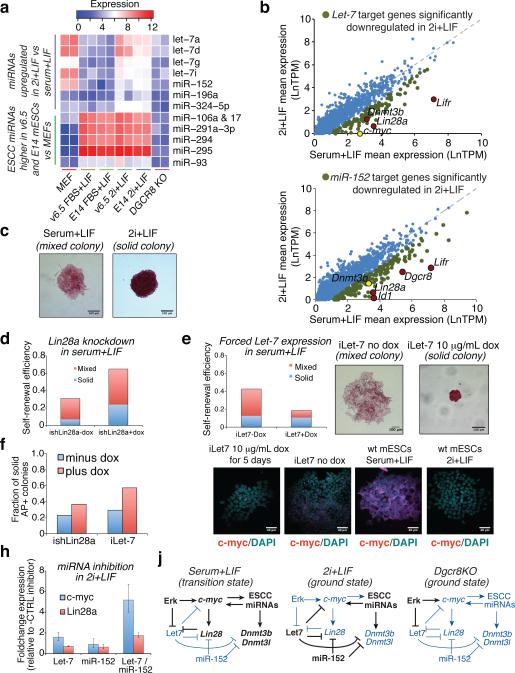
(A) NanoString profiling of miRNAs expressed in mESCs or MEFs. (B) Expression changes of predicted let-7 or miR-152 target genes between conditions. (C) Representative colonies showing solid or mixed alkaline phosphatase (AP) staining. (D, E) Self-renewal efficiency of mESCs bearing a dox-inducible Lin28a shRNA construct (D) or dox-inducible let-7 (E) in the presence or absence of doxycycline. Mean values from two replicate experiments are shown. c-myc expression levels for representative iLet-7 colonies as measured by smFISH are shown in (E). (F) Fraction of uniformly AP positive colonies in experiments shown in Figures 5D and 5E. (G) Expression changes in c-myc and Lin28a induced by transfection of miRNA inhibitors into wild-type mESCs cultured in 2i+LIF. Error bars indicate standard deviations between triplicate transfection experiments. (H) Model for interplay between Erk signaling, miRNAs, and c-myc / Lin28 / let-7 axis in ground and transition states.
Prevailing models which posit that the ESCC and let-7 miRNA families are opposing classes of miRNAs that act in self-reinforcing loops to stabilize self-renewing and differentiated states44 run contrary to our observed co-expression of ESCC and let-7 miRNAs in 2i+LIF mESCs. Analyzing our own and published data40, we found that targets of let-7 showed significantly lower expression as a group in 2i+LIF as compared to serum+LIF mESCs (p = 1.4e-5, Mann-Whitney test), as did miR-152 predicted targets (p = 0.005), suggesting that these miRNAs function to repress a set of target genes under ground-state conditions (SI Table 9). Genes targeted by either or both let-7 and miR-152 that were downregulated in 2i+LIF as compared to serum+LIF included c-myc, Lin28a and Lin28b, and Dnmt3b (Figure 5B). Furthermore, predicted let-7 and miR-152 targets were more highly correlated in expression at a single-cell level in 2i+LIF as compared to non-target genes (Supplementary Information), suggesting that these genes and miRs comprise a distinct regulatory module.
Enforced expression of ESCC miRNAs can correct cell cycle defects of Dgcr8−/− mESCs, promote rapid proliferation of these cells, suppress inhibitors of the G1-S transition, and upregulate genes including c-myc and Lin2836, 44. Transfection of the prototypical ESCC miRNA miR-294 into Dgcr8−/− mESCs has been shown to upregulate c-myc, Lin28, Dnmt3b, and Dnmt3l44, which are let-7/miR-152 target genes suppressed in the ground state (Extended Data Fig. 9). This opposing effect of ESCC and let-7 miRNAs on a common set of targets suggests a role for let-7 during differentiation, where it acts to repress pluripotency factors sustained by ESCC miRNAs in stem cells44. However, despite the continued high expression of ESCC miRNAs in 2i, their targets showed elevated expression as a class in 2i as compared to serum (p-value = 6.412e-09, Mann-Whitney test, Extended Data Fig. 9), whereas let-7 and miR-152 targets were down-regulated in 2i. These findings suggest that enforced expression of ESCC miRNAs elevates Dgcr8−/− mESCs out of ground-state self-renewal through indirect modulation of the c-myc / Lin28 / let-7 axis, and that in 2i let-7 and miR-152 oppose this effect of ESCC miRNAs through direct repression of a set of target genes including c-myc, Lin28, Dnmt3b, and Dnmt3l.
Both 2i+LIF and Dgcr8−/− mESCs give rise predominantly to compact colonies uniformly positive for alkaline phosphatase (AP) staining, as compared to serum+LIF mESCs which have a greater tendency to form larger colonies that are mixed for AP staining (Figure 5C). Compact, uniformly AP positive colonies formed in serum+LIF culture displayed lower levels of c-myc expression than did AP mixed and negative colonies (Extended Data Fig. 9). We independently knocked down Lin28a expression in serum+LIF mESCs, and forced let-7 expression in doxycycline-inducible ilet-7 mESCs grown in serum+LIF45. Lin28a blocks processing of let7 precursor miRNAs into their mature form, and knockdown of lin28a in mESCs grown in serum+LIF results in increased let7 levels, increased colony-forming efficiency, and a higher proportion of smaller, uniformly AP positive colonies (Figure 5D and Extended Data Fig. 9). Sustained expression of let-7 in serum+LIF culture using the inducible system resulted in a higher proportion of smaller, uniformly AP positive colonies that showed lower levels of c-myc expression (Figure 5E–F and Extended Data Fig. 9), suggesting that let-7 is capable of activating a positive feedback circuit that stabilizes ground state self-renewal. Acute inhibition of let-7 family members and miR-152 in wild-type mESCs cultured in 2i+LIF resulted in upregulation of c-myc and Lin28a (Figure 5G), further supporting the notion that these two miRNAs act in concert to maintain the ground state.
We tested the effect of reintroducing miRNAs into Dgcr8−/− mESCs on their self-renewal to see if ESCC-mediated elevation into the transition state could be counterbalanced by let-7. Transfection of stable mimics of let7 resulted in sharply reduced self-renewal efficiency compared to controls, and transfection of mimics of the ESCC miRNA miR-294 also resulted in reduced self-renewal (Extended Data Fig. 9). Co-transfection of both miRNA family members together, however, resulted in higher self-renewal efficiency than did introduction of either family member alone. These results support a model in which expression of ESCC miRNAs alone drive PSCs into a transition state with a relatively high probability of spontaneous differentiation through indirect activation of c-myc and Lin28a, while expression of let-7 miRNAs alone can drive differentiation. However, expression of a balance of ESCC miRNAs along with the opposing families let-7 and miR-148/152, or neither as in the case of Dgcr8−/− mESCs, results in ground state self-renewal through either direct repression of c-myc and Lin28a by let-7 and miR-148/152, or removal of the activating force of ESCC miRNAs (Figure 5H).
CONCLUSION
The diverse range of conditions under which pluripotency can be induced or maintained has been accompanied by reports of molecular and functional variation. Here we analyzed the dynamic transcriptional landscape of pluripotent stem cells subject to a number of chemical and genetic perturbations. Applying single-cell analytics, we gleaned a number of essential lessons. We found that different classes of genes manifest high or low expression variability in PSCs, with house-keeping and metabolic gene sets showing consistent expression across individual cells, while genes involved in signaling pathways and development were considerably more variable. Moreover, expression states of variable regulatory factors were coupled together, implying the presence of a regulated biological network. Analysis of chemical and genetic perturbations led to the discovery that depletion of miRNAs mimicked the transcriptional ground state of pluripotency routinely induced by culture in 2i+LIF, conditions that block the dominant ERK and GSK3 signaling pathways that converge on the c-myc / Lin28 / let-7 axis. Our data shed light on the transcriptional dynamics of the pluripotent state at the single cell level, and demonstrate how regulation of gene expression variation relates directly to the transition between pluripotency and differentiation. Transcriptional heterogeneity is increasingly being recognized as a key component of many biological processes.46-48 It will be of interest to map stable and flexible regulatory nodes in networks governing other progenitor and differentiated cell types to discern common principles underlying network architecture and gene expression variability.
Extended Data
Extended Data Figure 1
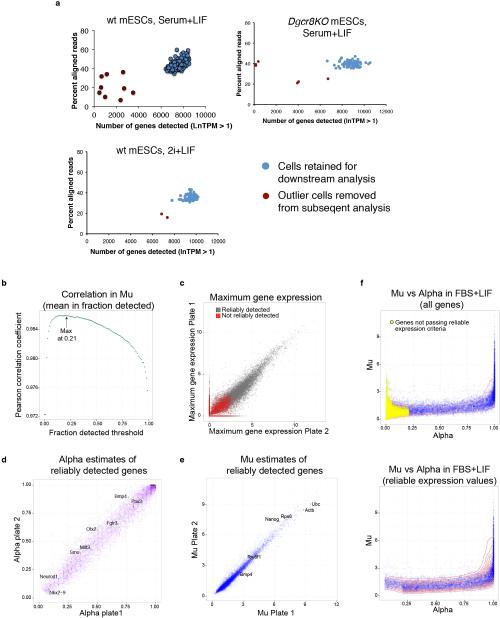
(A) A combination of read alignment rate (y-axis) and number of genes detected (lnTPM > 1) (x-axis) was used to identify outlier cells (red circles) to remove from subsequent analysis, leaving 183 single mESCs cultured in serum+LIF, 94 mESCs cultured in 2i+LIF, and 84 Dgcr8KO mESCs cultured in serum+LIF that were analyzed by single-cell RNA-Seq in this study (blue circles). (B) Correlation in mean expression in detected cells (Mu) between replicate FBS+LIF plates across a range of alpha thresholds. Mu was calculated separately for each plate. Correlations in mu were calculated after limiting genes to those with alphas exceeding the specified threshold on the x-axis. (C) Maximum gene expression in replicate plates. Genes not reliably detected as defined in the text are colored red. (D) Comparison of alpha estimates in replicate plates, limited to reliably detected genes. Selected lineage regulators are denoted. (E) Comparison of Mu estimates in replicate plates, limited to reliably detected genes. Selected housekeeping, pluripotency, and signaling genes are denoted. (F) (Top) Relationship between estimates of alpha (x-axis) and mu (y-axis) of all genes based on both plates of mESC in FBS+LIF. Undetected genes are colored yellow. (Bottom) Same as above except only showing reliably detected genes, and overlaid with density contour (red lines).
Extended Data Figure 2
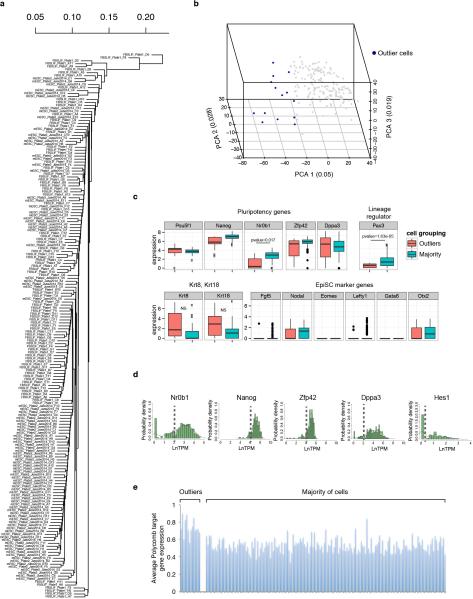
(A) Hierarchical clustering dendogram of single-cell RNA-Seq data for 183 mESCs cultured in serum+LIF. (B) Principal component analysis of the 183 mESCs cultured in serum+LIF.. Points colored blue are those with PCA1 values < −25, which are classified as outlier cells. (C) Boxplots of expression of selected pluripotency regulators and the lineage regulator Pax3 (top), and genes associated with EpiSCs (bottom). ‘Normal’ indicates the majority of cells colored as grey dots in ED Figure 2B, and ‘Outliers’ indicates the distinct set of 14 cells colored blue in ED Figure 2B. P-values for statistically significant differences are shown. (D) Histograms showing the expression distributions of pluripotency regulators previously found to fluctuate within mESC populations. Cutoffs to divide expression into high and low states to test for enrichment within outlier cells are indicated by dashed lines. (E) Average expression of Polycomb target genes within outlier cells (left), and the majority of the mESCs cultured in serum+LIF (right).
Extended Data Figure 3
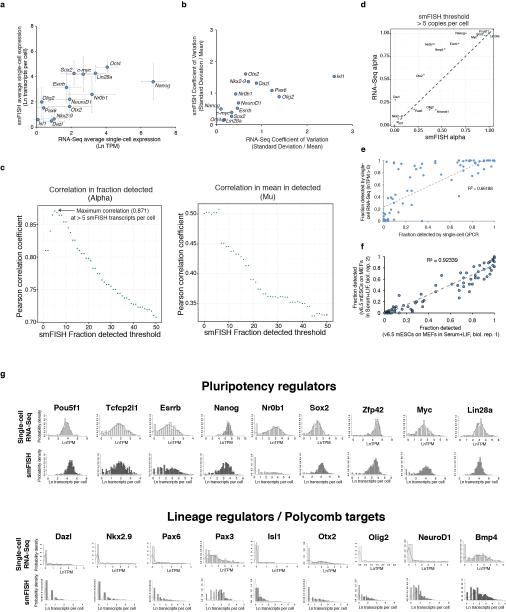
(A) Correlation between transcripts per million (TPM) measured by single-cell RNA-Seq and transcripts per cell measured by single-molecule FISH for 14 selected genes in mESCs cultured in serum+LIF. Error bars represent standard deviations of measurements. (B) Correlation between coefficients of variation measured by single-cell RNA-Seq and FISH for the 14 genes shown in (A). (C) Correlation coefficients for α (fraction detected, left) or μ (mean expression in detected cells, right) between single-molecule FISH and single-cell RNA-Seq are plotted as a function of varying the threshold level for detection by RNA FISH (x-axis). An RNA FISH detection threshold of 10 indicates that genes expressed at < 10 copies per cell would not be detected by RNA FISH. Correlation for α between RNA-Seq and RNA FISH peaked at an RNA FISH detection threshold of > 5 transcripts per cell, giving an estimated single-cell RNA-Seq detection efficiency of ~20% (1 out of 5 transcripts detected, assuming single-molecule sensitivity for the RNA FISH method). (D) Correlation in α between single-cell RNA-Seq and single-molecule FISH for 14 genes measured by both methods, assuming a single-molecule FISH detection threshold of > 5 transcripts per cell. Dashed line shows linear fit to the data. The fraction of cells a gene is detected in shows good agreement between the two methods when taking the sensitivity of the RNA-Seq into account. (E) Comparison of the fraction of mESCs cultured in serum+LIF a gene was detected in by single-cell qPCR (x-axis) or single-cell RNA-Seq (y-axis). Single-cell RNA-Seq showed greater sensitivity overall as compared to single-cell qPCR, but a set of genes was sporadically expressed as measured by both methods. Trendline indicates linear fit to the data. (F) Correlations of fraction detected between independent biological replicates for 96 genes profiled by single-cell QPCR. Trendline shows linear fit to the data, and indicates that the fraction of cells a gene is detected in remains consistent across independent biological replicates. (G) Comparison of expression distributions measured by single-cell RNA-Seq (light grey) and single-molecule FISH (darker grey) for pluripotency regulators (top) and Polycomb target genes (bottom).
Extended Data Figure 4
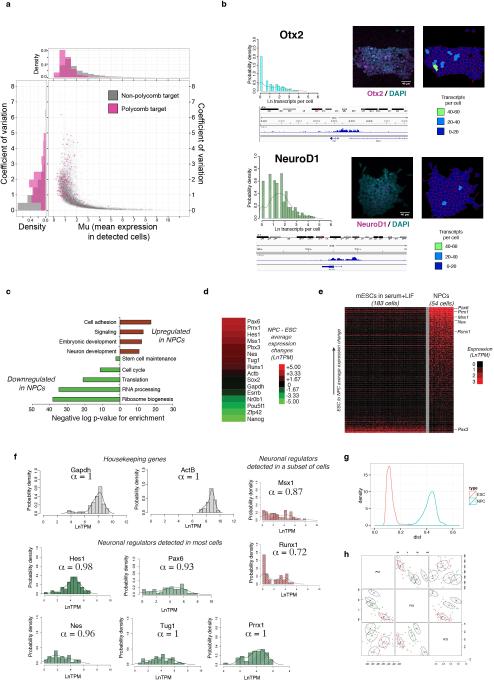
(A) Polycomb target genes show highly variable expression in mESCs. Relationship between μ (mean expression in detected cells, x-axis) and coefficient of variation (standard deviation normalized by mean expression in all cells, y-axis) is shown for Polycomb target genes (purple) and non-Polycomb target genes (grey). Distributions for μ and coefficients of variation for the two gene sets are shown above and to the left of the graph, respectively. Polycomb target genes show pronounced variability in expression, even when controlling for expression level. (B) Expression of the neural regulators and Polycomb target genes Otx2 (top) and NeuroD1 (bottom) measured by RNA FISH in mESCs cultured in serum+LIF. (left). Overall distributions within the population and representative colonies are shown, along with gene tracks from IGV showing ChIP-Seq reads for H3K27me3 at the Otx2 and NeuroD1 genes. (C) Enriched gene ontology categories among genes significantly upregulated (red) or downregulated (green) in neural precursor cells as compared to embryonic stem cells. (D) Expression changes of selected genes in neural precursor cells as compared to the embryonic stem cells they were derived from. As expected, neural regulators and ES Polycomb target genes Pax6, Prrx1, Hes1, Msx1, Pbx3, Nes, and Runx1 were upregulated in NPCs, while the pluripotency regulators Esrrb, Nr0b1, Pou5f1 (Oct4), Zfp42 (Rex1), and Nanog were downregulated. Expression of the housekeeping genes Gapdh and Actb, and the pluripotency and neural regulator Sox2, were relatively unchanged between the two cell types. (E) Expression comparison of ES Polycomb target genes that are detected in either mESCs or NPCs. Many Polycomb target genes that are neuronal regulators are detected in a higher fraction of NPCs than ESCs, while certain Polycomb targets such as Pax3 (a regulator of musculosketal development) are detected in a smaller fraction of cells. Genes are ordered in ascending order of ESC to NPC average expression change. (F) Histograms showing distributions of expression levels for selected housekeeping genes (left) and neuronal regulators (center and right) in NPCs. The neuronal regulators Msx1 and Runx1 show bimodal expression in NPCs. (G) Distance distributions within ESC (red) and NPC (blue) populations. NPCs show more population heterogeneity than ESCs. (H) State classification based on principal component analysis of single-cell RNA-Seq of NPCs. Four distinct states are identified.
Extended Data Figure 5
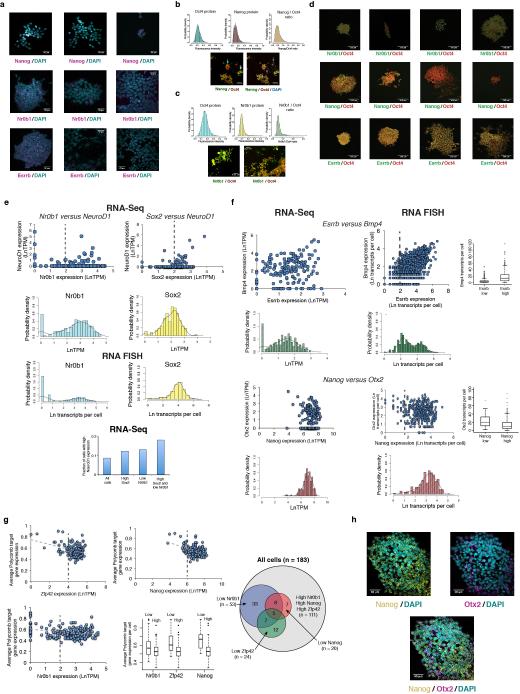
(A) RNA FISH images showing expression of Nanog (top), Nr0b1 (middle), and Esrrb (bottom) in individual colonies or regions of cells. (B, C) Histograms show distributions of fluorescence intensities within individual cells from quantitative immunofluorescence of Oct4 and (B) Nanog, or (C) Nr0b1, along with Nanog / Oct4 or Nr0b1 / Oct4 ratios as indicated. For Nanog / Oct4 images (B), Nanog staining is colored green while Oct4 staining is colored red. In the panel on the left a cluster of low Nanog cells is indicated by a blue arrow, while a cluster of high Nanog cells is indicated by a white arrow. In the panel on the right, the same image is shown with DAPI staining colored blue, and groups of Oct4 negative / Nanog negative differentiated cells that may have arisen from the low Nanog cells are indicated with gray arrows. For Nr0b1 / Oct4 images (C), Nr0b1 is colored green while Oct4 staining is colored red. A relatively high Nr0b1 colony is shown in the panel on the left, while a region of low Nr0b1 cells is displayed in the panel on the right. (D) Quantitative immunofluorescence images showing expression of Oct4 (red) and Nr0b1 (top row), Nanog (middle row), or Esrrb (bottom row) within individual colonies of mESCs grown in serum+LIF. Oct4 is used as an internal reference as it shows relatively invariant expression within mESCs. (E) Single-cell RNA-Seq relationships for gene pairs shown in Figure 2G. Distributions of gene expression from RNA-Seq and RNA FISH experiments are shown. Dashed lines indicate divisions between high and low states for box plot shown in Figure 2G. Single-cell RNA-Seq data shows that the subset of cells in both a high Sox2 and low Nr0b1 state show an increased probability of expressing NeuroD1 (LnTPM >1) as compared to all cells (bottom). (F) RNA-Seq (left) and RNA FISH (right) correlations between the pluripotency regulator Esrrb and the signaling factor Bmp4 (top) and the pluripotency regulator Nanog and the neural regulator Otx2 (bottom). Dashed lines indicate divisions between high and low states for the box plots shown on the right. (G) Correlations from single-cell RNA-Seq data between average Polycomb target gene expression and Zfp42 (Rex1), Nanog, and Nr0b1 (Dax1). Dashed lines indicate divisions between high and low states for the box plot comparing Polycomb target expression with expression of the three regulators, which are all negatively associated with expression of Polycomb targets. The Venn diagram shows coupling between high and low states of the three regulators. Low Nr0b1 cells are more likely to be in a low Zfp42 and/or low Nanog state as compared to high Nr0b1 cells, suggesting that Nr0b1 functions to maintain Zfp42 and Nanog expression and repress Polycomb target genes. (H) RNA FISH images of an ESC colony hybridized with probes against Nanog (yellow) and Otx2 (magenta), showing inverse relationship between Nanog and Otx2 expression.
Extended Data Figure 6
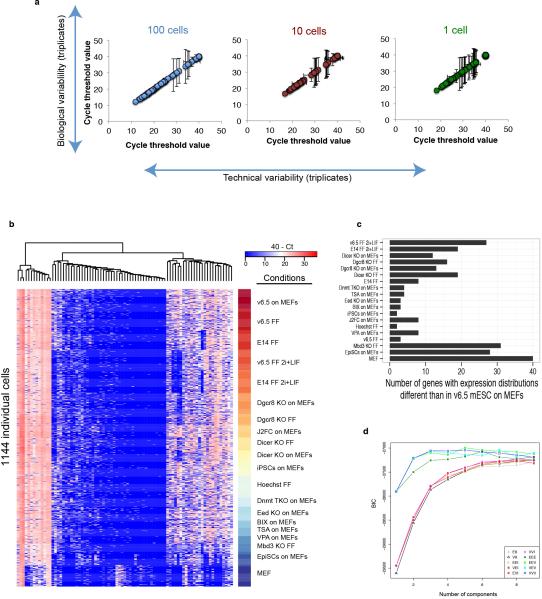
(A) Shown are the average Ct values and standard deviations for technical triplicates (error bars on x-axis) or biological triplicates (error bars on y-axis) across 96 genes for pools of 100 or 10 cells or single sorted cells. Cells were sorted into PCR strips containing RT-PCR reagents and primer pools, reverse transcription and pre-amplification was performed, and cDNA was quantified on a Fluidigm BioMark PCR system. (B) Heat map of single-cell qPCR data for 84 genes examined across 19 different PSC perturbations and in MEFs (n = 1,144 single cells). Unsupervised hierarchical clustering grouped genes into three clusters: bimodally-expressed genes (right group), ubiquitously-expressed genes (left group), and sporadically-expressed genes (middle group). (C) Numbers of genes showing significant changes in expression distributions as compared to the reference conditions of v6.5 mESCs cultured in serum+LIF on MEFs. Significance of changes was determined by the two-sample Kolmogorov-Smirnov test, correcting P-values for multiple tests using the Holm method. (D) Selection of the state classification model that maximizes the Bayesian Information Criteria (BIC, y-axis). Mclust was used to generate multivariate Gaussian mixture models of the first three principal components of the Fluidigm qPCR-based expression values of individual mESCs. The models vary in the number of components (one to ten) and the following geometric characteristics: volume, shape, and orientation as described49. The best model was used to classify cells into states.
Extended Data Figure 7
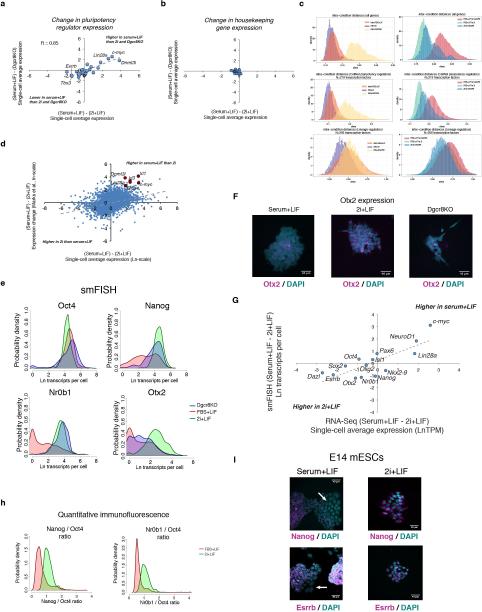
(A) Changes in expression of the pluripotency regulators shown in Figure 4C going from serum+LIF to 2i+LIF culture (x-axis), or between wild-type and Dgcr8KO cells cultured in serum+LIF (y-axis), as measured by single-cell RNA-Seq. Selected genes are highlighted. (B) Changes in expression of 18 commonly used housekeeping genes (ActB, Aip, Cxxc1, Gapdh, Gusb, Hmbs, Hprt, Ipo8, Mrpl48, Mtcp1, Pgk1, Ppia, Rpl13a, Rplp2, Rps6, Tbp, Ubc, and Ywhaz) between the same conditions as in A. (C) Intra- (left) and inter- (right) condition distances between individual cells based on single-cell RNA-Seq data for all genes (top), 219 transcription factors that regulate pluripotent cells as determined by CellNet50 (middle), or lineage regulators, defined as the 256 previously determined Polycomb target genes in mESCs that are transcription factors (bottom). (D) Comparison of single-cell average expression changes going from serum+LIF to 2i+LIF culture in the present study (x-axis) against population-level expression changes between mESCs cultured in serum+LIF versus 2i+LIF measured by Marks et al.40 (y-axis). Trendline from linear fit to the data is shown, and selected genes that show lower expression in 2i+LIF culture in both studies are highlighted. (E) Single-molecule FISH showing shifts in expression of Oct4, Nanog,Nr0b1, and Otx2 at the RNA level between wt mESCs in serum+LIF and 2i+LIF culture conditions and Dgcr8KO mESCs cultured in serum+LIF. (F) Representative RNA FISH images showing expression of the Polycomb target gene and neural regulator Otx2 in individual mESC colonies under the three conditions examined. (G) Correlation between expression shifts between serum+LIF and 2i+LIF culture observed by single-cell RNA-Seq (x-axis) and RNA FISH (y-axis) for the 14 genes shown in Extended Data Figure 4A. Trendline indicates linear fit to the data. (H) Quantitative immunofluorescence showing changes in Nanog / Oct4 (left) and Nr0b1 / Oct4 (right) ratios between serum+LIF and 2i+LIF culture. Serum+LIF data is the same shown in Extended Data Figure 9. (I) RNA FISH images of E14 mESC colonies cultured in serum+LIF (left) or 2i+LIF (right) media and probed for Nanog (top) or Esrrb (bottom) expression. Both Nanog and Esrrb show bimodal expression patterns in E14 mESCs grown in serum+LIF, and shift towards the high expression state in 2i+LIF culture. White arrows indicate regions of low Nanog or Esrrb expression in mESCs grown in serum+LIF.
Extended Data Figure 8
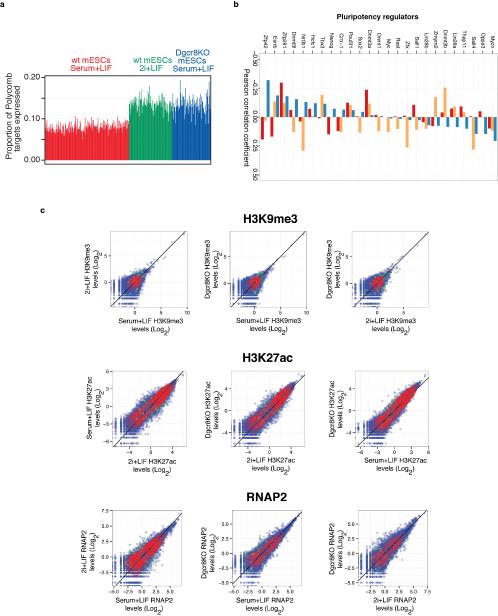
(A) Fraction of Polycomb target genes detected in wt mESCs cultured in serum+LIF (red) or 2i+LIF (green), or Dgcr8−/− mESCs cultured in serum+LIF (blue). (B) Correlation between Polycomb target gene expression and pluripotency regulator expression in different conditions. Displayed are the Pearson correlation coefficients (PCC) between pluripotency-related regulator z-score and proportion of Polycomb targets detected, computed across all single cells. The z-score is defined as the number of standard deviations that a sample exceeds (z-score>0) or is less than (<0) the mean value. Z-scores for pluripotency regulators were computed for each condition separately. A high PCC indicates that a higher factor expression (relative to its mean in the condition) increases the likelihood that Polycomb targets will be detected as expressed (e.g., Zfx in FBS+Lif). (C) Scatter plots comparing amount of H3K9me3 (top) H3K27ac (middle), and RNA polymerase II (bottom) at promoter regions in wt mESCs cultured in serum+LIF versus 2i+LIF conditions, wt mESCs versus Dgcr8KO mESCs cultured in serum+LIF, or Dgcr8KO mESCs cultured in serum+LIF versus wt mESCs cultured in 2i+LIF as indicated. ChIP-Seq reads at gene promoters were median normalized for comparison, and Polycomb target genes are indicated in green. Unlike H3K27me3, levels of these three factors do not show a strong decrease at Polycomb target genes under 2i+LIF conditions and in Dgcr8KO mESCs (compare to Figure 4E).
Extended Data Figure 9
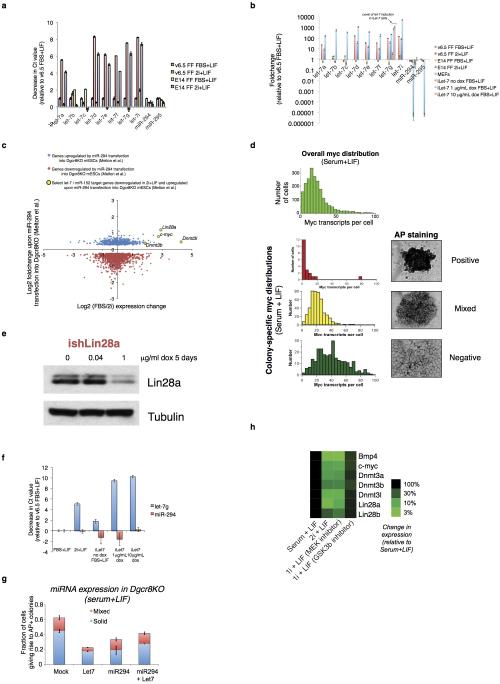
(A) Purified RNA from v6.5 mESCs and E14 mESCs cultured in either serum+LIF or 2i+LIF conditions was extracted and reverse-transcribed with TaqMan primers specific to the indicated miRNAs, and then expression was profiled by QPCR. Error bars represent standard deviation from technical triplicate PCR reactions, and samples are normalized to a basket of reference small noncoding RNAs and the decrease in Ct values compared to v6.5 mESCs grown in serum+LIF is shown. See Materials and Methods for full details. (B) Fold-change in expression of the indicated miRNAs in wild-type mESCs cultured in serum+LIF or 2i+LIF, induced and uninduced iLet-7 mESCs cultured in serum+LIF, and MEFs grown under standard conditions. Changes are shown relative to v6.5 mESCs grown in serum+LIF. (C) Comparison of genes that change in expression upon introduction of the ESCC miRNA miR-294 to Dgcr8−/− mESCs in Melton et al.44 (y-axis) to genes that change in expression between serum+LIF and 2i+LIF culture in single-cell RNA-Seq data (x-axis). Genes that are significantly upregulated in Dgcr8−/− mESCs upon miR-294 introduction are indicated in blue, and those that are significantly downregulated are indicated in green. Selected genes upregulated by miR-294 and downregulated in 2i+LIF culture as compared to serum+LIF are highlighted. As a group, genes downregulated by miR-294 show higher expression in 2i+LIF than in serum+LIF. (D) mESC colonies staining uniformly positive for alkaline phosphatase show reduced levels of c-myc. Overall and colony-specific c-myc distribution in serum+LIF culture as measured by RNA FISH, showing uniformly positive (top), mixed (middle), or negative (bottom) AP staining. (E) Western blot showing reduction of Lin28a protein levels in ishLin28a cells upon addition of doxycycline. (F) Let-7 expression changes in doxycycline-inducible ilet-7 mESCs grown in serum+LIF upon induction. RT-QPCR was performed as in A, and Ct changes are shown relative to v6.5 mESCs in serum+LIF in a separate experiment from panel A. The inducible let-7 construct is detected by the let-7g probe. (G) Effect of miRNA transfection on self-renewal efficiency of Dgcr8KO mESCs. miRNA mimics were transfected into Dgcr8KO mESCs, and self-renewal efficiency was measured. Error bars indicate standard deviations between triplicate transfection experiments. Co-transfection of the ESCC miRNA miR-294 with a let7 miRNA results in enhanced self-renewal efficiency as compared to miR-294 alone. (H) Expression changes of selected genes measured by QPCR upon culture of v6.5 mESCs in serum+LIF, 2i+LIF, or treatment with only Erk or GSK3β inhibitors.
Extended Data Table 1
List of genetic and chemical perturbations whose effects were profiled by single-cell QPCR.
| Perturbation | Effect | Cell line | Growth media | Feeders | Abbreviation | Ref. |
|---|---|---|---|---|---|---|
| Culture conditions | ||||||
| Standard (v6.5 MEFs) | Baseline conditions | v6.5 mESCs | Serum+LIF | Yes | v6.5 on MEFs | |
| Feeder-free | Increased spontaneous differentiation | v6.5 mESCs | Serum+LIF | No | v6.5 FF | |
| Feeder-free (E14) | Increased spontaneous differentiation | E14Tg2A | Serum+LIF | No | E14 FF | |
| Ground state | Increased self-renewal efficiency | v6.5 mESCs | 2i+LIF | No | V6.5 2i+LIF | 13 |
| Ground state (E14) | Increased self-renewal efficiency | E14Tg2A | 2i+LIF | No | E14 2i+LIF | 13 |
| Genetic knockouts | ||||||
| Polycomb repressive complex 2 | Disruption of the PRC2 complex, loss of H3K27me3 | Eed−/− | Serum+LIF | Yes | Eed KO | 31 |
| DNA methyltransferases | Loss of DNA methylation | DnmtTKO | Serum+LIF | Yes | DNMT TKO | 33 |
| MicroRNA processing | Loss of mature miRNAs (Knockout of Dgcr8) | Dgrc8KO | Serum+LIF | Yes No | DGCR8 KO on MEFS DGCR8 KO FF | 34 |
| Loss of mature miRNAs (Knockout of Dicer) | DicerKO | Serum+LIF | Yes No | Dicer KO on MEFs Dicer KO FF | 30 | |
| NuRD complex | Disruption of the NuRD complex | Mbd3−/− | Serum+LIF | Yes | Mbd3 | 32 |
| Chemical treatments | ||||||
| Trichostatin A | HDAC inhibition | v6.5 mESCs | Serum+LIF | Yes | TSA | |
| Valproic acid | HDAC inhibition | v6.5 mESCs | Serum+LIF | Yes | VPA | |
| BIX01294 | Inhibition of G9a histone methyltransferase | v6.5 mESCs | Serum+LIF | Yes | BIX | |
| Hoechst 33342 | Cell cycle analysis (cells in G0/G1 were isolated) | v6.5 mESCs | Serum+LIF | Yes | Hoechst | |
| Alternate cell types | ||||||
| Induced pluripotent stem cells | Reprogrammed from somatic cells | iPSCs | Serum+LIF | Yes | iPSCs | |
| Epiblast stem cells | Primed state of pluripotency | EpiSCs | EpiSC growth media | Yes | EpiSCs | 35 |
Supplementary Material
1
7
8
9
10
11
12
2
3
4
5
6
ACKNOWLEDGEMENTS
We thank members of the Collins and Daley labs for helpful discussions. J.J.C. is supported by NIH grant R24DK092760 and the HHMI. G.Q.D. is supported by grants from the NIH (R01GM107536, R24DK092760, P50HG005550) and is an affiliate member of the Broad Institute and an investigator of the Manton Center for Orphan Disease Research and the Howard Hughes Medical Institute. A.R. is supported by the Broad Institute, the Klarman Cell Observatory at the Broad Institute, an NIH CEGS (1P50HG006193- 01), an NIH Pioneer Award (DP1OD003958-01), and the HHMI. R.M.K. is supported by the Wyss Institute. P.C. is supported by NIDDK (K01DK096013) and received support from NHLBI (T32HL066987 and T32HL007623) and the Manton Center for Orphan Disease Research. R.S. was supported by an NIH Postdoctoral Fellowship (1F32HD075541-01). H.L. is supported by the Mayo Clinic Center for Individualized Medicine. Sequencing was performed by the Broad Institute Genomics Platform. Flow cytometry was performed in the Hematologic Neoplasia Flow Cytometry Facility at the Dana-Farber Cancer Institute and the BCH IDDRC Stem Cell Core Facility at Boston Children's Hospital supported by NIH-P30-HD18655. Single-cell QPCR experiments were performed at the BCH IDDRC Molecular Genetics Core Facility at Children's Hospital Boston supported by NIH-P30-HD18655. Fludigm C1 experiments were performed at the Broad Institute and the Biopolymers Facility at Harvard Medical School.
Footnotes
Data are deposited in GEO under accession number GSE60749.
AUTHOR CONTRIBUTIONS
R.M.K. designed and performed the experiments, analyzed the data, and wrote the paper. P.C. analyzed the data, developed analytical tools, and wrote the paper. A.K.S., D.G., and J.J.T. performed ChIP-Seq and single-cell RNA-Seq experiments. R.S. helped to analyze the ChIP-Seq and single-cell RNA-Seq data. A.D. performed experiments and helped to analyze the data. H.L. helped to analyze the data. J.Z. generated the iShLin28 mESCs. K.P. generated the iPSCs. T.C.F. assisted with imaging and wrote image analysis algorithms. A.R. oversaw single-cell RNA-Seq experiments and helped to write the paper. J.J.C. and G.Q.D. oversaw the project and helped to design the study and write the paper.
Supplementary Information is linked to the online version of the paper at www.nature.com/nature.
REFERENCES
Full text links
Read article at publisher's site: https://doi.org/10.1038/nature13920
Read article for free, from open access legal sources, via Unpaywall:
https://europepmc.org/articles/pmc4256722?pdf=render
Citations & impact
Impact metrics
Citations of article over time
Alternative metrics
Article citations
Redox heterogeneity in mouse embryonic stem cells individualizes cell fate decisions.
Dev Cell, 59(16):2118-2133.e8, 05 Aug 2024
Cited by: 0 articles | PMID: 39106861
Single-cell RNA sequencing in diabetic kidney disease: a literature review.
Ren Fail, 46(2):2387428, 04 Aug 2024
Cited by: 0 articles | PMID: 39099183 | PMCID: PMC11302482
Review Free full text in Europe PMC
scLENS: data-driven signal detection for unbiased scRNA-seq data analysis.
Nat Commun, 15(1):3575, 27 Apr 2024
Cited by: 2 articles | PMID: 38678050 | PMCID: PMC11519519
Gene-expression memory-based prediction of cell lineages from scRNA-seq datasets.
Nat Commun, 15(1):2744, 29 Mar 2024
Cited by: 2 articles | PMID: 38553478 | PMCID: PMC10980719
Comparative transcriptomic analysis of Illumina and MGI next-generation sequencing platforms using RUNX3- and ZBTB46-instructed embryonic stem cells.
Front Genet, 14:1275383, 05 Jan 2024
Cited by: 0 articles | PMID: 38250572 | PMCID: PMC10796612
Go to all (225) article citations
Data
Data behind the article
This data has been text mined from the article, or deposited into data resources.
BioStudies: supplemental material and supporting data
GEO - Gene Expression Omnibus
- (1 citation) GEO - GSE60749
Similar Articles
To arrive at the top five similar articles we use a word-weighted algorithm to compare words from the Title and Abstract of each citation.
Embryonic stem cell microRNAs: defining factors in induced pluripotent (iPS) and cancer (CSC) stem cells?
Curr Stem Cell Res Ther, 4(3):168-177, 01 Sep 2009
Cited by: 59 articles | PMID: 19492978
Review
Pluripotency maintenance mechanism of embryonic stem cells and reprogramming.
Int J Hematol, 91(3):360-372, 16 Feb 2010
Cited by: 4 articles | PMID: 20157790
Review
Identification of microRNAs regulated by activin A in human embryonic stem cells.
J Cell Biochem, 109(1):93-102, 01 Jan 2010
Cited by: 28 articles | PMID: 19885849
[The effect of microRNAs on the regulatory network of pluripotency in embryonic stem cells].
Yi Chuan, 35(10):1153-1166, 01 Oct 2013
Cited by: 2 articles | PMID: 24459889
Review
Funding
Funders who supported this work.
Howard Hughes Medical Institute
NCI NIH HHS (1)
Grant ID: DP1 CA174427
NHGRI NIH HHS (2)
Grant ID: P50 HG005550
Grant ID: P50 HG006193
NHLBI NIH HHS (2)
Grant ID: T32 HL007623
Grant ID: T32 HL066987
NICHD NIH HHS (2)
Grant ID: F32 HD075541
Grant ID: P30 HD018655
NIDDK NIH HHS (2)
Grant ID: K01 DK096013
Grant ID: R24 DK092760
NIGMS NIH HHS (1)
Grant ID: R01 GM107536
NIH HHS (1)
Grant ID: DP1 OD003958


