| PMC full text: | Published online 2015 Jan 29. doi: 10.1371/journal.pgen.1004958
|
Figure 5

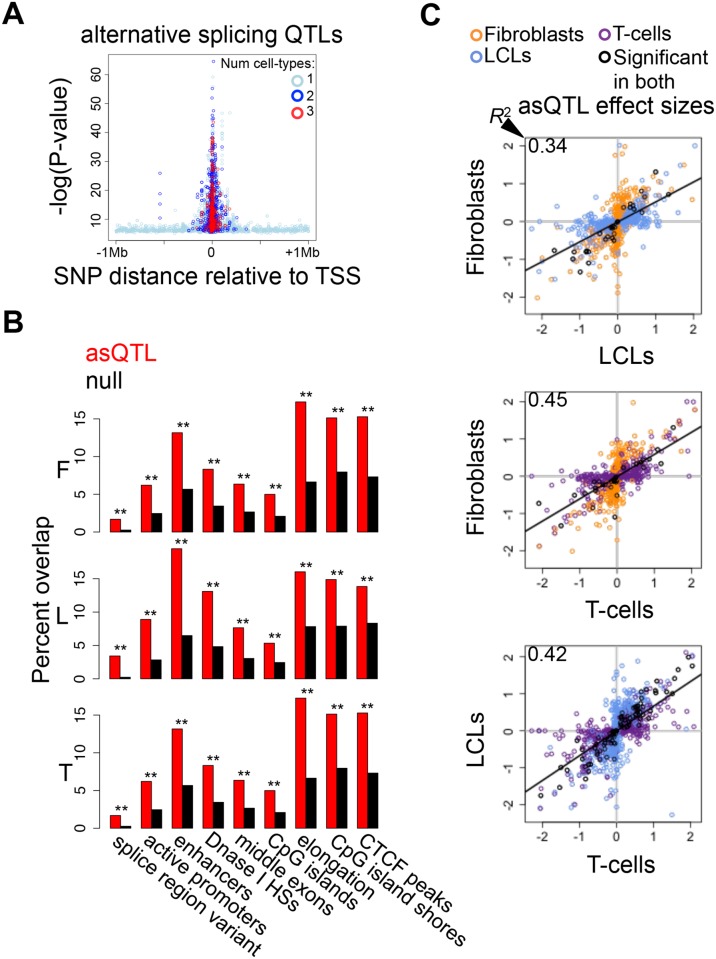
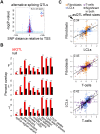
(A) Highly significant associations between genetic variation and alternative splicing (asQTLs) cluster close to the transcription start site (TSS). The top asQTL per exon-exon link is plotted showing its relative distance to the TSS by the level of significance—log(P-value). Additionally, we observe that associations called significant in three cell-types are closer to the TSS than associations significant in two cell-types and these are closer than associations significant in only one cell-type. A great part of the genetic control on splicing appears to occur in promoter proximal regions, and cell-type specific distant asQTLs could reflect that distant regulatory elements are involved in tissue-specific splicing. (B) For distinct genomic regions, the percent of overlapping asQTLs (top SNP per link) in comparison to the proportion of overlapping null SNPs in fibroblasts (F), LCLs (L) and T-cells (T). We found significant enrichment of asQTLs in splice region variants, active promoters, enhancers, DNase I hypersensitive sites (HSs), middle exons, CpG islands, elongation marks, CpG island shores and CTCF peaks (see also S5 Table). One star indicates P < 0.05, two stars indicate P < 5E-04, Fisher’s exact test. (C) Effect sizes of the union of asQTLs (best SNP per exon-exon link) for each pair of cell-types are plotted. Effect size is measured as the difference in medians of scaled alternative splicing levels between heterozygous individuals and the homozygous individuals for the major allele. Hence, effect sizes are quantified in terms of number of standard deviations on the alternative splicing levels modified by an allele change. Black dots depict associations significant in both cell-types compared; orange, blue and purple dots are associations significant in only fibroblasts, LCLs and T-cells, respectively, within the pair compared. Coefficient of determination R2, reflecting the proportion of effect size variance in one cell-type explained by the other cell-type, is shown in the top left corner of each plot (S1 Table).


