Abstract
Study objectives
We hypothesized that a dual-channel portable monitor (PM) device could accurately identify patients who have a high pretest probability of obstructive sleep apnea (OSA), and we evaluated factors that may contribute to variability between PM and polysomnography (PSG) results.Methods
Consecutive clinic patients (N = 104) with possible OSA completed a home PM study, a PM study simultaneous with laboratory PSG, and a second home PM study. Uniform data analysis methods were applied to both PM and PSG data. Primary outcomes of interest were the positive likelihood ratio (LR+) and sensitivity of the PM device to "rule-in" OSA, defined as an apnea-hypopnea index (AHI) ≥ 5 events/h on PSG. Effects of different test environment and study nights, and order of study and analysis methods (manual compared to automated) on PM diagnostic accuracy were assessed.Results
The PM has adequate LR+ (4.8), sensitivity (80%), and specificity (83%) for detecting OSA in the unattended home setting when benchmarked against laboratory PSG, with better LR+ (> 5) and specificity (100%) and unchanged sensitivity (80%) in the simultaneous laboratory comparison. There were no significant night-night (all p > 0.10) or study order effects (home or laboratory first, p = 0.08) on AHI measures. Manual PM data review improved case finding accuracy, although this was not statistically significant (all p > 0.07). Misclassification was more frequent where OSA was mild.Conclusions
Overall performance of the PM device is consistent with current recommended criteria for an "acceptable" device to confidently "rule-in" OSA (AHI ≥ 5 events/h) in a high pretest probability clinic population. Our data support the utility of simple two-channel diagnostic devices to confirm the diagnosis of OSA in the home environment.Commentary
A commentary on this article appears in this issue on page 411.Free full text

A Comprehensive Evaluation of a Two-Channel Portable Monitor to “Rule in” Obstructive Sleep Apnea
Abstract
Study Objectives:
We hypothesized that a dual-channel portable monitor (PM) device could accurately identify patients who have a high pretest probability of obstructive sleep apnea (OSA), and we evaluated factors that may contribute to variability between PM and polysomnography (PSG) results.
Methods:
Consecutive clinic patients (N = 104) with possible OSA completed a home PM study, a PM study simultaneous with laboratory PSG, and a second home PM study. Uniform data analysis methods were applied to both PM and PSG data. Primary outcomes of interest were the positive likelihood ratio (LR+) and sensitivity of the PM device to “rule-in” OSA, defined as an apnea-hypopnea index (AHI) ≥ 5 events/h on PSG. Effects of different test environment and study nights, and order of study and analysis methods (manual compared to automated) on PM diagnostic accuracy were assessed.
Results:
The PM has adequate LR+ (4.8), sensitivity (80%), and specificity (83%) for detecting OSA in the unattended home setting when benchmarked against laboratory PSG, with better LR+ (> 5) and specificity (100%) and unchanged sensitivity (80%) in the simultaneous laboratory comparison. There were no significant night-night (all p > 0.10) or study order effects (home or laboratory first, p = 0.08) on AHI measures. Manual PM data review improved case finding accuracy, although this was not statistically significant (all p > 0.07). Misclassification was more frequent where OSA was mild.
Conclusions:
Overall performance of the PM device is consistent with current recommended criteria for an “acceptable” device to confidently “rule-in” OSA (AHI ≥ 5 events/h) in a high pretest probability clinic population. Our data support the utility of simple two-channel diagnostic devices to confirm the diagnosis of OSA in the home environment.
Commentary:
A commentary on this article appears in this issue on page 411.
Citation:
Ward KL, McArdle N, James A, Bremner AP, Simpson L, Cooper MN, Palmer LJ, Fedson AC, Mukherjee S, Hillman DR. A comprehensive evaluation of a two-channel portable monitor to “rule in” obstructive sleep apnea. J Clin Sleep Med 2015;11(4):433–444.
Obstructive sleep apnea (OSA) is a prevalent condition commonly associated with obesity, hypertension, habitual snoring, and hypersomnolence.1,2 A recent update of the Wisconsin cohort study reported a disturbing increase in estimated prevalence of OSA over the last two decades, with population ageing and increasing obesity likely driving influences.3 Growing demand for access to diagnosis and treatment has led to longer waiting lists as the need for these services exceeds capacity.4 Population-based studies estimate that 90% of cases in the communities of advanced economies remain undiagnosed and untreated.2,5,6
An important limiting factor has been a lack of access to and perceived expense of laboratory polysomnography (PSG), the current “gold standard” for OSA diagnosis.7 There is an urgent need to research novel diagnostic methodologies that are less expensive and more widely applicable than PSG.5 Because of these difficul-ties many physicians have resorted to the use of ambulatory diagnostic devices, despite limited evidence of their accuracy.8
Several recent reviews have assessed portable monitoring (PM) devices in OSA diagnosis.9–11 Identified shortcomings of the assessment of these devices include frequent failure to evaluate their effectiveness in their intended home setting, low patient numbers, inadequate randomization of the order in which at-home and in-laboratory studies were made, and reliance on automated scoring of the data generated. In response to these deficiencies, Flemons et al. developed a system for grading the evidence from such studies and made recommendations regarding the use of appropriate research methods and reporting for the validation of PM devices to minimize bias.9,12 All subsequent reviews have applied this grading methodology in order to build an evidence basis regarding the place of PM in the diagnosis of OSA.
The limitations outlined above appear to relate particularly to simple one- or two- channel (type 4) devices. While type 3 PM devices (which include ≥ 4 cardiorespiratory channels) have been approved for objective testing in several situations, the American Academy of Sleep Medicine (AASM) holds that there is insufficient evidence to support use of type 4 PMs in unattended settings.10,13 Given the simplicity and relatively low cost of such devices, interest remains in definitively determining their place in diagnostic testing, both for clinical and research purposes.
Barriers to acceptance of simple PM devices are their lack of an accurate measure of time asleep and inability to detect arousals, and therefore arousal-related respiratory events. It has been argued that clinicians could accept an index generated by a PM that may not agree completely with PSG if it accurately categorized presence or absence of OSA.14 Based upon this premise, the sensitivity, specificity and positive likelihood ratio (LR+) appear to be the best statistical measures for identifying a clear cutoff for a PM-generated AHI that defines presence or absence of the disorder.14 Indeed, Collop et al. devised specific criteria to apply to the PM result to ensure a sufficiently high posttest probability (> 95%) to confidently rule in OSA.15 Their approach focussed upon assessing study quality and statistical methodology that ensured PM diagnosis accurately categorized OSA, allowing for the limitations inherent in their inability to detect and stage sleep.
The recent recommendations of Collop regarding the standards that should be applied to evaluation of PM devices informed our approach to this study.15 The primary aim of the present study was to assess the accuracy of a dual-channel PM device (ApneaLink) as a triaging tool for suspected OSA in a population referred to a specialist sleep clinic. We hypothesized that by addressing limitations in previous studies we could demonstrate that this simple type 4 device could accurately “rule-in” OSA in high pre-test probability patients. The methodological weaknesses of previous studies were addressed by ensuring adequate sample size, testing in both home and laboratory environments, and assessment of night-to-night variability and order effects. We also compared PM analysis using the computer-aided visual data review method with automated analysis for this PM device, by uploading PM recordings into our PSG analysis platform. We postulated further that some of the misclassification reported in past studies may be due to analysis discrepancies.
METHODS
Participants
Eligible study participants were patients referred to a sleep disorders clinic (West Australian Sleep Disorders Research Institute [WASDRI], Sir Charles Gairdner Hospital) for investigation of suspected OSA. Inclusion criteria were: age 18–75 years, referral for investigation of possible OSA, scheduled diagnostic PSG, and ability to adhere to all study components. Exclusion criteria included unstable coronary syndromes, severe chronic airflow limitation (FEV1 < 50% predicted), uncontrolled congestive cardiac failure, morbid obesity (BMI > 40), neuromuscular disease, cognitive impairment/disability such that the PM study was difficult to administer, previous diagnosis of OSA, and use of CPAP or oxygen therapy. The study was approved by the local Human Research Ethics Committee (No. 2007-032).
Study Design
A prospective repeat study protocol (Figure 1) was used in which subjects completed a home PM study 2 weeks prior to PSG (P1), a PM study simultaneous with laboratory PSG (P2), and a home PM study after PSG (P3). Subjects were randomly assigned to complete all (P1, P2, P3) assessments (Group 1) or only P2 and P3 (Group 2).
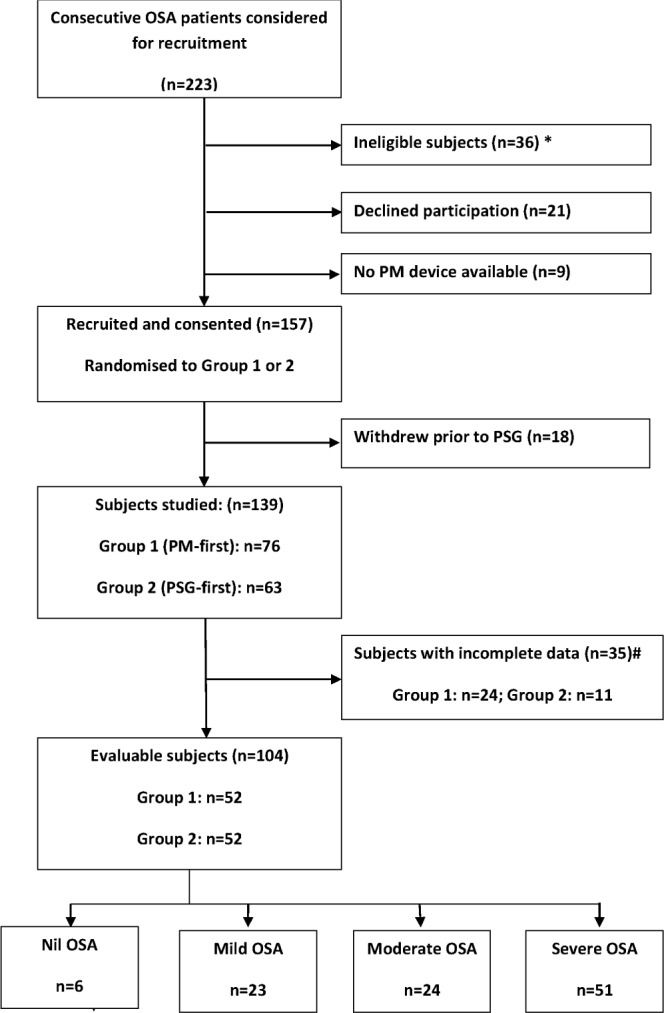
*Detail of ineligible subjects given in text. #Detail of incomplete data given in text.
The afternoon prior to P1, a sleep technologist issued the PM device and instructed the participant in its correct fitting and use (education 10 min). The subject took the equipment home, wore it during a “usual” night's sleep and returned it by post. During simultaneous PM and PSG (P2), the nasal pressure signal was delivered to both sleep systems using a Y-piece in the nasal catheter, a methodology validated in previous studies,16–19 and the subject wore separate oximetry finger probes for the PM device and PSG. At the conclusion of the PSG all subjects were given a PM device and instructed about its correct use. The subject took the device home, repeated the PM study within 1–14 days of the PSG (P3) and returned it by post.
The PM study was judged acceptable if it was ≥ 4 h duration, and both flow and saturation data were present ≥ 90% of the recording time. When a PM study was not acceptable on these grounds, participants were invited to repeat the study. Of the total number of PM studies conducted (n = 356), there were 70 (19.7%) failed studies (with some subjects having more than one failed study, so that the total number of subjects with failed studies was 35). Of the 70 failed studies, 37 (10.4%) were patient-related failures (insufficient duration or compliance), 20 (5.6%) were due to administrative error (booking error), and 13 (3.7%) were technical (signal loss) failures. Of 139 patients who gave informed written consent to participate, 35 subjects had “failed” PM studies, which left 104 evaluable patients (Figure 1).
Measurements
Portable Study (PM Study)
The PM studies were undertaken using the ApneaLink Ox device (Firmware version 04.08, software version 8.00) which comprises a nasal flow signal (using a nasal cannula/pressure transducer system, recording the inverse square root of pressure as an index of flow [sample rate 100Hz]), and pulse oximetry (Nonin XPod 3012 with a Nonin 7000A finger probe [sample rate 1 Hz]; Nonin, Hudiksvall, Sweden). Details of linearization of the nasal pressure signal and processing of artifact in the pulse oximetry signal have been outlined in past validation studies.16,17,20,21
Initial PM data analysis was automated (by ApneaLink software) with rules defined to match laboratory PSG settings.22 Manual data review used the PSG data analysis platform after importing ApneaLink signals (EDF format with removal of automated results). PM studies were de-identified and scored by 2 accredited sleep scientists who are members of the Board of Registered Polysomnographic Technologists (BRPT), who were blind to the PSG results. To assess scoring concordance between the scientists, a random sample of 10 studies was analyzed by both scorers, and the intraclass correlation coefficient for the apnea-hypopnea index (AHI) was calculated.
An apnea was defined as a decrease in airflow by 80% of baseline (duration 10–80 s). A hypopnea was defined as a decrease in airflow ≥ 30% of baseline plus 3% desaturation or a reduction of airflow ≥ 50% of duration 10–100 s. The index definition for AHI derived from PM (AHI PM) was apneas plus hypopneas per recording hour.
Polysomnography (PSG)
Overnight laboratory-based PSG was performed using the Compumedics E-Series (PSG Online 2, Compumedics Ltd, Abbotsford, Australia).22,23 Sleep was documented by standard electroencephalographic (EEG), electro-oculographic (EOG) and electromyographic (EMG) criteria.24 Other measurements included electrocardiogram (ECG), nasal pressure, oronasal airflow (thermocouple), thoracic and abdominal inductance plethysmography, oximetry (Nonin XPod 3012 with a Nonin 7000A finger probe [sample rate 1 Hz]; Nonin, Hudiksvall, Sweden) and bilateral leg movements (piezoelectric sensors).22
PSG studies were manually scored by sleep scientists according to the recommendations published by the AASM,22 using Profusion 2 software (Compumedics Ltd, Abbotsford, Australia). Obstructive apneas were defined as the absence (decrease by 80% from baseline) of airflow ≥ 10 seconds. Obstructive hypopneas were defined as ≥ 50% decrease in airflow, or a clear but lesser decrease in airflow associated with either 3% desaturation or an EEG arousal in the context of ongoing respiratory effort. In the case of PSG, AHI was defined as the number of apneas plus hypopneas per sleep hour (AHI PSG). OSA was defined as AHI ≥ 5 events/h with severity of OSA defined as: Nil = AHI < 5 events/h; mild = 5 ≤ AHI < 15 events/h; moderate = 15 ≤ AHI < 30 events/h; severe = AHI ≥ 30 events/h.22
Data Analysis
Sample size calculation was based upon preliminary data showing a standard deviation of the mean difference in AHI between a similar PM device (Micromesam, single channel) and PSG methods of 11.5 events/h for 25 paired data sets.25 Assuming α = 0.05 and > 90% power, we estimated 89 pa -tients were required to detect an AHI difference of 4 events/h between methods (a level of discrimination that accounts for potential variability in the AHI attributable to home versus laboratory-based study differences).26 Allowing for data wastage of 17% (based on the previous study), we planned to complete 104 evaluable cases.
Baseline demographic and sleep data for the cohort were described as mean ± SD, or median [interquartile range (IQR)] for skewed data.
The primary outcome of interest was the diagnostic accuracy of the PM device to rule in OSA at AHI ≥ 5 events/h. Account was taken of factors known to have contributed to variability in past studies as follows: (a) night-to-night consistency of PM results, (b) study order effect, (c) underestimation of PM results, and (d) manual data review versus auto-analysis.
Validation analysis included calculation of sensitivity, specificity, and positive and negative likelihood ratios (LR+, LR-), using the PSG as the reference standard. We applied the statistical guidelines recommended by Collop et al., whereby an acceptable PM device is judged according to whether it can produce LR+ ≥ 5 and sensitivity ≥ 0.825 at an in-laboratory AHI of ≥ 5 events/h, assuming a pretest probability of 80%.15 We calculated the expected LR+ to achieve a posttest probability > 95% in our clinic population using our known prevalence rates for mild, moderate, and severe OSA (expected LR+: 1.8, 6.5, and > 10, [Table 2]).
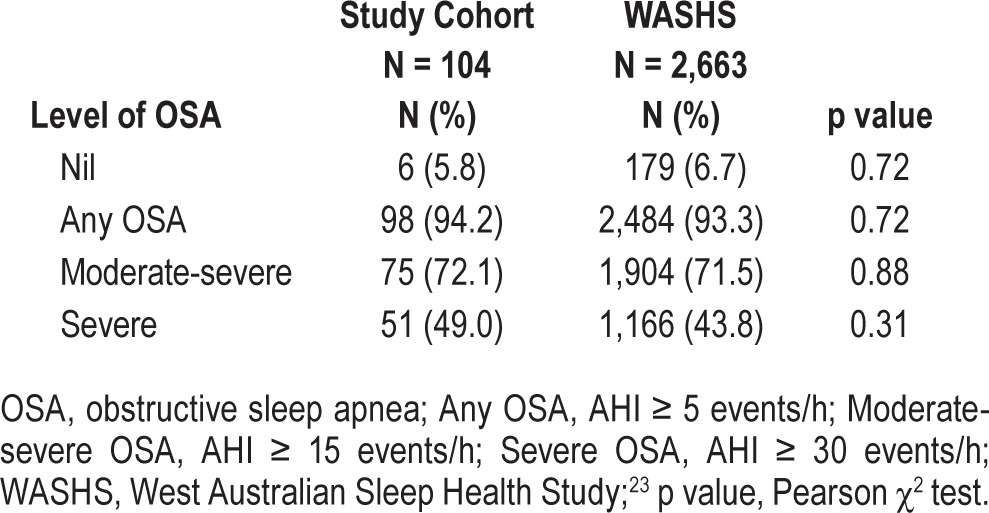
Table 2
Prevalence of OSA in portable study cohort compared with WASHS.
The night-to-night consistency of PM results (Group 1, n = 52) was evaluated by 4 methods: mean night to night differences between grouped data, mean night-to-night differences between paired data, correlation between repeated results, and Bland-Altman plots of paired measurements. Order of study effect was investigated by randomization of subjects to 2 groups (PM first [n = 52] or PSG first [n = 52]) and calculation of group mean differences. The misclassification percentages (at AHI ≥ 5 events/h) between the groups were compared using χ2 tests.
The effects of different study night, equipment, and environment on AHI measured at home and in the laboratory were assessed using bivariate correlation, identity plots, and Bland-Altman plots. Mean differences between AHI PSG and AHI PM for the cohort (P2 and P3, n = 104) were calculated.
Accuracy of manual analysis compared with auto-analysis was investigated by calculation of sensitivity, specificity and percentage of missed cases. The misclassification percentage for auto-analysis was compared with manual review by χ2 analysis.
Data were analyzed using SPSS statistics (GradPack 17.0 Release 17.0.2, March 11, 2009), and R software (Version 2.14.1, 2011-12-22). Statistical significance was defined at the 5% level.
RESULTS
Over a one-year period, 223 subjects were approached to participate in the study. Of these subjects, 139 consented to participate and were randomized to receive either a PM home study first (Group 1) or a simultaneous laboratory PM and PSG study first (Group 2, [Figure 1]).
Subject Characteristics
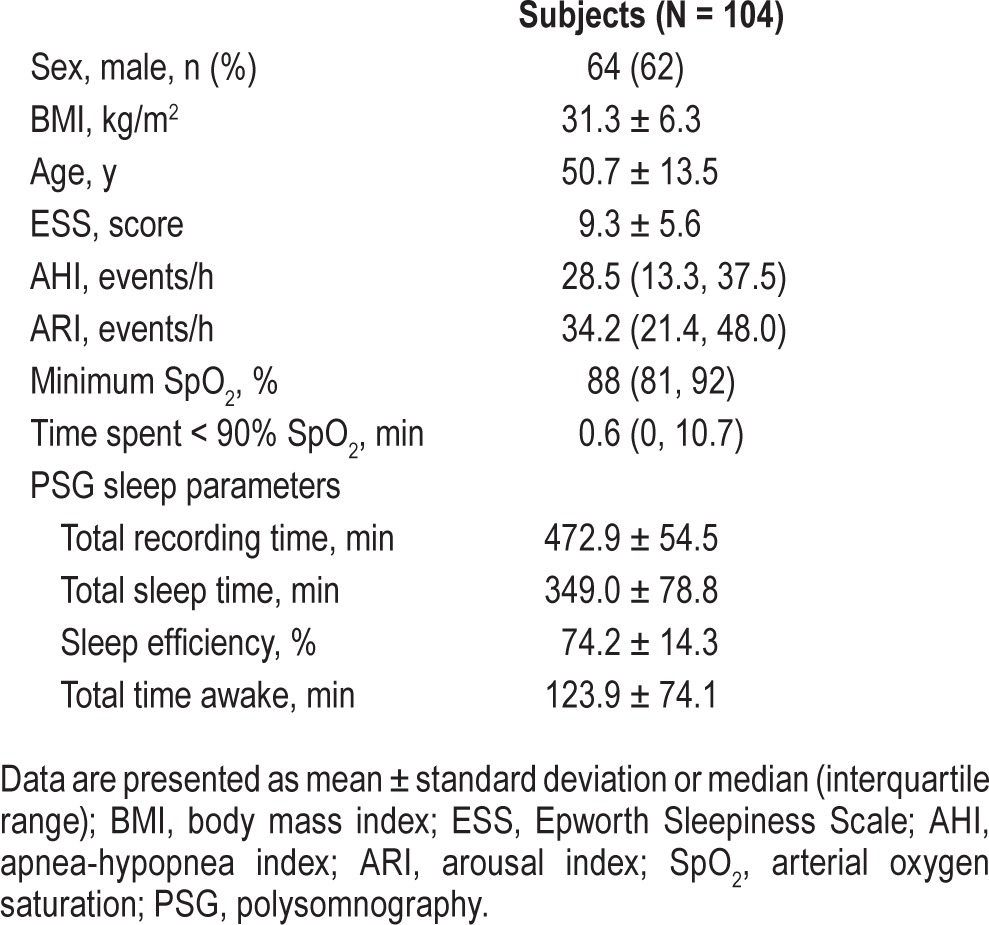
Subjects were predominantly male (64%), middle-aged (50.7 ± 13.5 y), obese (BMI: 31.3 ± 6.3 kg/m2), and commonly reported daytime sleepiness (ESS: 9.3 ± 5.6; Table 1). Subjects had moderately severe OSA (AHI: 28.5, 13.3–37.5 events/h), and evaluable subjects (n = 104) had a wide range of disease severity (AHI range: 1 to 129 events/h). The median minimum oxygen saturation was 88% (81% to 92%), and time spent at an arterial oxygen saturation ≤ 90% was 0.6 min (0.0–10.7) [Table 1]. There were no significant differences between the demographic and sleep characteristics of subjects who were evaluable (n = 104) and those who were not (n = 35) [Table 1]. Scoring reliability between the 2 BRPT-accredited scorers was high, with intraclass correlation coefficient (ICC) values for P2 and P3 of 0.97 (95% CI 0.88, 0.99) and 0.98 (95% CI 0.70, 0.99). The prevalence of OSA in this study cohort is comparable to the prevalence in our tertiary referred clinic population (Table 2).23
Table 1
Characteristics of the study cohort.
1. PM Device Performance
There were no significant night-to-night variability or order effects for PM data (see Potential sources of PM device performance variability, below); hence, all data for P2 and P3 (i.e., from Groups 1 and 2) were combined to optimize statistical power (n = 104) in the following correlational, agreement, and diagnostic accuracy analyses.
Correlation between PM Studies and PSG
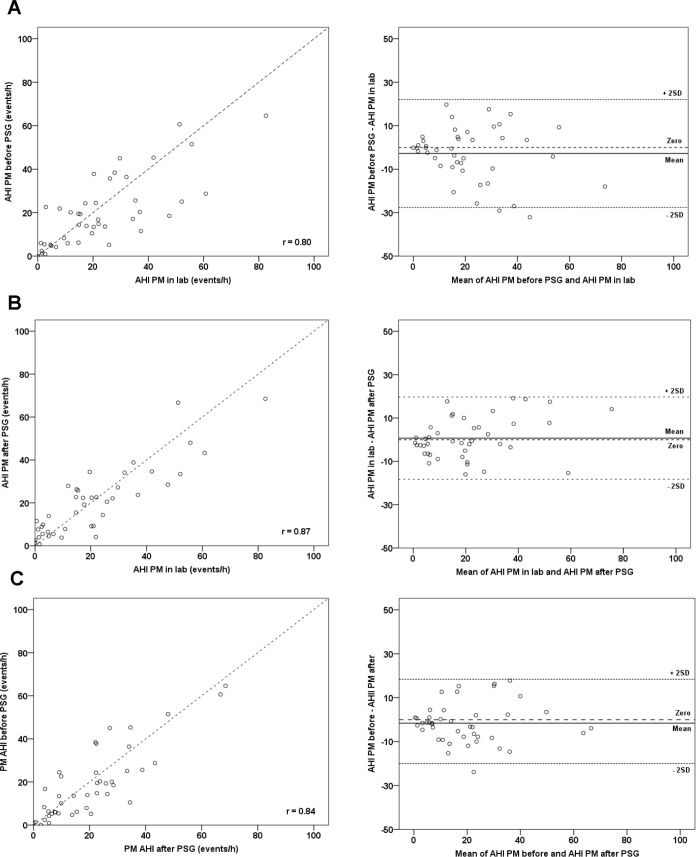
Data from all evaluable subjects (n = 104) showed that there were generally good correlations between AHI PM from night to night and with laboratory AHI PSG (Figure 2A–2C). The closest correlations were seen between tests on different equipment (PM and laboratory) done on the same night in the same laboratory environment (r = 0.9, Figure 2A), and between tests on the same equipment but different nights and different environments (r = 0.9, Figure 2B).
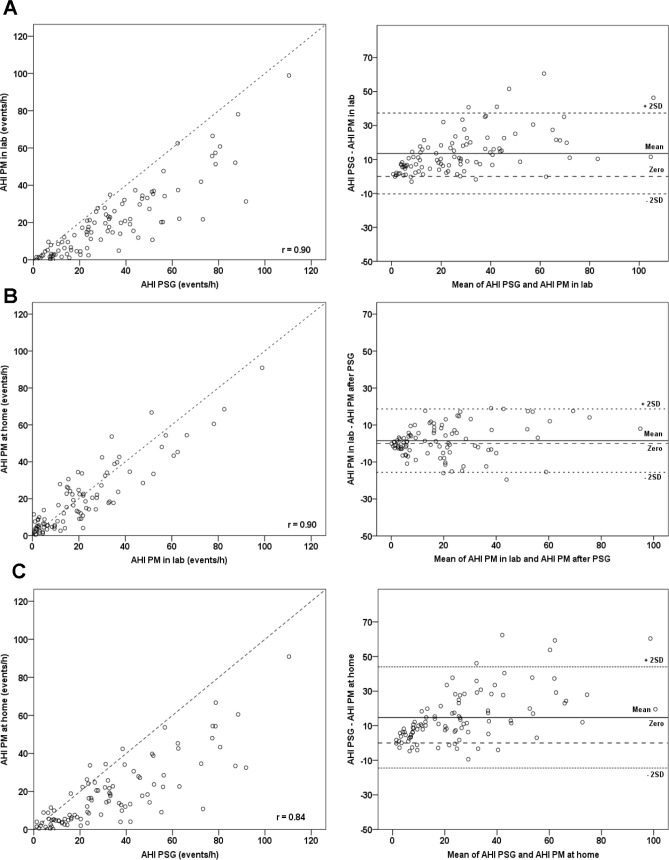
(A) Simultaneous recordings (same night and environment, different equipment). (B) Compares PM studies done in-lab and at home (different night and environment, same equipment). (C) Compares in-lab PSG with home PM study (different night, environment and equipment).
Agreement between PM Studies and PSG
The AHI PM (home and laboratory) underestimated AHI PSG, and the difference between the 2 methods increased with the mean AHI PSG/AHI PM (Figure 2A and 2C). In Figure 2A, almost all data points fell below the line of identity in the identity plot and above the line of no difference in the Bland-Altman plot. The AHI PM on all 3 study nights was significantly lower (p < 0.001) than AHI PSG. Mean differences ranged from 13.5 events/h (95% CI 11.1, 15.9) on the simultaneous night (P2) to 17.2 events/h (95% CI 12.0, 22.4) on the pre-PSG night (P1), and 14.8 events/h (95% CI 11.8, 17.8) on the post-PSG night (P3). By contrast, agreement was best using the same equipment, on a different night but in the same environment (Figure 2B, Bland-Altman plot, and Figure 3).
Diagnostic Accuracy of the PM
Table 3 presents data for the diagnostic accuracy of the PM to categorize mild, moderate, and severe OSA for simultaneous data collection (P2) and in the unattended home setting (P3). The PM had good diagnostic accuracy to rule in OSA (AHI ≥ 5 events/h), with a sensitivity of 80% and LR+ of 4.8 in the home setting (Table 3). Positive LR remained high (infinity, due to the denominator of 1-specificity being zero) to rule in both moderate and severe OSA, but there was a progressive loss of sensitivity (66%, 43%, respectively).
Table 3
Diagnostic accuracy of combined group 1 and 2 data for study nights 2 and 3 using the PM device relative to clinical standard PSG for mild, moderate, and severe OSA.

2. Potential Sources of PM Performance Variability
Night-to-Night Variability
Group 1 subjects (n = 52) had 3 PM studies (home P1, lab P2, home P3). Identity plots showed good correlation between the paired comparisons (r = 0.80 to 0.87) for Group 1 subjects (Figure 3).The mean night-to-night differences between home PM study results were small (AHI P1-P3: −1.6, 95% CI −4.4, 1.22, p = 0.26). Comparison between the home PM studies (P1 and P3) and laboratory PM study (P2) showed small mean differences (AHI P1-P2: −2.84, 95% CI −6.7, 1.0, p = 0.14, and AHI P3-P2: 0.72, 95% CI −2.2, 3.7, p = 0.63) of a similar magnitude. Similarly, Bland-Altman plots showed strong agreement between repeated PM results, with mean differences close to zero and ranging from −2.8 to 1.5 events/h (Figure 3).
Order Effect
The study design enabled exploration of the potential effect of order of measurement method. Group 1 subjects had a home PM study first (P1), while Group 2 subjects had laboratory PSG first, followed by home PM study (P3). The group mean difference between AHI PSG and home AHI PM was small (mean difference 3.2, 95% CI −3.2, 9.5), and there was no significant difference (p = 0.33) between the mean differences for the groups based upon order of study. Analysis of accuracy of classification (at AHI ≥ 5 events/h) for both groups found 11% (n = 5) misclassification for PM first subjects compared with 24% (n = 12) misclassification for PSG first subjects, but the difference in these proportions was not significantly different (p = 0.08). Misclassification was more frequent where OSA was mild.
Comparison of Automated Analysis with Manual Data Review
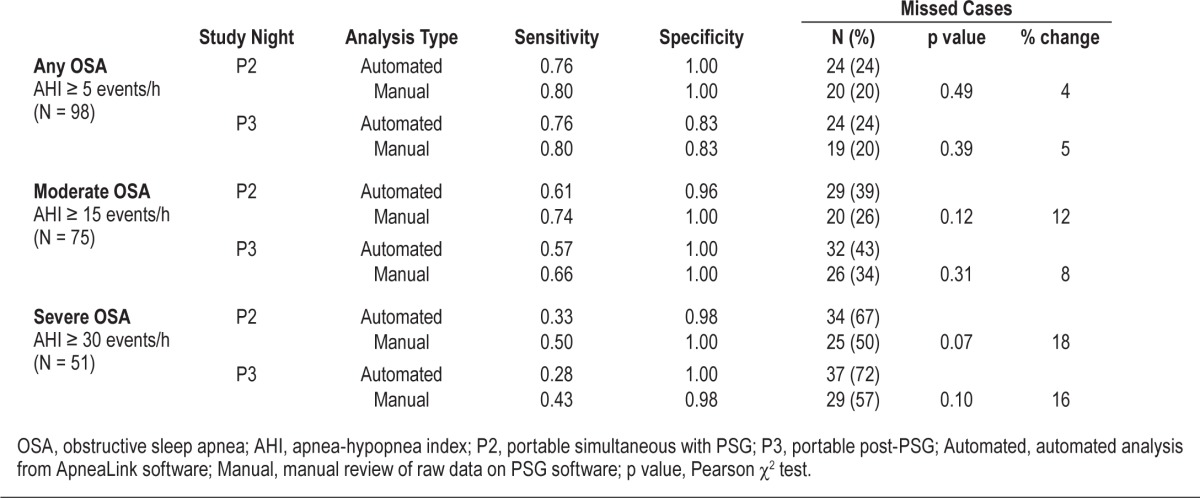
Seventy-five (72%) subjects had moderate to severe OSA on PSG (Table 2). Manual review correctly classified 55 cases (73%), while auto-analysis correctly classified 46 cases (61%; Table 4). Thus 9 cases (12%) of moderate-severe OSA were missed by the auto-analysis of the PM data. Table 4 shows that at every AHI level, manual review of data reduced the percentage of missed cases from 4% to 18%, irrespective of whether data were collected simultaneously in the laboratory or in the unattended home setting. However, these reductions were not statistically significant (all p > 0.07, Table 4).
Table 4
Accuracy of manual analysis compared with autoanalysis for mild, moderate, and severe OSA.
DISCUSSION
This study confirms the accuracy of a two-channel (type 4) PM device for the diagnosis of OSA in a sleep clinic population with a high pretest probability of the disorder. We found the PM has an adequate LR+ (4.8) and sensitivity (80%) for OSA (AHI ≥ 5 events/h) in the unattended home setting compared with laboratory PSG, and a better LR+ (infinity) and unchanged sensitivity (80%) in the simultaneous laboratory comparison. Hence, the overall performance of the device is consistent with the current recommended criteria for an “acceptable” PM device to confidently “rule-in” OSA (AHI ≥ 5 events/h) in a high pretest probability clinic population.15
Unlike many preceding studies of PM devices, this study was conducted according to the recommendations of expert working groups with both concurrent testing with laboratory PSG and testing at home, the intended setting for its use.9–11 We found no significant differences in night-to-night AHI measures, nor was there a study order effect (home or laboratory first) when comparing mean differences between groups. Misclassification did not differ significantly between groups (PM first 11% versus PSG first 24%, p = 0.08), but was more frequent where OSA was mild. Manual PM data review improved case finding accuracy, but the difference in accuracy did not reach statistical significance.
Previous studies have one or more of the following limitations: (a) failure to study the PM device in its site of intended use, the home18,19,27,28; (b) low sample size16–21,27,28; (c) failure to collect oximetry data16–20,27,29; (d) no randomization of order of comparison18,19,27,28; and (d) no manual review of the raw PM data.16–20,27,29,30 Our validation addresses these limitations. It examines the PM device in both the home and laboratory settings, is adequately powered, includes both flow and oximetry data, avoids order bias, and assesses the impact of manual scoring of PM data on performance.
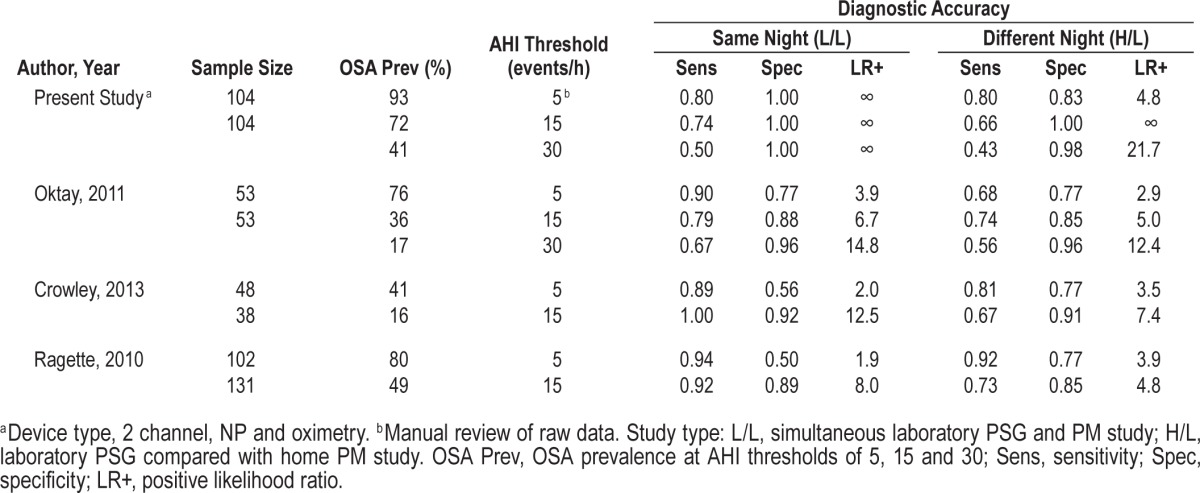
Some previous studies18,19,27,28 have validated this PM in the laboratory (i.e., concurrent with PSG) and reported good sensitivity (80% to 100%) to rule in OSA (AHI ≥ 5 events/h) but variable specificity (50% to 100%), with LR+ values ranging from 1.9 to infinity. Our study showed high diagnostic accuracy to rule in OSA with specificity 100% and LR+ infinity on the simultaneous night assessment. Other studies17,20,29 that have evaluated the device simultaneously with PSG in the laboratory, and at home have shown less agreement on the home study night (Table 5). Simultaneous night data showed high sensitivity in all studies (89% to 94%), but specificity was variable and LR+ values ranged from 1.9 to 3.9. The comparisons of PSG with the home study night showed moderate sensitivity in one study (68%)20 and good sensitivity in two studies (81% and 92%, respectively),17,29 comparable with the 80% observed in our study. Specificity was moderate in these previous studies (all 3 = 77%) compared with 83% in this study. Hence this study, which has carefully addressed the limitations of previously described studies, demonstrates that ApneaLink either meets (simultaneous laboratory comparison) or is close to meeting (home versus laboratory PSG comparison) the current recommended criteria15 for an acceptable device to rule in OSA in the clinical setting. Note that single channel oximetry using a 3% desaturation gave equivalent results to rule in moderate to severe OSA. However, to rule in mild OSA (AHI ≥ 5 events/h) the addition of the nasal pressure signal resulted in better specificity, and more cases were identified. Previous work published by our group has shown that oximetry alone is less helpful for lean patients.31 In patients with a low BMI, nasal pressure is likely to be a more discriminatory signal, as this group will have lesser arterial oxygen desaturation for given degrees of upper airway obstruction.
Table 5
Results from ApneaLink validation studies conducted in the recommended setting: PM study simultaneous with laboratory PSG (L/L) and PM study at home compared with laboratory PSG (H/L).
Several authors have used identity and Bland-Altman plots to illustrate the inherent bias between AHI PM and AHI PSG on one hand, and good agreement between repeated PM studies on the other.26,30,32 Our data confirm that even when studied with the same night and environment (Figure 2A), the PM consistently underestimates AHI PSG. The effect of a different study night is to increase the spread of data (Figure 2C; r = 0.84). By contrast, where the same equipment is used (Figure 2B), agreement is good despite the introduction of the potentially confounding variables of different night and environment. Thus the PM underestimated AHI PSG by 13.5 to 17.2 events/h, likely because of reliance on a different denominator (monitoring time for the PM versus sleep time for laboratory PSG) to calculate the AHI and/or the inability to score EEG arousal-related events for the PM study. This degree of underestimation is consistent with previous PM data, which showed that on average AHI PM was 10% lower than AHI PSG.33 The cases most likely to be missed (false negatives) are those with mild OSA since the inherent underestimation of the PM may recategorize mild cases below the diagnostic threshold for OSA (AHI < 5 events/h). False negative rates can be as high as 17%10 in unattended PM studies leading to the recommendation that PMs be used to rule in OSA in the setting of a high pretest probability.
For laboratory-based PSG it is generally recognized that a first-night effect results in poor sleep efficiency and underestimation of OSA,34–36 due to the large number of sensors applied, limiting sleep to the supine posture in an unfamiliar environment.34,35,37 Since most studies examining night-to-night variability have investigated laboratory PSG, first-night effect may well account for some of this variation. Part of the intuitive appeal for home PM relates to the notion of better quality sleep at home and a potentially more accurate diagnosis. Our results for the same individuals over different nights show low variability in PM device performance, even though one study was conducted in the laboratory simultaneous with PSG (Figure 3). Some studies (using laboratory PSG) have suggested that the variability is inversely proportional to the severity of OSA, with more severe OSA being more reliably diagnosed.35,38–40 However, most PM studies report no night-night change for OSA severity at a group level (mean AHI PSG/AHI PM) but note that misclassification can occur, with the degree dependent upon the cutoff used to define “disease.”41–43 Two well-designed studies using home PM results reported no bias between nights, first-night effect, or directional trend, suggesting that PM studies may minimize some of the variability of laboratory PSG.36,43 Our results are consistent with most other work indicating minimal or no first-night effect when using PM devices.36,43
We found no evidence of an order effect (p = 0.33). We hypothesized that subjects studied with laboratory PSG first may have had reduced sleep efficiency and consequent lower severity of OSA. Analysis of misclassifications showed more missed cases (AHI ≥ 5 events/h) in the PSG first group (24%) compared with the PM first group (11%), but these differences were not statistically significant (p = 0.08). The greater number of cases with mild OSA in the PSG first group increased the likelihood of misclassification. Other studies reporting misclassification have suggested that this is more prominent when a lower AHI cutoff is chosen to rule in disease, providing support for use of PM diagnosis for case selection where pretest probability is high.35,43
Strengths and Weaknesses
The largest barrier to the wide acceptance of PM diagnosis of OSA has been the lack of high quality, adequately powered research studies to strengthen the evidence base.11 A grading strategy recommended in the 2003 PM systematic review9 was further refined in 201115 to give clear guidance for grading evidence level12 and quality rating.15 According to this current scheme, our study ranked at level 1b, with two quality indicators not met. Data loss for the present PM study of 10.4% from patient-related failures and 3.7% from technical failures compares favorably to previous studies, with a recent meta-analysis reporting an overall 14.6% of poor recordings.33 In a recent targeted case finding study in the primary care setting (using the same PM device), 7% technical failure was reported.44 Consistent with our findings, the most common reasons cited for data loss were patient-related issues and partial or complete absence of data.
A good-quality study should have a high (> 90%) percentage of patients initially enrolled in the study completing it. Our percentage of patients completing the study was 75%, which, while lower than the desired benchmark, is perhaps more realistic given the heavy reliance upon voluntary patient compliance to complete the demanding full study protocol. Our results are comparable with those of three prior studies with a similar design (75%, 65%, and 65%, respectively).17,20,30 Early in data collection it was clear that the Group 1 subjects were prone to “study fatigue” since many failed to complete the final PM study (P3) at home despite encouragement. This phenomenon may help explain the paucity of adequately powered validation studies to date.
An advantage of our methodology was use of the same analysis platform to score the laboratory PSG and PM recordings by uploading the latter (via EDF) into our laboratory analysis system. Thus the same analytical tools were available for both PM and PSG data and minimized differences in signal interpretation.
Clinical guidelines have repeatedly made clear statements about the importance of manual data review of sleep studies based upon the premise that manual scoring is superior to automated analysis.10 Many studies have used the PM auto-analysis to determine their results, which appears an obvious inadequacy given the known high misclassification rate for unattended PM studies.10 Our study sought to minimize such misclassifications by application of standardized manual data review using the same computer platform for both PM and PSG data. We found without exception that manual analysis resulted in fewer missed cases, with percentage reductions ranging from 4% (AHI ≥ 5 events/h) to 18% (AHI ≥ 30 events/h; Table 4). Unfortunately, our study was not powered to assess the difference in accuracy between auto-analysis and manual scoring, and this difference did not reach statistical significance. However, our results are consistent with those of a recent validation study (ApneaLink Ox) which demonstrated that manual scoring was superior to automatic scoring to rule in OSA.21 The improved accuracy of manual scoring is of high clinical importance since the goal of the diagnostic test is to optimize case finding.
An acknowledged limitation of PM studies is the potential for misclassification of cases. Our study confirmed that cases with mild OSA can be missed with a PM study. It is important to adhere to a clear clinical pathway, such that subjects with a high pretest probability of OSA but a negative PM test result have a follow up PSG.10 Further limitations of type 4 devices, such as the inability to identify body position and central apnea events should be considered when addressing the appropriate PM device to incorporate into a clinical service.
Our study addresses a gap in the literature as, to our knowledge, there has not been a validation study of a two-channel type 4 PM device to date which has fulfilled all current recommended study quality criteria and met device validation guidelines.9,10,15 In the most recent review of PM devices15, those with a minimum of two channels (including oximetry) were graded and evaluated according to a standard set of criteria. It was stated that the strongest evidence for a PM device is when tested concurrently with laboratory PSG and in the unattended home setting. Of 11 studies conducted in the recommended setting, only one study (type 3 device) met the defined criteria to rule in OSA (AHI ≥ 5 events/h) with 95% confidence. Based on the strength of evidence from the study, in 2013 the AASM gave approval for the manufacturer to use this type 3 device in the unattended setting in the US.45 Of the ten prior validation studies of the PM device used in this study, three were conducted in the recommended settings of laboratory and home.17,20,29 Comparison of these results (Table 5) revealed a consistent loss of diagnostic accuracy in the home setting relative to laboratory PSG, reinforcing the view that a PM device must be validated in the setting of its intended use.
Clinical Relevance
Our results are directly applicable to a clinic population with a high pretest probability of OSA. Indeed, the experimental design simulated clinical use within our sleep service with the degree and detail of instruction given to patients in the study, exactly as intended in a standard clinical setting. We have confirmed that the PM device can accurately rule in OSA at home in patients with a high pretest probability of disease. Our clinic population has a high prevalence (94%) of OSA, hence a LR+ of 1.8 would suffice to rule in OSA and produce a posttest probability of over 95%. It is important that this device is used with an appreciation of the pretest probability of the target patient group. Providing this is 80% or more, then the device will be adequate to rule in disease.15 However, where the PM study result is negative, the clinical diagnostic pathway must include PSG to minimize missed cases of mild disease.10 The most recent report on research priorities for ambulatory management of OSA concluded that more high quality evidence was required to support the use of PM devices within current practice.11 More work is needed to address the limitations of PM studies, such as misclassification and the cost of repeat studies. Our study highlights the potential to use type 4 devices in incorporating ambulatory management into practice alongside PSG, and validates the performance of type 4 devices as meeting currently recommended guidelines. The inclusion of a PM diagnostic pathway within a busy clinical service may reduce the need for in-laboratory PSG beds and facilitate more efficient use of healthcare resources.
CONCLUSION
This study illustrates the utility of a simple diagnostic device in confirming the diagnosis of OSA where it is suspected on clinical grounds in the setting of a high pretest probability population. Such devices have the potential to facilitate the expeditious diagnosis and treatment of OSA, an under-diagnosed condition with substantial associated morbidity. There is an urgent need for alternative approaches to the diagnosis of OSA due to the limited availability of PSG facilities relative to the prevalence of the condition.11 While keeping in mind the limitations of ambulatory management of OSA, type 4 PM devices have an important potential role in addressing this gap, and manual data review will ensure optimal case finding.
DISCLOSURE STATEMENT
This was an industry supported study. ResMed Ltd sponsored the study but did not influence study design, data collection or interpretation of the outcome data. ApneaLink devices and associated consumables were donated by ResMed Corporation. Kim Ward is a PhD student in receipt of a grant that has provided scholarship support and funds for study costs. Dr. Hillman has conducted sponsored research for ResMed Ltd and provided medical advice on the Medical Advisory Committee for Apnex Incorporated. The other authors have indicated no financial conflicts of interest.
ACKNOWLEDGMENTS
The authors gratefully acknowledge the patients who have participated in this study and thank the staff at WASDRI, Sir Charles Gairdner Hospital, Nedlands, Western Australia. Kim Ward was supported by an Australian Postgraduate Award and Ad Hoc scholarships from the Sir Charles Gairdner Research Foundation and ResMed Ltd.
ABBREVIATIONS
| AASM | American Academy of Sleep Medicine |
| AHI | apnea-hypopnea index, events/h |
| AHI PM | apnea-hypopnea index for portable monitor study |
| AHI PSG | apnea-hypopnea index for laboratory PSG |
| ARI | arousal index, events/h |
| BMI | body mass index, kg/m2 |
| BRPT | Board of Registered Polysomnographic Technologists |
| ECG | electrocardiogram |
| EEG | electroencephalograph |
| EMG | electromyogram |
| EOG | electro-oculogram |
| ESS | Epworth Sleepiness Score |
| IQR | interquartile range |
| LR− | negative likelihood ratio |
| LR+ | positive likelihood ratio |
| OSA | obstructive sleep apnea |
| P1 | a portable study conducted at home two weeks prior to PSG |
| P2 | a portable study conducted simultaneous with laboratory PSG |
| P3 | a portable study conducted at home within 2 weeks after PSG |
| PM | portable monitor |
| PSG | polysomnography |
| SpO2 | arterial oxygen saturation, % |
| WASDRI | West Australian Sleep Disorders Research Institute |
| WASHS | West Australian Sleep Health Study |
REFERENCES
Articles from Journal of Clinical Sleep Medicine : JCSM : Official Publication of the American Academy of Sleep Medicine are provided here courtesy of American Academy of Sleep Medicine
Full text links
Read article at publisher's site: https://doi.org/10.5664/jcsm.4600
Read article for free, from open access legal sources, via Unpaywall:
https://jcsm.aasm.org/doi/pdf/10.5664/jcsm.4600
Citations & impact
Impact metrics
Citations of article over time
Alternative metrics
Smart citations by scite.ai
Explore citation contexts and check if this article has been
supported or disputed.
https://scite.ai/reports/10.5664/jcsm.4600
Article citations
Mandibular Jaw Movement Automated Analysis for Oral Appliance Monitoring in Obstructive Sleep Apnea: A Prospective Cohort Study.
Ann Am Thorac Soc, 21(5):814-822, 01 May 2024
Cited by: 2 articles | PMID: 38330168 | PMCID: PMC11109906
Accuracy and usability of AcuPebble SA100 for automated diagnosis of obstructive sleep apnoea in the home environment setting: an evaluation study.
BMJ Open, 11(12):e046803, 21 Dec 2021
Cited by: 8 articles | PMID: 34933855 | PMCID: PMC8693096
The prevalence and comorbidities of obstructive sleep apnea in middle-aged men and women: the Busselton Healthy Ageing Study.
J Clin Sleep Med, 17(10):2029-2039, 01 Oct 2021
Cited by: 20 articles | PMID: 34606440 | PMCID: PMC8494083
A machine learning-based test for adult sleep apnoea screening at home using oximetry and airflow.
Sci Rep, 10(1):5332, 24 Mar 2020
Cited by: 19 articles | PMID: 32210294 | PMCID: PMC7093547
Design and Evaluation of a Non-ContactBed-Mounted Sensing Device for AutomatedIn-Home Detection of Obstructive Sleep Apnea:A Pilot Study.
Biosensors (Basel), 9(3):E90, 22 Jul 2019
Cited by: 7 articles | PMID: 31336678 | PMCID: PMC6784712
Go to all (18) article citations
Similar Articles
To arrive at the top five similar articles we use a word-weighted algorithm to compare words from the Title and Abstract of each citation.
Effectiveness of Portable Monitoring Devices for Diagnosing Obstructive Sleep Apnea: Update of a Systematic Review
Agency for Healthcare Research and Quality (US), Rockville (MD), 12 Jun 2015
Cited by: 0 articles | PMID: 26065047
ReviewBooks & documents Free full text in Europe PMC
Management of sleep apnea without high pretest probability or with comorbidities by three nights of portable sleep monitoring.
Sleep, 37(8):1363-1373, 01 Aug 2014
Cited by: 28 articles | PMID: 25083017 | PMCID: PMC4096206
Validation of the Nox-T3 Portable Monitor for Diagnosis of Obstructive Sleep Apnea in Patients With Chronic Obstructive Pulmonary Disease.
J Clin Sleep Med, 15(4):587-596, 15 Apr 2019
Cited by: 21 articles | PMID: 30952218 | PMCID: PMC6457504
[Utility of the type 3 portable monitor for the diagnosis of patients with obstructive sleep apnea].
Zhonghua Yi Xue Za Zhi, 99(38):2994-2999, 01 Oct 2019
Cited by: 1 article | PMID: 31607031
