Abstract
Rationale and objectives
There have been a large number of case-control studies using diffusion tensor imaging (DTI) in amyotrophic lateral sclerosis (ALS). The objective of this study was to perform an individual patient data (IPD) meta-analysis for the estimation of the diagnostic accuracy measures of DTI in the diagnosis of ALS using corticospinal tract data.Materials and methods
MEDLINE, EMBASE, CINAHL, and Cochrane databases (1966-April 2011) were searched. Studies were included if they used DTI region of interest or tractography techniques to compare mean cerebral corticospinal tract fractional anisotropy values between ALS subjects and healthy controls. Corresponding authors from the identified articles were contacted to collect individual patient data. IPD meta-analysis and meta-regression were performed using Stata. Meta-regression covariate analysis included age, gender, disease duration, and Revised Amyotrophic Lateral Sclerosis Functional Rating Scale scores.Results
Of 30 identified studies, 11 corresponding authors provided IPD and 221 ALS patients and 187 healthy control subjects were available for study. Pooled area under the receiver operating characteristic curve (AUC) was 0.75 (95% CI: 0.66-0.83), pooled sensitivity was 0.68 (95% CI: 0.62-0.75), and pooled specificity was 0.73 (95% CI: 0.66-0.80). Meta-regression showed no significant differences in pooled AUC for each of the covariates. There was moderate to high heterogeneity of pooled AUC estimates. Study quality was generally high. Data from 19 of the 30 eligible studies were not ascertained, raising possibility of selection bias.Conclusion
Using corticospinal tract individual patient data, the diagnostic accuracy of DTI appears to lack sufficient discrimination in isolation. Additional research efforts and a multimodal approach that also includes ALS mimics will be required to make neuroimaging a critical component in the workup of ALS.Free full text

Diagnostic Accuracy of Diffusion Tensor Imaging in Amyotrophic Lateral Sclerosis: A Systematic Review and Individual Patient Data Meta-Analysis
Abstract
Rationale and Objectives
There have been a large number of case-control studies using diffusion tensor imaging (DTI) in amyotrophic lateral sclerosis (ALS). The objective of this study was to perform an individual patient data (IPD) meta-analysis for the estimation of the diagnostic accuracy measures of DTI in the diagnosis of ALS using corticospinal tract data.
Materials and Methods
MEDLINE, EMBASE, CINAHL, and Cochrane databases (1966–April 2011) were searched. Studies were included if they used DTI region of interest or tractography techniques to compare mean cerebral corticospinal tract fractional anisotropy values between ALS subjects and healthy controls. Corresponding authors from the identified articles were contacted to collect individual patient data. IPD meta-analysis and meta-regression were performed using Stata. Meta-regression covariate analysis included age, gender, disease duration, and Revised Amyotrophic Lateral Sclerosis Functional Rating Scale scores.
Results
Of 30 identified studies, 11 corresponding authors provided IPD and 221 ALS patients and 187 healthy control subjects were available for study. Pooled area under the receiver operating characteristic curve (AUC) was 0.75 (95% CI: 0.66–0.83), pooled sensitivity was 0.68 (95% CI: 0.62–0.75), and pooled specificity was 0.73 (95% CI: 0.66–0.80). Meta-regression showed no significant differences in pooled AUC for each of the covariates. There was moderate to high heterogeneity of pooled AUC estimates. Study quality was generally high. Data from 19 of the 30 eligible studies were not ascertained, raising possibility of selection bias.
Conclusion
Using corticospinal tract individual patient data, the diagnostic accuracy of DTI appears to lack sufficient discrimination in isolation. Additional research efforts and a multimodal approach that also includes ALS mimics will be required to make neuroimaging a critical component in the workup of ALS.
Amyotrophic lateral sclerosis (ALS) is a fatal degenerative motor neuron disease involving the motor cortex, corticospinal tract (CST), and spinal anterior horn neurons. Clinical presentation of the disease is variable, contributing diagnostic uncertainty and delay (1). More than 40% of ALS patients undergo inappropriate medical treatment, including surgery (2). Electromyography can help confirm the diagnosis of lower motor neuron involvement. There is a high interest in developing upper motor neuron diagnostic biomarkers to facilitate an accurate diagnosis at an earlier stage (3–5).
A promising biomarker for ALS is diffusion tensor imaging (DTI), an advanced magnetic resonance imaging (MRI) application. Fractional anisotropy (FA), a scalar measurement of water diffusivity, is a key DTI metric. FA reductions have been reported in diseases that degrade white matter tracts, including ALS (6). Although several studies have reported FA decreases in ALS patients, only a few have addressed test accuracy measures with relative small subject numbers (7–13). We have recently completed a group-level meta-analysis of test accuracy measures of DTI for the diagnosis of ALS (14). However, individual patient data (IPD) meta- analysis approaches are generally considered superior to group-level approaches because more rigorous statistical methods can be employed, including covariate adjustment (15,16). Our study objective was to compare ALS patients who underwent DTI to healthy controls to determine diagnostic accuracy measures of FA using IPD meta-analysis techniques.
METHODS
Eligibility Criteria
We conducted MEDLINE (1966–April 2011), EMBASE (1999–April 2011), CINAHL (1999–April 2011), and Cochrane (2005–April 2011) searches. Search keywords included: amyotrophic lateral sclerosis, Lou Gehrig's, magnetic resonance imaging, diagnostic imaging, diagnostic tests, diffusion tensor imaging, or fractional anisotropy. Full electronic search for MEDLINE is presented in Appendix Table 1. There were no language restrictions. A manual search of reference lists from identified articles was performed.
Eligible studies fulfilled the following criteria: 1) human studies and 2) use of DTI region of interest (ROI) or tractography techniques to compare brain mean FA values along the CST between ALS subjects and healthy controls (HC). We excluded voxel-based morphometry analysis studies and case studies.
Selection and Quality Assessment
Two authors (B.R.F., M.P.) independently assessed each abstract for inclusion and retrieved full publications for further evaluation, independently reviewed each article, and reached final consensus for inclusion. The same reviewers independently assessed study quality based on Quality Assessment of Diagnostic Accuracy Studies criteria (17). Each of these criteria were scored as “yes,” “no,” or “unclear.” Any disagreements between reviewers were resolved by discussion and consensus.
Data Extraction and Synthesis
Two authors (B.R.F., M.P.) abstracted the following information: author, journal, publication year, number of subjects, demographics and clinical subject characteristics, MRI field strength, DTI parameters, and FA analysis method. Corresponding authors from the identified publications were e-mailed three times separated by 2-week intervals to determine willingness to contribute IPD. Requested data included mean FA values for CST per subject with corresponding age, gender, disease duration (for ALS subjects) and Revised Amyotrophic Lateral Sclerosis Functional Rating Scale (ALSFRS-R) score (for ALS subjects). To minimize heterogeneity, we used only average CST or internal capsule (IC) FA data even if studies interrogated other brain regions.
Retrospective Study
We retrospectively identified 14 patients (9 males, age 61.9 ± 9.7 years) who met El Escorial criteria (18) for definite or probable ALS and underwent 3T diagnostic brain MRI (Philips Achieva, Best, Netherlands). Fourteen age- and gender-matched HCs (8 males, age 58.4 ± 6.4 years) were included. Our institutional review board approved all study protocols (HUM00050553). Diffusion-weighted imaging was obtained using multiple shot spin-echo technique (repetition time/echo time = 7075/62 ms, 2 mm isotropic resolution, b values = 0, 800 s/mm2, 15 gradients). Data processing was performed using ExploreDTI v4.8.2 employing motion and eddy current correction. Fiber tracking used the standard deterministic stream method with seed ROIs in the posterior limb of IC and pons using detailed white-matter atlases. Mean FA values of right and left CST were averaged. Results are listed as Foerster.
Statistical Analysis
Study level analysis: analysis occurred at the individual participant level using Stata version 12.0 (StataCorp). We applied binormal receiver operating characteristic (ROC) curve analysis and the Youden index using a linear mixed model to assign individual study cut points to calculate sensitivity and specificity. The prevailing hypothesis is that FA reduction along the CST in ALS is due to loss of fiber integrity/axonal degeneration (10,19). Thus, by convention, we assigned “positive” disease status for FA values below the individual study cut point and “negative” disease status for FA values above the individual study cut point. ROC curves and areas under the ROC curve (AUC) were generated for each study.
Meta-analysis model: using midas and the metan modules, we generated 1) summary ROC curve based on bivariate binomial regression of study-specific estimates of true-positive, true-negative, false-positive, and false-negative data (20,21) and 2) forest plots for AUC, sensitivity, and specificity including 95% confidence intervals (CI). We performed AUC meta-regression analysis using a binormal mixed model with individual covariate analyses for age, gender, disease duration, and ALSFRS-R scores. We also calculated a nonadjusted AUC for the respective study data sets.
We assessed heterogeneity using the I2 statistic, a measure of variation between studies resulting from study differences rather than chance error. I2 values <25% are considered low and I2 values >75% are considered high (22). We evaluated publication bias using a funnel plot and linear regression of AUC versus the corresponding study's standard error measurement, with P < .05 indicating significant asymmetry.
RESULTS
Study Selection
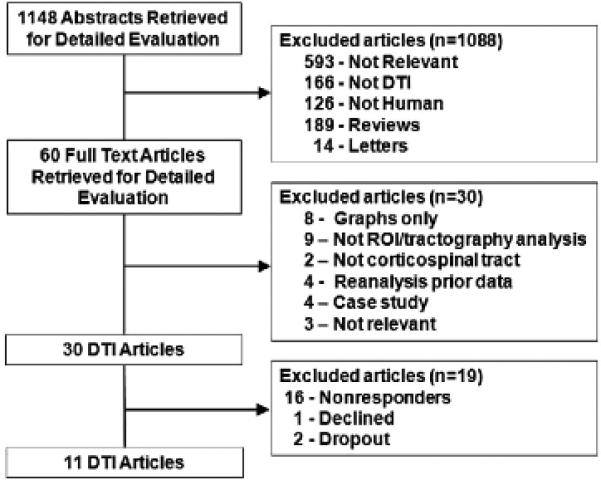
We provide the number of studies screened, assessed for eligibility, and included for review with reasons for exclusions at each stage in Figure 1. We collected individual patient data from 11 of 30 identified studies.
Study Characteristics
Study characteristics of the studies are summarized in Table 1 with additional study details in Appendix Table 2 (7,8,13,19,23–29). Studies enrolled 221 ALS subjects and 187 HCs. Equipment, DTI parameters, and analysis methods varied across studies. All studies based ALS diagnosis on the El Escorial criteria (18). Age and gender covariate data were available in 10 studies, ALSFRS-R covariate data were available in nine studies and disease duration covariate data were available in eight studies.
Table 1
Individual Study Characteristics
| Study Number | Author | MRI | B Value | Number of Directions | Analysis Method | Brain Region | Average Disease Duration (months) |
|---|---|---|---|---|---|---|---|
| 1 | Cartels (23) | 2.9 T | 1000 | 24 | ROI-ti actography | CST* | 20 ± 10 |
| 2 | Ciccarelli (24) | 1.5 T | 1150 | 54 | Tractography | CST | 21 ± 16 |
| 3 | Cosottini (19) | 1.5 T | 1000 | 25 | ROI-visual | CST | 33 ± 20 |
| 4 | Cosottini (7) | 1.5 T | 1000 | 31 | ROI-visual | CST | 17 ± 13 |
| 5 | Ellis (25) | 1.5 T | 620 | 7 | ROI-visual | CST | 27 ± 26 |
| 6 | Filippini (8) | 3.0 T | 1000 | 60 | Tractography | CST* | 49 ± 38 |
| 7 | Foerster | 3.0 T | 800 | 15 | Tractography | CST* | 25 ± 15 |
| 8 | Metwalli (26) | 3.0 T | 1000 | 64 | ROI-visual | IC*,y | 26 ± 15 |
| 9 | Pyra (13) | 1.5 T | 1000 | 6 | ROI-visual | IC*,y | 25 ± 17 |
| 10 | Roccatagliata (27) | 1.5 T | 1000 | 51 | ROI-visual | IC* | 12 ± 6 |
| 11 | Senda (28) | 3.0 T | 700 | 6 | ROI-tractography | IC* | 20 ± 9 |
| 12 | Wang (29) | 3.0 T | 1000 | 12 | ROI-tractography | IC | 20 ± 20 |
CST, average corticospinal tract; IC, internal capsule; MRI, magnetic resonance imaging; ROI, region of interest.
Meta-Analysis of Sensitivity, Specificity, and AUC
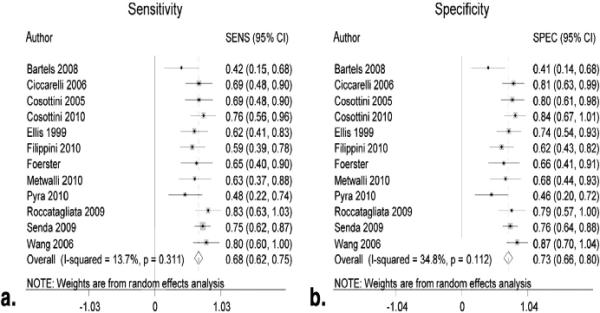
Figure 2 shows the summary ROC curve. Figures 3 and and44 show forest plots for AUC and sensitivity/specificity measures, respectively. The pooled AUC was 0.75 (95% CI: 0.66–0.83), the pooled sensitivity was 0.68 (95% CI: 0.62–0.75), and the pooled specificity was 0.73 (95% CI: 0.66–0.80).
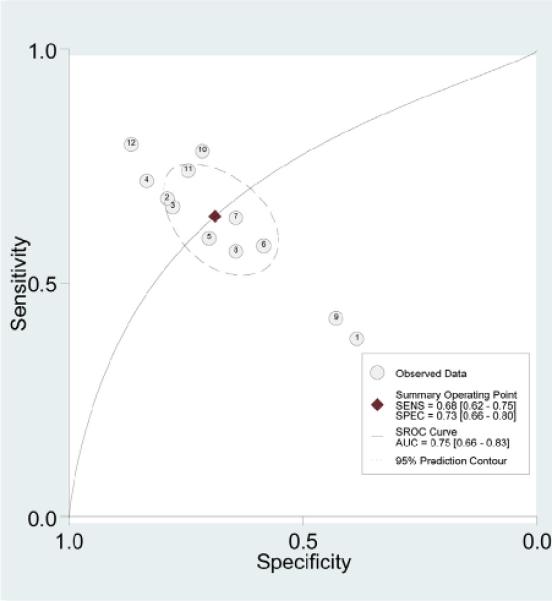
Area under summary receiver operating characteristic (SROC) curve for diffusion tensor imaging fractional anisotropy values. Each circle represents an individual study result. Dashed circle represents 95% prediction interval of summary sensitivity (SENS) and specificity (SPEC). AUC, area under the curve.
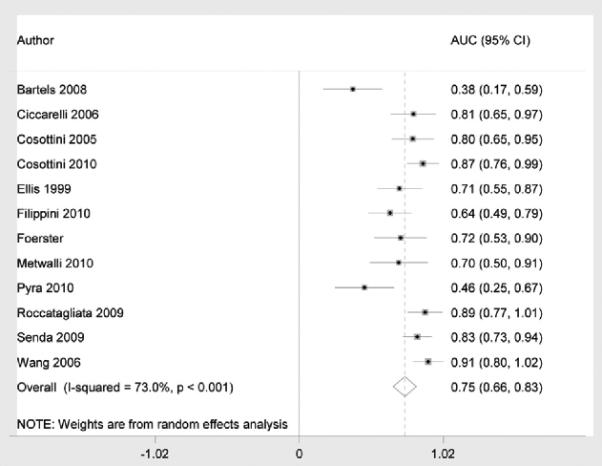
Forest plot of area under the curve (AUC) for amyotrophic lateral sclerosis diagnosis using diffusion tensor imaging fractional anisotropy values.
AUC Meta-analysis Using Covariates
Table 2 shows results of the meta-analysis incorporating each of the subject covariate information including age, gender, ALSFRS-R score, and disease duration for the studies in which the data were available. Adjusted confidence intervals overlapped with nonadjusted confidence intervals for each of the covariates.
TABLE 2
AUC Measures with Covariates
| Age | Gender | ALSFRS-R | Disease Duration | |
|---|---|---|---|---|
| Included study numbers* | 1, 2, 5-12 | 1, 2, 5-12 | 1-4, 6, 7, 9, 10, 12 | 1, 2, 4, 5, 7, 9, 10, 12 |
| Nonadjusted AUC | 0.58 (0.32-0.84) | 0.58 (0.32-0.84) | 0.65 (0.47-0.84) | 0.61 (0.36-0.85) |
| Adjusted AUC | 0.58 (0.31-0.85) | 0.58 (0.32-0.85) | 0.58 (0.40-0.77) | 0.61 (0.37-0.86) |
ALSFRS-R, Revised Amyotrophic Functional Rating Scale; AUC, area under curve.
Predictive Values
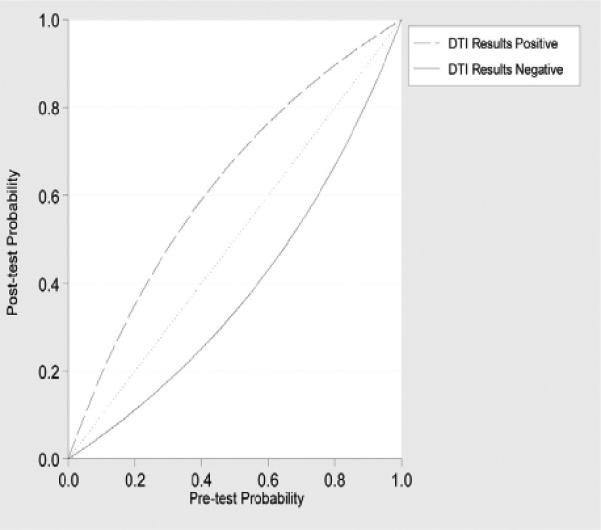
Using pooled estimates, positive likelihood ratio was 2.52 and negative likelihood ratio was 0.44. Using Bayesian techniques, we show posttest probabilities of disease after negative and positive DTI results using different disease pretest probabilities in Figure 5.
Study Quality, Publication Bias, and Heterogeneity
Study quality was generally high across the studies (Fig 6). Funnel plot and regression tests (P = .001) demonstrate evidence of significant publication bias (Fig 7). Between-study AUC heterogeneity was at least moderate (I2 = 73%). Between-study sensitivity heterogeneity was low (I2 = 14%) and between-study specificity heterogeneity was moderate (I2 = 35%).
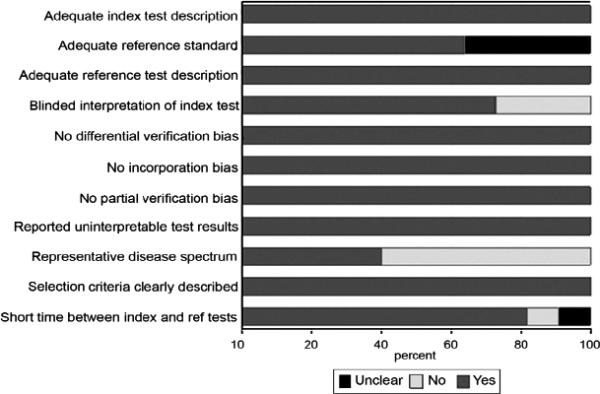
Study quality scores. Graph illustrates study quality based on Quality Assessment of Diagnostic Accuracy Studies criteria, expressed as a percent of studies meeting each criterion.

Assessing publication bias. The funnel plot horizontal axis expresses treatment effect; in this instance, measured by area under the receiver operating characteristic curve (AUC). The vertical axis expresses study size, as measured by standard error (SE). Studies with larger standard errors have a wider confidence interval. The graphed vertical line represents the observed mean AUC and the dashed lines represent the 95% confidence limits for the expected distribution for published studies. The points represent the observed distribution of the published studies. Visual inspection demonstrates the presence of publication bias with several of the studies outside the 95% confidence limits. Further, the plot demonstrates that studies with larger standard errors have lower test performance (ie, AUC).
DISCUSSION
Conventional MRI findings in ALS are neither sensitive nor specific (30). Therefore, there has been great interest in using advanced neuroimaging methods such as DTI as diagnostic ALS biomarkers. Quantitative meta-analysis is necessary to properly evaluate the potential of new technologies to serve as diagnostic tests, particularly in the setting of imaging studies, which include relatively small numbers of subjects. Based on the available IPD, the meta-analysis results suggest that the mean FA within the CST provides relatively low diagnostic accuracy as an independent test for ALS.
The pooled DTI test accuracy measures including sensitivity, specificity, and AUC are relatively modest for the diagnosis of ALS. From a clinical perspective, these results are better illustrated using the Bayesian plot of posttest probabilities given different pretest disease probabilities. For example, a patient with a 0.50 pretest probability of disease based on clinical suspicion has a 0.68 posttest probability of ALS with a positive DTI test result and a 0.33 posttest probability of ALS with a negative DTI test result. Our retrospective dataset of 14 ALS subjects fell in the mid-range of the test accuracy measurements. Based on the confidence intervals, there were no significant differences between the covariate adjusted and nonadjusted meta-regression analysis. AUC values for the covariate adjusted and nonadjusted analyses were lower than the “overall” summary AUC estimate from the entire 12 datasets. This reflects the exclusion of the study cohorts that had greater test discrimination because of the lack of the respective covariate data.
Our meta-analysis raises a number of important issues. The high level of AUC heterogeneity reflects the variability between studies likely the result of differences in patient populations, MRI equipment, and imaging protocols including different TE and b-values (31) as well as analytical approaches. Consensus guidelines for ALS MRI studies such as those proposed by the Neuroimaging Symposium in ALS are needed (6). Even if more uniform studies are performed, this study suggests that DTI in isolation lacks sufficient diagnostic power. An integrated functional, as well as a structural, advanced MRI approach offers promise in this regard (32). Although our results from this IPD meta- analysis are not significantly different from our previously published group-level meta-analysis (14), the IPD statistical methods allow for greater statistical flexibility and power both in terms of adjusting for patient's characteristics and determining optimal cut points (33). As a result, IPD is considered the best meta-analysis methodology (34) and thus these reported results add significant credibility to our prior published findings.
Our study has several limitations. We used only data from published manuscripts in this meta-analysis. Data from 19 of the 30 eligible studies were not ascertained, raising the possibility of selection bias. Six of the studies had funding support; two of these six studies had AUC values less than 0.50, suggesting a limited role of funding bias. Several of the datasets did not contain all of the covariates. More than half of the studies did not have a representative disease spectrum of what would be expected in clinical practice, and it must be acknowledged that the differentiation of ALS patients from healthy individuals is not the clinical conundrum facing the clinician. However, DTI may have a role as a diagnostic test for those patients who do not yet have clinically definite signs of ALS if the test accuracy measures are sufficiently high. Several of the studies did not meet the 20 direction acquisition standard necessary for robust FA estimation adding variability to the results (35). Given the provided datasets and our protocol, we focused on the IC and the average CST mean FA measures to minimize heterogeneity. A few of the studies analyzed other specific motor tract regions, including Pyra et al (13), who found the greatest discriminatory power in the precentral gyrus (AUC = 0.79). We did not perform a meta-analysis of these other motor regions because of data paucity. Furthermore, this study did not consider the detection of extra-motor DTI changes, which may provide greater diagnostic accuracy when combined with CST measures. We were also unable to investigate other summary FA measures that have greater disease discrimination, such as the top quartile mean FA (24).
In conclusion, this IPD meta-analysis of test accuracy suggests that DTI of the CST, in isolation, provides limited diagnostic test accuracy for ALS patients versus healthy controls. Adjusting for age, gender, functional status, and disease duration did not significantly change the pooled AUC measures. There is a need for more uniform neuroimaging studies of ALS combining multiple advanced methods, implementing new brain pattern recognition techniques, and involving specific ALS mimics to enable meaningful clinical implementation of MRI.
Supplementary Material
App Table 1
App Table 2
ACKNOWLEDGMENTS
M.B. thanks Dr. John D. Carew and Dr. Govind Nair for their contributions to the article. C.E. thanks Prof. P.N. Leigh and Dr. Andy Simmons for their contributions to the article. B.R.F. thanks the Johns Hopkins Graduate Training Programs in Clinical Investigation for its mentorship. The Ciccarelli et al study was performed using a 1.5 T scanner funded by the MS Society of Great Britain and Northern Ireland and by the Department of Health National Institute of Health Research Biomedical Research funding scheme. The Ellis et al study was funded by Motor Neurone Disease Association UK and Action Research.
REFERENCES
Full text links
Read article at publisher's site: https://doi.org/10.1016/j.acra.2013.03.017
Read article for free, from open access legal sources, via Unpaywall:
https://europepmc.org/articles/pmc4384461?pdf=render
Citations & impact
Impact metrics
Citations of article over time
Article citations
Multimodal MRI improves diagnostic accuracy and sensitivity to longitudinal change in amyotrophic lateral sclerosis.
Commun Med (Lond), 3(1):84, 16 Jun 2023
Cited by: 1 article | PMID: 37328685 | PMCID: PMC10276031
<sup>18</sup>F-FDG PET/CT as a molecular biomarker in the diagnosis of amyotrophic lateral sclerosis associated with prostate cancer and progressive supranuclear palsy: A case report.
Front Nucl Med, 3:1137875, 17 Apr 2023
Cited by: 0 articles | PMID: 39355053 | PMCID: PMC11440934
The Prediction of Neurological Prognosis for Cervical Spondylotic Myelopathy Using Diffusion Tensor Imaging.
Neurospine, 20(1):248-254, 31 Mar 2023
Cited by: 2 articles | PMID: 37016871 | PMCID: PMC10080413
Multiparametric Microstructural MRI and Machine Learning Classification Yields High Diagnostic Accuracy in Amyotrophic Lateral Sclerosis: Proof of Concept.
Front Neurol, 12:745475, 17 Nov 2021
Cited by: 8 articles | PMID: 34867726 | PMCID: PMC8637840
Biomedical signals and machine learning in amyotrophic lateral sclerosis: a systematic review.
Biomed Eng Online, 20(1):61, 15 Jun 2021
Cited by: 8 articles | PMID: 34130692 | PMCID: PMC8207575
Review Free full text in Europe PMC
Go to all (52) article citations
Data
Data behind the article
This data has been text mined from the article, or deposited into data resources.
BioStudies: supplemental material and supporting data
Similar Articles
To arrive at the top five similar articles we use a word-weighted algorithm to compare words from the Title and Abstract of each citation.
Diagnostic accuracy using diffusion tensor imaging in the diagnosis of ALS: a meta-analysis.
Acad Radiol, 19(9):1075-1086, 28 Jun 2012
Cited by: 32 articles | PMID: 22749050 | PMCID: PMC4337857
Evaluation of corticospinal tract impairment in the brain of patients with amyotrophic lateral sclerosis by using diffusion tensor imaging acquisition schemes with different numbers of diffusion-weighting directions.
J Comput Assist Tomogr, 34(5):746-750, 01 Sep 2010
Cited by: 15 articles | PMID: 20861779
Altered white matter microarchitecture in amyotrophic lateral sclerosis: A voxel-based meta-analysis of diffusion tensor imaging.
Neuroimage Clin, 19:122-129, 04 Apr 2018
Cited by: 25 articles | PMID: 30035009 | PMCID: PMC6051469
A meta-analysis of diffusion tensor imaging studies in amyotrophic lateral sclerosis.
Neurobiol Aging, 33(8):1833-1838, 28 May 2011
Cited by: 45 articles | PMID: 21621298
Review
Funding
Funders who supported this work.
Medical Research Council (2)
Developing The Oxford Study for Biomarkers in Motor Neuron Disease (BioMOx): Capturing pre-symptomatic events and advancing clinical translation
Professor Martin Turner, University of Oxford
Grant ID: MR/K01014X/1
Sampling, biomarker OPtimization and Harmonization In ALS (SOPHIA)
Professor Martin Turner, University of Oxford
Grant ID: MR/K000780/1
Motor Neurone Disease Association (1)
Developing the Oxford study for biomarkers in Motor Neurone Disease (BioMOx2): Capturing pre-symptomatic events and advancing clinical translation
Professor Martin Turner, University of Oxford
Grant ID: TURNER/JAN13/944-795
NCRR NIH HHS (1)
Grant ID: P41 RR015241
NIBIB NIH HHS (3)
Grant ID: P41 EB015909
Grant ID: K25 EB003491
Grant ID: T32 EB006351
NIMH NIH HHS (2)
Grant ID: R21 MH082322
Grant ID: R21 MH087799
