| PMC full text: | Published online 2015 Jul 15. doi: 10.1073/pnas.1511910112 |
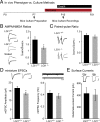
Fig. 1.
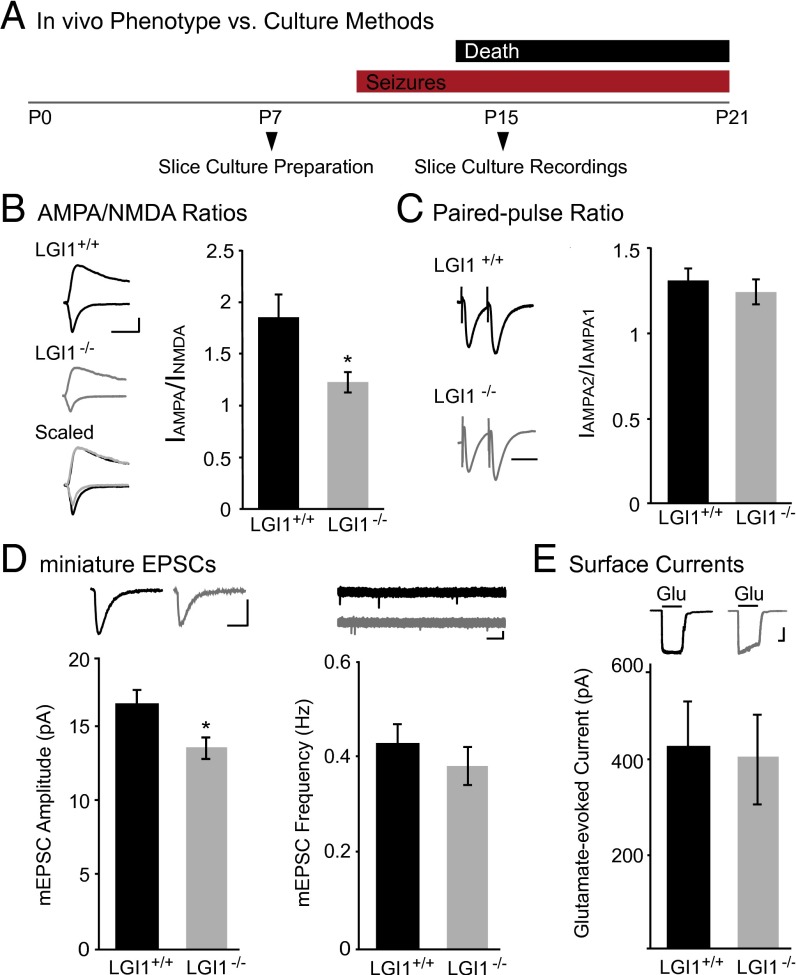
Loss of LGI1 reduces synaptic, but not surface, AMPAR content. (A) Timeline of experimental preparation for hippocampal slice cultures and recordings (Bottom) compared with the LGI1−/− phenotype (Top). (B) AMPA/NMDA ratios recorded in slice cultures made from LGI1−/− mice are significantly reduced (P = 0.03, n = 15) compared with wild type. (Left) Sample traces of wild type (black) and LGI1−/− (gray). (Scale bar, 50 ms and 50 pA.) (Right) Bar graphs showing average AMPA/NMDA ratios ± SEM in wild type and LGI1−/−. (C) Paired-pulse stimulation reveals no significant difference (P = 0.46, n = 16 wild type, 17 LGI1−/−) in presynaptic release probability in LGI1−/− relative to wild type. (Left) Sample traces normalized to first-response amplitude in wild-type cell. (Scale bar, 40 ms.) (Right) Average ratio ± SEM (D) Miniature EPSC recordings in wild type and LGI1−/−. Loss of LGI1 results in a significant decrease in amplitude (P = 0.03, n = 21), but not frequency (P = 0.17, n = 21), of mEPSCs. Bar graphs of average amplitude and frequency of mEPSCs ± SEM, with sample traces for each condition shown above. [Scale bars, 25 ms (amplitude traces), 100 ms (frequency traces), and 10 pA.] (E) Somatic outside-out patch recordings in wild-type and LGI1−/− cells have similar glutamate-evoked currents (P = 0.92, n = 13). (Top) Sample traces of wild-type and LGI1−/− surface currents. (Scale bars, 1 s and 100 pA.) (Bottom) Average glutamate-evoked currents ± SEM.
