Abstract
Free full text

KymographClear and KymographDirect: two tools for the automated quantitative analysis of molecular and cellular dynamics using kymographs
Associated Data
Abstract
Dynamic processes are ubiquitous and essential in living cells. To properly understand these processes, it is imperative to measure them in a time-dependent way and analyze the resulting data quantitatively, preferably with automated tools. Kymographs are single images that represent the motion of dynamic processes and are widely used in live-cell imaging. Although they contain the full range of dynamics, it is not straightforward to extract this quantitative information in a reliable way. Here we present two complementary, publicly available software tools, KymographClear and KymographDirect, that have the power to reveal detailed insight in dynamic processes. KymographClear is a macro toolset for ImageJ to generate kymographs that provides automatic color coding of the different directions of movement. KymographDirect is a stand-alone tool to extract quantitative information from kymographs obtained from a wide range of dynamic processes in an automated way, with high accuracy and reliability. We discuss the concepts behind these software tools, validate them using simulated data, and test them on experimental data. We show that these tools can be used to extract motility parameters from a diverse set of cell-biological experiments in an automated and user-friendly way.
INTRODUCTION
Different forms of dynamics can be found in the living cell. Diffusive motion is effective over short length scale, in the cytoplasm, on membranes, and along DNA or microtubules, whereas directed motion governs processes on larger length scales, including DNA synthesis, intracellular transport, cytoskeletal rearrangements, and mitosis (Bray, 2001; Phillips et al., 2012). Using fluorescence microscopy or other types of optical microscopy, it is possible to capture the dynamics of these processes by generating time series of two- or three-dimensional images. For quantitative understanding of biological processes using, for example, mathematical models, it is crucial to quantify all parameters that underlie the dynamics of the process (e.g., determine directions, speeds, diffusion coefficients, and fluxes), which can be a difficult and time-consuming task. Single-particle tracking (Saxton and Jacobson, 1997) provides the most detailed information but is severely hampered by high particle density and low signal-to-noise ratio (SNR). In many cases, image quality is not sufficient to allow accurate particle tracking, and kymographs can be a convenient means to obtain insight into motility (Snow et al., 2004; Ou et al., 2005; Renkawitz et al., 2009; Hao et al., 2011; Burkel et al., 2012; Moughamian and Holzbaur, 2012; Smith et al., 2012; Prevo et al., 2015). A kymograph is a time–space plot in which the intensity along a given track is plotted as a function of time. Particles moving with constant velocity show up as straight lines, with the slope representing velocity, whereas diffusing particles produce more complex, sinuous trajectories. The intensity of these trajectories depends on the number of particles moving together, and the density of the trajectories is a measure of particle flux. Kymographs thus provide direct, qualitative insight into key motility parameters. In principle, quantitative information can be extracted from kymographs (Ou et al., 2005), but automated kymograph analysis is rarely pursued. Most existing algorithms work well only for data with high SNR and low particle densities and are often applicable to only specific data sets (Welzel et al., 2009; Chenouard et al., 2010; Chetta and Shah, 2011; Mukherjee et al., 2011; Zhang et al., 2011; Goshima et al., 2012; Chiba et al., 2014). In addition, few of these kymograph-analysis tools are publicly available; furthermore, they require significant input from the user (Chenouard et al., 2010; Chiba et al. 2014). The experimental data we and other laboratories typically obtain for intracellular transport show a large range of dynamics, with many particles moving in different directions with varying velocities (e.g., in living eukaryotic cells or Caenorhabditis elegans (Snow et al., 2004; Ou et al., 2005; Hao et al., 2011; Moughamian and Holzbaur, 2012; Smith et al., 2012; Shih et al., 2013; Prevo et al., 2015). In our experience, these data are too complex and noisy to be accurately and reliably analyzed by the existing tools. Consequently kymographs are most often analyzed by human, visual inspection, which is time consuming and prone to user bias and irreproducibility.
Here we present two freely available (www.nat.vu.nl/~erwinp/downloads.html) software tools, KymographClear and KymographDirect, to generate kymographs and perform automated, quantitative analysis of kymographs obtained from a wide range of dynamic events in living cells or organisms. These tools work on data obtained with low SNR and high particle density and have been designed for ease of use and wide applicability. They allow the user to extract, in a highly automated way, key motility parameters that are essential for understanding the dynamics of the biological process of interest. We describe the concepts behind these two tools, demonstrate their accuracy and reliability using simulated data, and apply them to experimental data as diverse as in vitro protein diffusion and translocation on DNA, in vitro microtubule dynamics, intracellular transport in C. elegans chemosensory cilia, and axonal transport in primary neurons.
RESULTS
KymographClear and KymographDirect workflow and features
The workflow of the two software tools discussed here is presented in Figure 1 (also see Supplemental Figures S1–S6).
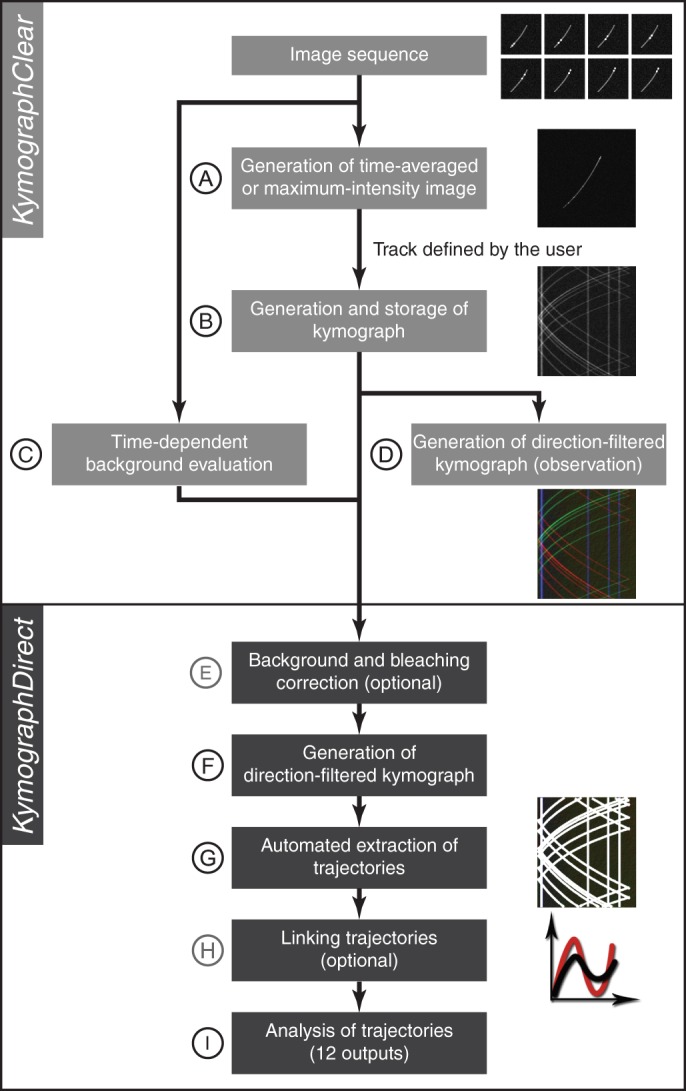
Schematic representation of the workflow of image-sequence analysis using KymographClear (A–D) and KymographDirect (E–I). (A) Loading of an image stack and computation of averaged- or maximum-intensity image of the sequence. (B) Generation of the kymograph along a track defined by the user on the averaged- or maximum-intensity image. (C) Background evaluation by measuring the average intensity obtained from a user-selected (background) region of interest. (D) Extraction of forward-moving (red), backward-moving (green), and static components (blue) of the kymograph by Fourier filtering. (E) Optional background and bleaching correction applied to the kymograph generated by KymographClear. (F) Extraction of forward-moving, backward-moving, and static components of background- and bleaching-corrected kymograph. (G) Automated detection of trajectories in the kymographs (white curves overlaid on the kymograph). (H) Optional linking of trajectories. (I) Quantitative and statistical analysis of trajectories, including position and time dependence of velocity and intensity, their averages, and SDs.
KymographClear (Figure 1, A–D) is an ImageJ (Schneider et al., 2012) macro toolset that allows for the generation of kymographs from image sequences. In this toolset, first (Figure 1A) an averaged or maximum-intensity image is calculated from the image sequence. Within this image, the user can define a track, which can be a straight line, a segmented line, a freehand line, or a spline. An important difference of our macros from existing ImageJ plug-ins is that it uses the subpixel interpolation capabilities of ImageJ, a feature that is essential for correct length determination, in particular along curved tracks. After selection of a track, a macro generates a kymograph that is stored for further analysis (Figure 1B). Another macro can estimate and store background levels for subsequent correction in KymographDirect and can optionally be background corrected (Figure 1C and Supplementary Information). Another feature of KymographClear is Fourier filtering of the kymograph (Chenouard et al., 2010), which allows discrimination of forward-moving, backward-moving and pausing components within the kymograph (Figure 1D, Supplemental Figure S1, and Supplementary Information).
KymographDirect (Figure 1E–I) is a stand-alone software tool written in LabVIEW that automates kymograph analysis and allows accurate determination of trajectories, even at very low SNR. It is designed to process kymographs generated with KymographClear. In a first step (Figure 1E), it prepares the kymographs for analysis by performing (optional) background and bleaching corrections (Supplementary Information). Kymographs are Fourier filtered (Figure 1F; as noted earlier) to limit analysis to distinct motility components. The key step in kymograph analysis (Figure 1G) is the automated tracking of individual trajectories in the kymograph (Supplementary Information), which is performed as follows. First, when nondiffusing particles are analyzed, KymographDirect uses an algorithm that evaluates the average local velocity in the kymograph on the basis of a cross-correlation–based calculation. Next it detects trajectories with peak detection and links particle positions using the average particle velocity obtained in the previous step. When static or diffusing particles are analyzed, the same algorithm is used, with one exception: the average velocity, which directs the search for the next point in the trajectory, is set to zero. Once trajectories are extracted from the kymograph, they can be further analyzed. In principle, particles can display different motility components, and in KymographDirect, these components are treated separately, resulting in split trajectories, which can be linked straightforwardly by the user within the software (Figure 1H). Finally, KymographDirect can evaluate the velocity and intensity along trajectories and perform a statistical analysis of these quantities (Figure 1I and Supplementary Information). KymographDirect can also be used to extract dynamics from the moving edge of an object. In this case, the strategy to analyze the data is simplified: the kymograph is not Fourier filtered, and the edge of the object is determined using a thresholding algorithm. The edge trajectory is then extracted in the same way as static or diffusing particles.
Validation of KymographDirect with simulated and experimental data
To test the validity of our kymograph-analysis tools in an unbiased way, we use them to analyze the motion of particles or moving edges in a variety of simulated data sets, mimicking different experimental conditions, such as varying SNR, crowding, particle crossing, and stochasticity conditions. KymographDirect can analyze this wide range of data by using different algorithms that can be readily selected for edge detection, particle diffusion, or forward- or backward-moving particles. In most cases, Fourier filtering is used to select the direction of motion that is analyzed. We demonstrate the wide applicability of the tools by using them to analyze data ranging from in vitro motility assays to intracellular motility in living multicellular organisms.
Tracking single-particle motion
Simulated data of particles undergoing directed motion.
We start with a validation of KymographDirect using simulated data of an individual particle moving directionally, for example, driven by molecular motors (Cho et al., 2008; Su et al., 2013), focusing on the effects of stochastic velocity variations and SNR. The initial velocity of the particle is 2 pixels/frame. Subsequently it undergoes a stochastic, normally distributed acceleration, ranging from 0 to 0.25 pixel/frame2. In addition, particle and background intensities are Poisson distributed (with SNR defined as the ratio between the average intensity of the particle and the SD of the background). Example kymographs are shown in Figure 2A. Figure 2B shows that the algorithm can extract the trajectory with subpixel accuracy also for the most stochastic motion, even at SNR < 1. The ability of the algorithm to accurately extract single-particle trajectories at such low SNR is substantially helped by Fourier filtering and by low-pass filtering the local velocity, evaluated in the first step of the algorithm. Apart from reliably determining the positions of the particles, the algorithm also performs well in extracting their velocities (Figure 2C), with particularly high accuracy when velocities are almost constant.
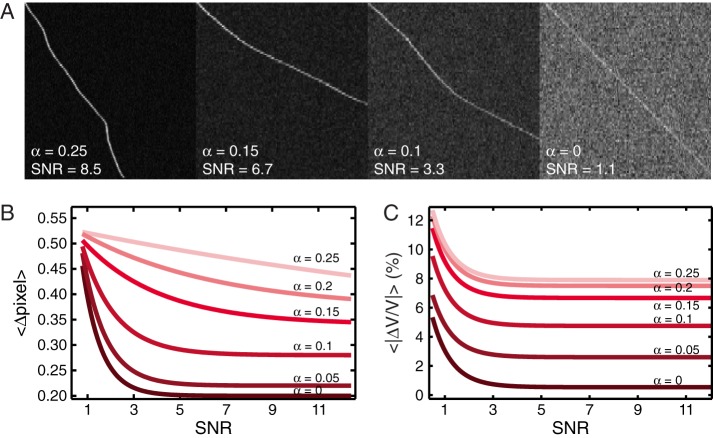
Validation of the kymograph-analysis tools using simulated data mimicking single-particle trajectories. (A) Examples of kymographs generated with stochastic acceleration with a spread α ranging from 0 to 0.25 pixel/frame2 and with various SNRs. (B) Average distance between detected trajectory positions and input (simulated) trajectory positions for different stochastic accelerations with spread α against SNR. Note that even for high SNR and low stochasticity, a residual distance remains. This is due to pixilation effects creating a small offset between the simulated trajectory and the one detected by the algorithm. (C) Average relative error of the software in measuring particle velocity for different stochastic accelerations with spread α against SNR.
Simulated data of diffusing particles.
Another type of motion that can be analyzed using kymographs is diffusion. Kymographs have been used, for example, to follow one-dimensional (1D) diffusion of proteins along microtubules (Sheng and Cai, 2012; Moughamian and Holzbaur, 2012), and DNA (Biebricher et al., 2013; Heller et al., 2013). To validate our algorithms for the analysis of such data, we first simulate the random walk of a single particle on a 1D track and vary its diffusion constant from 0 to 2 pixels2/frame. Particle and background intensities are Poisson distributed to explore a large range of SNR. Examples are shown in Figure 3A. Next we apply KymographDirect in the diffusive particle mode. The program can be set to extract trajectories from kymographs that have been Fourier filtered (which is beneficial for extracting trajectories of pausing particles) or not. In the latter mode, the algorithm successfully extracts trajectories of particles, in particular with low diffusion constants (Figure 3, B and C). In these cases, subpixel localization accuracy is achieved. Localization of particles with higher diffusion constants is less accurate, but almost complete trajectories are extracted, even at SNR close to 1 (Figure 3C). When the program is used using Fourier filtering, the accuracy of the extracted trajectories is slightly lower, except for static particles, for which the accuracy is the same as without filtering (Figure 3D). This slight loss of accuracy can be explained in the smoothening of the trajectories after Fourier filtering (Supplemental Figure S7). In most cases, complete trajectories are extracted, in particular for particles with low diffusion constants. For faster-diffusing particles, trajectory extraction is less efficient, since many particles move >1 pixel between frames and thus are filtered out and cannot be extracted. Nevertheless, >70% of lengths can be extracted at low SNR and > 90% at a SNR > 4 (Figure 3E). For best performance, the Fourier filtering algorithm should only be used for trajectories that show pauses or cross each other frequently. In other cases, the algorithm without Fourier filtering should be used since it is more accurate and efficient in extracting trajectories.
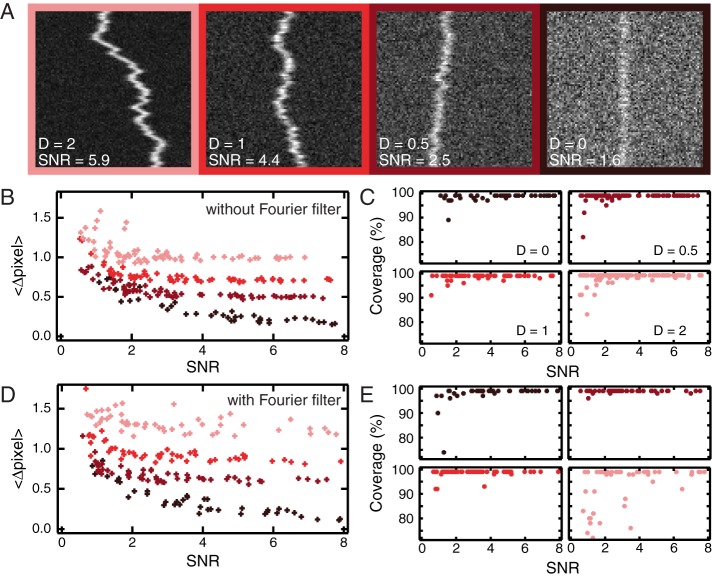
Validation of the kymograph-analysis tools on simulated data mimicking single diffusing particle trajectories. (A) Examples of kymographs generated with diffusion coefficient D from 0 to 2 pixel2/frame and with various SNRs. (B, C) The diffusion coefficient has the values 0 (black), 0.5 (dark red), 1 (red), and 2 (light red) pixel2/frame. (D) Average distance between detected trajectory position and input (simulated) trajectory position for different values of D. (E) Line coverage: ratio between the total length of found trajectories and the total length of the input (simulated) trajectory as a function of SNR.
Experimental data: proteins diffusing and translocating along extended DNA.
Next we apply KymographDirect to experimental data of single proteins moving along DNA extended with optical tweezers in vitro: the Plk1-interacting checkpoint helicase (PICH; Biebricher et al., 2013), which translocates along the DNA, regularly switching direction, and mitochondrial transcription factor A (TFAM; Heller et al., 2013), which diffuses (Figure 4, A and B). In both cases, the relatively low SNR kymographs are treated in KymographDirect in the diffusive data mode. Trajectories are successfully detected (Figure 4, A and B), allowing further analysis. Figure 4C shows the instantaneous velocities in the PICH trajectories and their distributions, clearly indicating the switches of direction. Velocities obtained with KymographDirect are similar to the velocity reported in the original article as obtained from single-particle tracking analysis (Figure 3D of Biebricher et al., 2013); note that the original article took into account only motile events, whereas here we do not discriminate static and motile events. For TFAM, the mean square displacement of proteins was calculated (Figure 4D), which allows for the determination of the distribution of diffusion constants. The distribution obtained with KymographDirect is very similar to the distribution presented in the original article, which was obtained by Gaussian fitting of the fluorescent spots (Figure 6D of Heller et al., 2013). These analyses of data from single protein complexes moving along DNA highlight the capabilities of KymographDirect to track complex motility data with low SNR on the single-molecule level with an accuracy comparable to single-particle tracking analysis of the data.
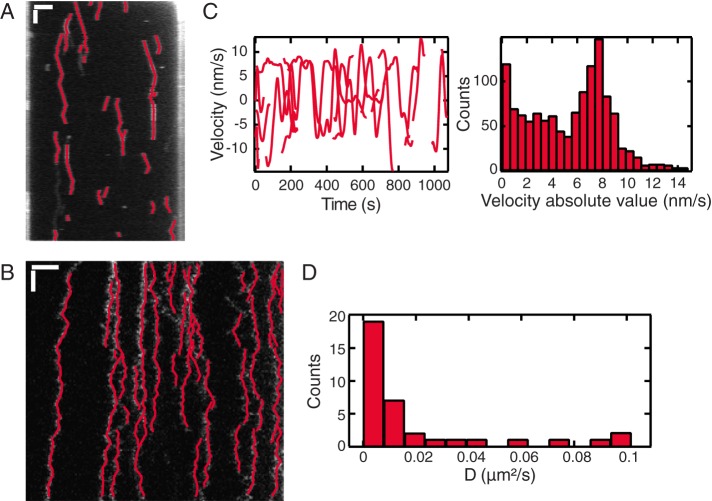
Translocation of PICH and diffusion of TFAM on stretched DNA. Analysis of experimental data. (A) Kymograph of PICH protein translocation on DNA under tension (from Biebricher et al., 2013) overlaid with the trajectories found with KymographDirect; scale bars, 2 μm (horizontal bar), 100 s (vertical). (B) Kymograph of TFAM protein diffusion on DNA under tension (from Heller et al., 2013) overlaid with the trajectories found with KymographDirect; scale bars, 1 μm (horizontal), 100 ms (vertical). (C) Left, velocities deduced from the trajectories found in A. Right, velocity absolute value distribution; each time point of each trajectory contributes to one count in this distribution. (D) Distribution of diffusion coefficients obtained from the trajectories found in B. The diffusion coefficients were obtained from a linear fit of the first 14 time lags of the MSD calculated by KymographDirect.
Tracking moving edges
Simulated data.
Kymographs are widely used to analyze the dynamics of objects such as microtubules (Gardner et al., 2011; Zanic et al., 2013) and cells (Giannone et al., 2004; Gomes et al., 2005; Renkawitz et al., 2009; Burkel et al., 2012). In these cases, the point of interest is the moving edge of the object. For such data, the algorithm is simplified by not applying Fourier filtering. To test the performance of the algorithm in analyzing this kind of data, we simulated a fluorescent segment with a leading edge undergoing a random walk. The edge diffusion coefficient is varied from 0 to 2 pixels2/frame, and the segment and background intensities are Poisson distributed to explore a large range of SNRs. Examples are shown in Figure 5A. The algorithm successfully identifies trajectories of edges in particular for low diffusion constants (Figure 5B) with subpixel localization accuracy. For higher diffusion constants, localization is more challenging and as a result less accurate. In all simulated kymographs, the algorithm extracts edge trajectories robustly, with >95% of a given trajectory extracted, regardless of the diffusion constant or SNR (Figure 5C). An accuracy of <1 pixel is obtained for trajectories extracted from kymographs with SNR > 0.5. For highest accuracy, the software should be applied to experimental data taken with a frame rate fast enough that particles do not move at >1 pixel/frame.
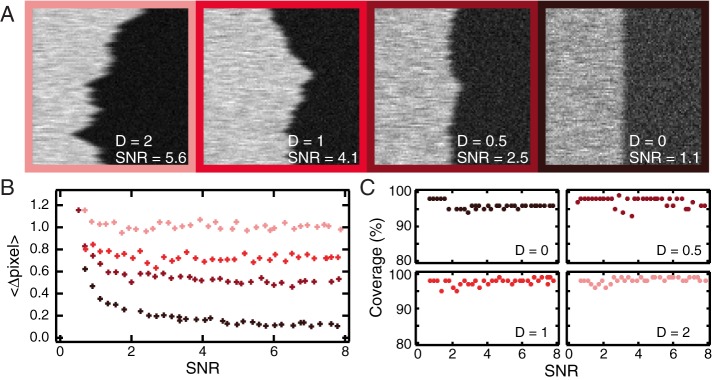
Validation of the kymograph-analysis tools on simulated data mimicking single diffusing edge trajectories. (A) Examples of kymograph generated with diffusion coefficient D ranging from 0 to 2 pixel2/frame and with various SNRs. (B, C) The diffusion coefficient has the values 0 (black), 0.5 (dark red), 1 (red), and 2 (light red) pixel2/frame. (B) Average distance between detected trajectories and input (simulated) trajectories for different values of D. (C) Line coverage: ratio between the total length of found trajectories and the total length of the input (simulated) trajectory as a function of SNR.
Experimental data: in vitro microtubule dynamics.
We next test KymographDirect on experimental data of microtubule dynamics in vitro, which can grow and shrink in bursts (Gardner et al., 2011; Zanic et al., 2013). We generated kymographs from an image sequence (a kind gift of the Zanic lab) using KymographClear and extracted the trajectory of the microtubule tips using the edge-detection mode of KymographDirect (Figure 6A). KymographDirect allows extraction of mobility parameters, such as the instantaneous growth rate, which can be represented in a histogram (Figure 6B), allowing the user to extract a distribution of growth rates and not only the average.
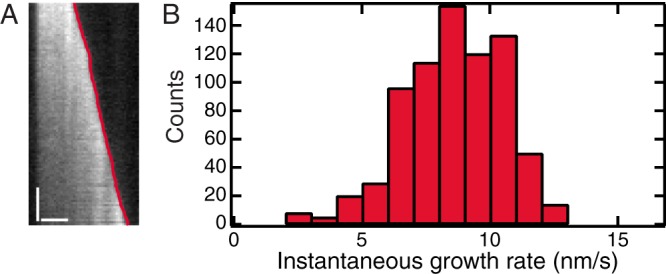
In vitro microtubule dynamics. (A) Kymograph generated from one microtubule of the image sequence overlaid with the trajectory of the growing edge (plus end) found by KymographDirect (red). Note that the other edge (minus end) of the microtubule can be extracted, but it was discarded for simplicity. Scale bars, 2 μm (horizontal), 60 s (vertical). (B) Distribution of instantaneous growth rates obtained from nine microtubules in the image sequence.
Another tool has been used to analyze microtubule dynamics on basis of kymographs (Smal et al., 2010). This tool segments growth phases into monotonic growth phases, which is helpful to obtain the average microtubule growth rate but not ideal to capture the complex dynamics of microtubule growth, which are characterized by large variations in growth rate (Figure 6). Other tools use filament tracking and can extract both filament direction and the extremities of the filament. One such tool is FIESTA (Ruhnow et al., 2011), which we tested on the experimental data of in vitro growing microtubules. In our test, FIESTA could detect position and extremities of only part of the microtubules: four of nine could be tracked over the entire image sequence, two were only tracked during half of the sequence, and three were not detected at all. KymographDirect, on the other hand, extracted all positions of all microtubules. Both programs extracted similar distributions of microtubule growth rates (Figure 6B and Supplemental Figure S8), with an average growth rate of 0.53 ± 0.13 μm/min (10 μM tubulin at saturating GTP condition), similar to values reported in the literature (Zanic et al., 2013). Use of FIESTA could be advantageous when the orientation of the microtubules changes over the image sequence, something that is more difficult to analyze with kymographs. For other data, KymographDirect appears to be more robust. This analysis of microtubule data demonstrate that KymographDirect can be used to extract quantitative motility parameters from kymographs of moving edges, including cytoskeletal polymers and edges of a cell.
Tracking complex dynamics under crowded conditions
Simulated data: crowded conditions.
Kymographs are often used to extract the motility of many crowded moving particles. Such data are obtained, for example, when one is following a moving cell by tracking multiple particles in the cell (Giannone et al., 2004; Gomes et al., 2005; Renkawitz et al., 2009; Burkel et al., 2012). Because of particle crowding and poor contrast of such data, tracking of individual particles is impractical, and quantification of motility parameters has rarely been performed. Our automated kymograph analysis tools can deal with such kymographs, allowing reliable, quantitative analysis.
We mimic crowded conditions by randomly distributing 30 particles along a line of motion that is used to generate the kymographs. The fluorescence intensities of the particles are Poisson distributed, each particle being assigned a random, time-averaged intensity ranging from one to three times the average of the dimmest particle. To test a wide range of SNRs, each kymograph is simulated with different fluorescence and background intensities (Figure 7A), in the same way as in the single-particle tracking case; SNR is calculated with the average intensity of all particles used in the kymograph. The algorithm extracts trajectories reliably with subpixel resolution, even at low SNR (Figure 7B), and velocities are determined accurately, within a few percent (Figure 7C). The algorithm is also very efficient: in this simulation, for SNR > 3, >90% of the trajectories are detected (Figure 7D). Even in the range of SNR = 1–3, the majority of trajectories are found. The analysis of these simulated kymographs shows that our algorithms are very efficient in obtaining quantitative parameters from crowded, low-SNR kymographs.
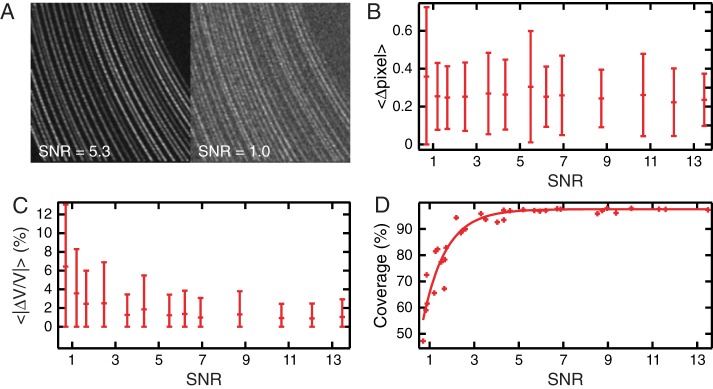
Validation of the software for crowded particles. (A) Examples of kymographs obtained from simulations of multiple particles accelerating simultaneously, generated with different SNRs. (B) Average distance between detected trajectory position and input (simulated) trajectory position as function of SNR; error bars represent SD. (C) Average relative error in measuring particle velocity against SNR; error bars represent SD. (D) Line coverage: ratio of the total length of found trajectories and the total length of the input (simulated) trajectories as a function of SNR.
Simulated data: bidirectional motion and crossing particles.
Motion in opposite directions is often observed in intracellular transport (Ou et al., 2005; Hao et al., 2011; Moughamian and Holzbaur, 2012; Smith et al., 2012; Wei et al., 2012; Prevo et al., 2015). Kymographs generated from image sequences obtained from these processes are difficult to analyze because particles trajectories can cross. Furthermore, particles can be very numerous, and their motion can vary stochastically from particle to particle and time to time.
To test the applicability and accuracy of our tools on this kind of data, we simulate two data sets: one with all particles moving only in one direction (Figure 8A), and one with particles moving in either the forward or backward direction, creating ~100 crossing points in the kymographs (Figure 8B). In both cases, stepping of the particles is stochastic: at each time point, a forward-moving particle steps randomly in the range of 0–5 pixels, whereas a backward-moving particle makes a step in the range of 0 to −5 pixels. The particle and background intensities are Poisson distributed and varied in order to test a wide range of SNRs. Analysis of these kymographs with KymographDirect shows that the output of the algorithm is only slightly affected by particle crossings: even in kymographs displaying many crossing lines, the algorithm successfully and accurately detects individual trajectories running in both directions with subpixel accuracy even at very low SNR (Figure 8C). Compared to similar data without trajectory crossings, the loss of accuracy in detecting individual trajectories is limited to ~0.1 pixel over the range of SNR tested (Figure 8C). The efficiency of the algorithm to find trajectories is not noticeably affected by the occurrence of crossing lines (Figure 8D). This ability of KymographDirect to analysis complex, bidirectional data stems from the effective discrimination of the different directions of motion using Fourier filtering.
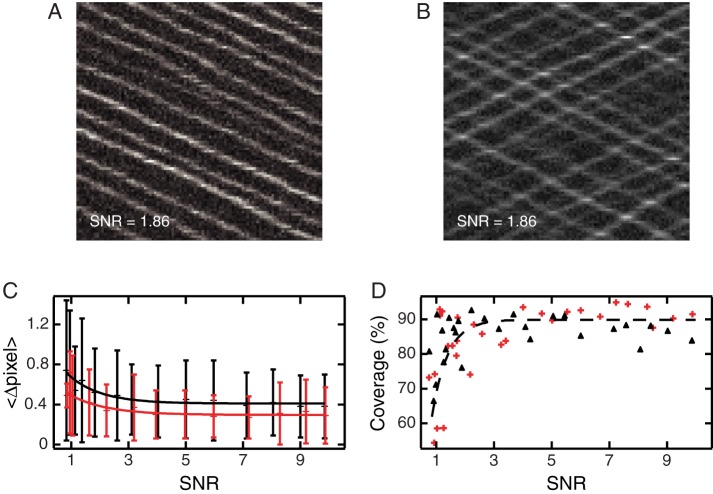
Validation of the kymograph software using simulated data representing particles moving in opposite directions. (A) Example of a simulated kymograph containing crossing points due to particles moving in opposite directions. (B) Example of a kymograph simulating particles moving in only the forward direction. (C) Average distance between detected trajectories and input (simulated) trajectories as a function of SNR for bidirectional motion (black) and unidirectional motion (red); bars represent SD, and the lines are exponential fits of the data (black, bidirectional motion; red, unidirectional motion). (D) Line coverage: ratio between the total length of a found trajectory and the total length of the input (simulated) trajectories as a function of SNR bidirectional motion (black) and unidirectional motion (red). The gray dashed line is a guide for the eye.
Experimental data: C. elegans intraflagellar transport dynamics.
To test KymographDirect on complex bidirectional experimental data, we applied it to fluorescence image sequences of intraflagellar transport (IFT) in living C. elegans. IFT is required for the building and maintenance of chemosensory cilia and depends on the active transport of protein complexes by motor proteins (Snow et al., 2004; Ou et al., 2005; Hao et al., 2011; Prevo et al., 2015). Kymographs obtained from image sequences of IFT in living C. elegans often suffer from poor contrast, complicating analysis and quantification of motility parameters. KymographDirect is very well suited to analyze this kind of data and extract parameters such as position-dependent velocities and intensities. We recorded the motion of enhanced green fluorescent protein (EGFP)–labeled OSM-3 kinesin in the phasmid cilia of C. elegans using laser-illuminated epifluorescence microscopy (Figure 9A and Supplemental Movie S1). KymographClear was used to generate a kymograph (Figure 9B) from this image sequence. Forward-moving, backward-moving, and static components can be clearly discriminated using Fourier filtering (Figure 9C). KymographDirect was next used to extract trajectories of groups of OSM-3 kinesins moving together (Figure 9D). The SNR (defined as the ratio between the average intensity along a trajectory and the SD of the background), ranges between 2 (for the dimmest trajectories) and 8 (for the brightest). Most trajectories that can be seen in the kymograph are automatically extracted by KymographDirect within 1 s, yielding 64 trajectories. From these trajectories, KymographDirect can determine velocity and intensity (Figure 9, E and G) and perform statistical analysis. Shown here are position-dependent, trajectory-averaged velocities and intensities, including their SDs (Figure 9, F and H). It is important to note that the algorithm is successful in tracking particles in these data, even though trajectories frequently cross. Furthermore, KymographDirect allows extraction of position-dependent velocities of IFT-components, providing important additional insights into the transport mechanism (Prevo et al., 2015).
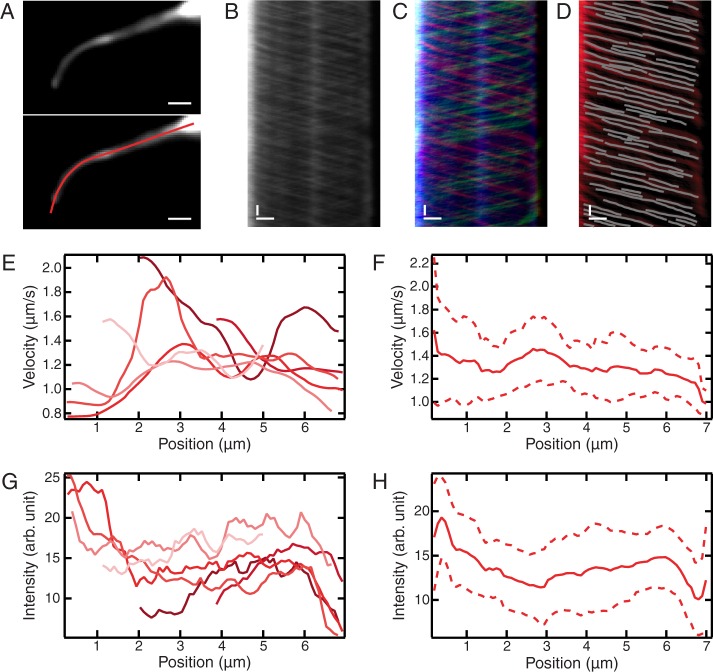
Application of KymographClear and KymographDirect to experimental fluorescence image sequences representing EGFP-tagged OSM-3 kinesin dynamics in phasmid cilia of living C. elegans. (A) Top, time-averaged image of the image sequence (Supplemental Movie S1). The structure observed is the overlap of two phasmid cilia. Bottom, same as top, with a user-defined nonlinear track overlaid, which is used to generate a kymograph (B). Scale bars, 1 μm. (B–D) Kymographs generated from the data in A and Supplemental Movie S1. Scale bars, 1 μm (horizontal), 2 s (vertical). (B) Raw kymograph. (C) Kymograph Fourier-filtered for motion in the forward direction (red) and backward (green) directions and for static particles (blue). (D) Kymograph of forward-moving groups of OSM-3 kinesins (red) with trajectories extracted by KymographDirect overlaid (64, gray). (E–H) Results of automated kymograph analysis. (E) Position-dependent velocities of six of the trajectories extracted. (F) Average (solid line) and SD (dashed line) of the position-dependent velocities obtained from all 64 trajectories. (G, H) Same as E and F, for intensities of trajectories.
Experimental data: axonal transport in primary neurons.
Axonal transport of vesicles exhibits very rich dynamics, with frequent changes of direction and pauses. To test whether our tools can accurately extract trajectories displaying such changeability and complexity, we use an image sequence published by Moughamian and Holzbaur (2012; top sequence of their Supplemental Movie S2, scrambled case). In these data, LAMP1-RFP is used to monitor lysosome dynamics. We generated a kymograph and color-coded static and forward- and backward-moving motion components with KymographClear (Figure 10, A and B). We analyzed the different components separately and determined the corresponding trajectories (Figure 10C). The diffusive component of motion is very well captured, as are the majority of the directional trajectories. Note that for this type of data, the range of intensities is very large (in this example, brightest and dimmest trajectories differ 30-fold in intensity) and the intensity of the dimmest trajectories is close to the background. Under such demanding conditions, the algorithm can identify some trajectories that are actually noise. KymographDirect allows straightforward deletion of such undesired trajectories by the user. In addition, KymographDirect allows manual linking of the trajectories that arise from the three different motion components obtained using Fourier filtering. In this way, linked trajectories can be obtained that contain the full extent of dynamics. Overall ~90% of trajectories are extracted, with most missed trajectories being low-intensity ones. In axonal transport, it is of particular interest to determine the fraction of time during which particles are taking part in active transport (Moughamian and Holzbaur, 2012); in KymographDirect, this can computed using the velocities and intensities extracted from the trajectories (Figure 10D). Applying a velocity threshold of ±0.15 μm/s, we find that 22 and 16% of the time points in the extracted trajectories correspond to anterograde and retrograde motion, respectively, whereas in 62%, no motion is detected, in agreement with the analysis in the original study (Moughamian and Holzbaur, 2012). Using KymographDirect, these fractions can be further analyzed taking into account the intensity information, that is, the quantity of proteins involved. We find that, averaged over time, 72% of proteins are nonmotile, whereas 16.5 and 11.5% move in anterograde and retrograde directions, respectively. This quantification is in agreement with the more intense appearance of the nonmotile trajectories in the kymograph.
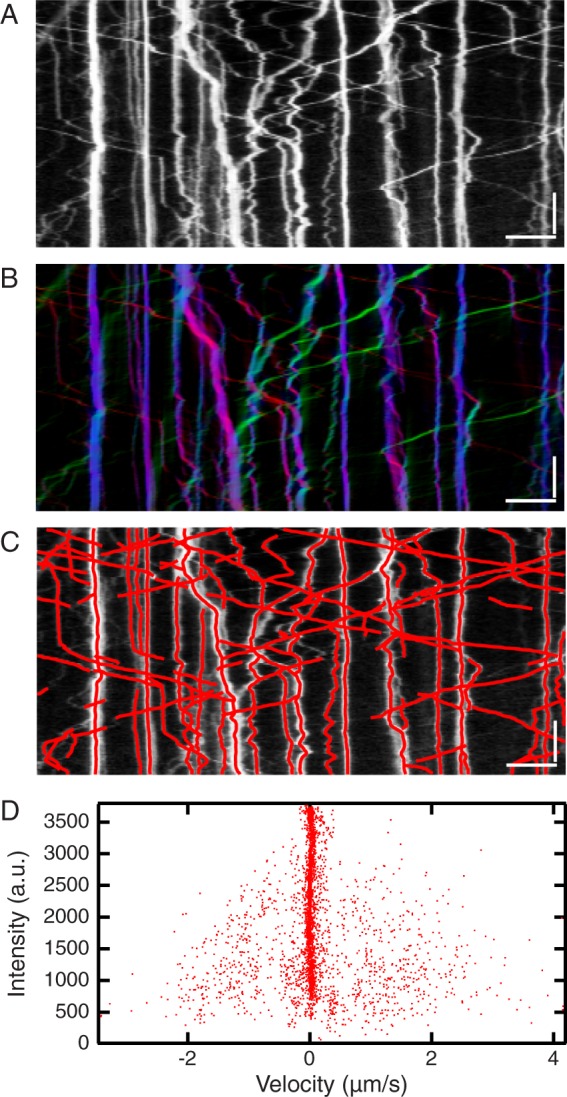
Experimental data from axonal transport in primary neurons. (A) Kymograph generated from the top sequence of Movie S2 of Moughamian and Holzbaur (2012). (B) Same kymograph as A, Fourier-filtered for motion in the forward direction (red) and backward (green) directions and for pausing and diffusing particles (blue). (C) Kymograph A overlaid with trajectories obtained with KymographDirect (red). Some trajectories coming from different components of motion have been linked together by the subprogram Link of KymographDirect to obtain the trajectories presented. Scale bars, 5 μm (horizontal), 10 s (vertical). (D) Intensity of extracted trajectories as a function of their velocity; these quantities are obtained from KymographDirect analysis. Each dot corresponds to a single time point of a given trajectory.
These analyses demonstrate that KymographDirect can identify single-particle trajectories in kymographs of complex transport processes in vivo to accurately extract quantitative motility parameters. In our view, tools like these are essential to unravel the complex dynamics of intracellular transport in vivo.
Comparison of KymographDirect with kymograph automated analysis tools.
The automated analysis of kymographs representing complex dynamics is highly desired, since manual analysis can be time consuming and potentially inaccurate. Several algorithms have been reported to improve the automation of trajectory extraction (Chenouard et al., 2010; Chetta and Shah, 2011; Mukherjee et al., 2011; Zhang et al., 2011; Goshima et al., 2012) and estimate velocities (Welzel et al., 2009) from kymographs. Most of these algorithms are not publicly available and have been validated on limited data sets, making a thorough comparison with the tools presented here difficult. One application, Kymotracker (Chenouard et al., 2010), implemented in ICY (De Chaumont et al., 2012), is publicly available and has been designed to help users extract trajectories in a semiautomated way. In the following, we compare the performance of KymographDirect with Kymotracker. Kymotracker allows for kymograph generation and Fourier filtering for anterograde- and retrograde-moving particles but does not allow analysis of pauses as KymographDirect can do. A semiautomated routine helps the user to extract trajectories manually in the kymographs generated, which requires substantially more user interaction than KymographDirect. We tested Kymotracker on the kymographs generated from IFT data (Figure 9B) and found that in our hands, Kymotracker introduces horizontal sections on most trajectories, which would indicate very large velocities, incompatible with kinesin or dynein motion (unpublished data). Such artifacts were not observed with KymographDirect (Figure 9, E and F). Kymotracker did not produce this kind of artifact when analyzing axonal transport data (Figure 10A), presumably because the SNR of these data is higher and the kymograph is less dense. Because in Kymotracker, trajectories are obtained by the user, almost all trajectories can be extracted, including the ones missed by KymographDirect. In Kymotracker, additional software tools are needed for further analysis of the trajectories, whereas KymographDirect can perform key analysis tasks. In conclusion, KymographDirect is the most advanced and comprehensive tool publicly available for efficient and accurate automated analysis of kymographs.
DISCUSSION
Quantitative analysis of molecular and cellular dynamics is crucial to understand their underlying mechanisms. Kymographs are a very powerful way to display the time dependence of these processes and can in principle be used to obtain quantitative insight into their dynamics. Automatizing kymograph analysis has been difficult, however, in particular for complex and low-SNR data. As a consequence, analysis is performed in many cases by human, visual inspection. Here we introduced a new, reliable set of software tools for the generation (KymographClear) and analysis (KymographDirect) of kymographs.
To demonstrate the reliability of automated kymograph analysis by KymographDirect, we tested this tool extensively with simulated kymographs representing a wide range of dynamic processes and imaging conditions as found in the literature. Trajectories are typically extracted with subpixel accuracy even for SNR close to 1 (Figures 2B, 3, B and D, ,5B,5B, ,7B,7B, and and8C).8C). Even for low-SNR kymographs, the application is capable of extracting the majority of trajectories. At SNR > 2, at least 80% and most often 90% of trajectories are reliably revealed (Figures 3, C and E, 5, C and E, 7, D and E, and 8, D and E). The algorithm’s ability to precisely determine velocities depends on the stochasticity of the process studied; in most cases, the uncertainty encountered is at most a few percent (Figures 2C and 7, C and E).
We demonstrated the applicability of KymographDirect to a variety of experimental kymographs. KymographDirect was used to extract trajectories of single proteins diffusing and translocating on DNA in vitro (Figure 4), trajectories of the edge of growing microtubules in vitro (Figure 6), and trajectories of groups of molecular motors in cilia and axons in living cells (Figures 9 and and10).10). These examples represent a variety of experimental conditions highlighting the applicability of our tools to quantitatively assess a wide range of biological processes in vivo and in vitro. They also demonstrate that KymographDirect can reliably extract complex trajectories in an automated way, yielding motility parameters such as instantaneous velocity, position-dependent intensity and velocity, and diffusion constants. Compared to available single-particle tracking routines, KymographDirect performed similarly or better on the tested data sets. Comparison with kymograph automated analysis tools is more difficult because, despite the amount of algorithm published, only one semiautomated tool is publicly available; compared with this tool, KymographDirect offers a higher degree of automation and precision on the data set tested. All of the applications analyzed here used fluorescence microscopy, but in principle, KymographDirect and KymographClear can also be applied to data obtained with bright-field microscopy, including phase-contrast and differential interference contrast microscopy.
Kymographs are widely used by the cell biology and biophysics communities to visualize motion. Automated quantitative analysis tools for kymographs have been lacking, restricting researchers to manually extract motility parameters. Here we introduced a novel toolset for the generation and automated analysis of kymographs that is reliable even under severely crowded and low-SNR conditions. We foresee that the toolset will enable microscopists to analyze their images with high accuracy, reliability, and throughput, accelerating discoveries in molecular and cellular dynamics.
MATERIALS AND METHODS
Generation and analysis of simulated data
Simulated kymographs were generated with custom programs written in LabVIEW (National Instruments, Austin, TX). First, particle tracks were calculated, using random-number generation for stepping or acceleration (in case stochasticity needed to be introduced). Next the particle intensity was simulated, assuming a Poisson distribution for photon emission. The resulting image was then convoluted with a 1D Gaussian function along the position axis to mimic the effect of the finite resolution of the microscope (the full-width at half-maximum corresponded to 2 pixels). Finally, Poisson noise was added to the image to mimic typical camera noise and vary SNR.
In the analysis of simulated data, we used the setting “noise reduction” in KymographDirect, which is accessible in all modes of analysis (Supplementary Information). We found that this mode gives the most precise and reliable results. Custom-written programs were used to validate KymographDirect. The fraction of trajectories identified by the program (the “coverage”) corresponds to the fraction of time points extracted from simulated trajectories of diffusive particles (Figures 2 and and4)4) and to the fraction of locations extracted from simulated trajectories of or particles with directed motion (Figures 7 and and88).
C. elegans imaging
Microscopy images were acquired using a custom-built epi-illuminated wide-field fluorescence microscope operated by a MicroManager software interface (μManager, MicroManager 1.4, www.micromanager.org; Edelstein et al. 2014) and built around an inverted microscope body (Eclipse Ti; Nikon, Amsterdam, Netherlands) fitted with a 60× water-immersion objective (CFI Plan Apo IR 60× water immersion, numerical aperture 1.27; Nikon). Excitation light was provided by a diode-pumped solid-state laser (Calypso 50, 491 nm; Cobolt, Solna, Sweden). Images were captured with an electron-multiplying charge-coupled device camera (iXon 897; Andor, Belfast, UK). One camera pixel corresponded to 92 nm × 92 nm in the image plane.
The C. elegans strain expressing EGFP-tagged OSM-3 kinesin motor proteins (Snow et al. 2004) was a kind gift of Jonathan M. Scholey (University of California, Davis, Davis, CA). Fluorescence imaging in living C. elegans was performed by anesthetizing adult worms (maintained at 20°C) in M9 containing 5 mM levamisole (tetramisole hydrochloride, L9756; Sigma-Aldrich, St. Louis, MO) and immobilizing them between a 2% agarose pad and a coverslip. Samples were imaged at room temperature (21°C) at 152 ms/frame.
Acknowledgments
We thank Jonathan M. Scholey (University of California, Davis) for the gift of the C. elegans strain expressing the kinesin motor OSM-3 tagged with EGFP, Anika Rahman and Marija Zanic (Vanderbilt University, Nashville, TN) for providing the microtubule image sequence, and Jona Mijalkovic and Nuria Taberner for comments on the manuscript and software. This work was supported by a VICI fellowship from the Netherlands Organization for Scientific Research, Physics (NWO-N), an Open Programme Grant from NWO, Earth and Life Sciences (NWO-ALW), an NWO Groot investment grant, and a grant from NanoNextNL, a micro- and nanotechnology consortium of the Government of the Netherlands and 130 partners.
Abbreviations used:
| 1D | one-dimensional |
| EGFP | enhanced green fluorescent protein |
| LAMP1 | lysosomal-associated membrane protein 1 |
| MSD | mean squared displacement |
| PICH | Plk1-interacting checkpoint helicase |
| RFP | red fluorescent protein |
| SNR | signal-to-noise ratio |
| TFAM | mitochondrial transcription factor A. |
Footnotes
This article was published online ahead of print in MBoC in Press (http://www.molbiolcell.org/cgi/doi/10.1091/mbc.E15-06-0404) on April 20, 2016.
REFERENCES
- Biebricher A, Hirano S, Enzlin JH, Wiechens N, Streicher WW, Huttner D, Wang LH, Nigg EA, Owen-Hughes T, Liu Y, et al. PICH: a DNA translocase specially adapted for processing anaphase bridge DNA. Mol Cell. 2013;51:691–701. [Europe PMC free article] [Abstract] [Google Scholar]
- Bray D. Cell Movements: From Molecules to Motility. New York: Garland Science; 2001. [Google Scholar]
- Burkel BM, Helene A, Benink HA, Vaughan EM, von Dassow G, Bement WM. A Rho GTPase signal treadmill backs a contractile array. Dev Cell. 2012;23:384–396. [Europe PMC free article] [Abstract] [Google Scholar]
- Chenouard N, Buisson J, Bloch I, Bastin B, Olivo-Marin J-C. Curvelet analysis of kymograph for tracking bi-directional particles in fluorescence microscopy images. 2010. In: 17th IEEE International Conference on Image Processing, New York: IEEE, 3657–3660.
- Chetta J, Shah SB. A novel algorithm to generate kymographs from dynamic axons for the quantitative analysis of axonal transport. J Neurosci Methods. 2011;199:230–240. [Abstract] [Google Scholar]
- Chiba K, Shimada Y, Kinjo M, Suzuki T, Uchida S. Simple and direct assembly of kymographs from movies using KYMOMAKER. Traffic. 2014;15:1–11. [Abstract] [Google Scholar]
- Cho C, Reck-Peterson SL, Vale RD. Regulatory ATPase sites of cytoplasmic dynein affect processivity and force generation. J Biol Chem. 2008;283:25839–25845. [Europe PMC free article] [Abstract] [Google Scholar]
- De Chaumont, Dallongeville S, Chenouard N, Hervé N, Pop S, Provoost T, Meas-Yedid V, Pankajakshan P, Lecomte T, Le Montagner Y, et al. Icy: an open bioimage informatics platform for extended reproducible research. Nat Methods. 2012;9:690–696. [Abstract] [Google Scholar]
- Edelstein AD, Tsuchida MA, Amodaj N, Pinkard H, Vale RD, Stuurman N. Advanced methods of microscope control using μManager software. J Biol Methods. 2014;1:e11. [Europe PMC free article] [Abstract] [Google Scholar]
- Gardner MK, Zanic M, Gell C, Bormuth V, Howard J. Depolymerizing kinesins Kip3 and MCAK shape cellular microtubule architecture by differential control of catastrophe. Cell. 2011;147:1092–1103. [Abstract] [Google Scholar]
- Giannone G, Dubin-Thaler BJ, Döbereiner HG, Kieffer N, Bresnick AR, Sheetz MP. Periodic lamellipodial contractions correlate with rearward actin waves. Cell. 2004;116:431–443. [Abstract] [Google Scholar]
- Gomes ER, Jani S, Gundersen GG. Nuclear movement regulated by Cdc42, MRCK, myosin, and actin flow establishes MTOC polarization in migrating cells. Cell. 2005;121:451–463. [Abstract] [Google Scholar]
- Goshima Y, Hida T, Gotoh T. Computational analysis of axonal transport: a novel assessment of neurotoxicity, neuronal development and functions. Int J Mol Sci. 2012;13:3414–3430. [Europe PMC free article] [Abstract] [Google Scholar]
- Hao L, Thein M, Brust-Mascher I, Civelekoglu-Scholey G, Lu Y, Acar S, Prevo B, Shaham S, Scholey JM. Intraflagellar transport delivers tubulin isotypes to sensory cilium middle and distal segments. Nat Cell Biol. 2011;13:790–798. [Europe PMC free article] [Abstract] [Google Scholar]
- Heller I, Sitters G, Broekmans OD, Farge G, Menges C, Wende W, Hell SW, Peterman EJG, Wuite GJ. STED nanoscopy combined with optical tweezers reveals protein dynamics on densely covered DNA. Nat Methods. 2013;10:910–916. [Abstract] [Google Scholar]
- Moughamian AJ, Holzbaur EL. Dynactin is required for transport initiation from the distal axon. Neuron. 2012;74:331–343. [Europe PMC free article] [Abstract] [Google Scholar]
- Mukherjee A, Jenkins B, Fang C, Radke RJ, Banker G, Roysam B. Automated kymograph analysis for profiling axonal transport of secretory granules. Med Image Anal. 2011;15:354–367. [Abstract] [Google Scholar]
- Ou G, Blacque OE, Snow JJ, Leroux MR, Scholey JM. Functional coordination of intraflagellar transport motors. Nature. 2005;436:583–587. [Abstract] [Google Scholar]
- Phillips R, Kondev J, Theriot J, Garcia H. Physical Biology of the Cell. New York: Garland Science; 2012. [Google Scholar]
- Prevo B, Mangeol P, Oswald F, Scholey JM, Peterman EJ. Functional differentiation of cooperating kinesin-2 motors orchestrates cargo import and transport in C. elegans cilia. Nat Cell Biol. 2015;17:1536–1545. [Abstract] [Google Scholar]
- Renkawitz J, Schumann K, Weber M, Lämmermann T, Pflicke H, Piel M, Polleux J, Spatz JP, Sixt M. Adaptive force transmission in amoeboid cell migration. Nat Cell Biol. 2009;11:1438–1443. [Abstract] [Google Scholar]
- Ruhnow F, Zwicker D, Diez S. Tracking single particles and elongated filaments with nanometer precision. Biophys J. 2011;100:2820–2828. [Europe PMC free article] [Abstract] [Google Scholar]
- Saxton MJ, Jacobson K. Single-particle tracking: applications to membrane dynamics. Annu Rev Biophys Biomol Struct. 1997;26:373–399. [Abstract] [Google Scholar]
- Schneider CA, Rasband WS, Eliceiri KW. NIH Image to ImageJ: 25 years of image analysis. Nat Methods. 2012;9:671–675. [Abstract] [Google Scholar]
- Sheng ZH, Cai Q. Mitochondrial transport in neurons: impact on synaptic homeostasis and neurodegeneration. Nat Rev Neurosci. 2012;13:77–93. [Europe PMC free article] [Abstract] [Google Scholar]
- Shih SM, Engel BD, Kocabas F, Bilyard T, Gennerich A, Marshall WF, Yildiz A. Intraflagellar transport drives flagellar surface motility. Elife. 2013;2:e00744. [Europe PMC free article] [Abstract] [Google Scholar]
- Smal I, Grigoriev I, Akhmanova A, Niessen WJ, Meijering E. Microtubule dynamics analysis using kymographs and variable-rate particle filters. IEEE Trans Image Process. 2010;19:1861–1876. [Abstract] [Google Scholar]
- Smith RB, Machamer JB, Kim NC, Hays TS, Marques G. Relay of retrograde synaptogenic signals through axonal transport of BMP receptors. J Cell Sci. 2012;125:3752–3764. [Europe PMC free article] [Abstract] [Google Scholar]
- Snow JJ, Ou G, Gunnarson AL, Walker MRS, Zhou HM, Brust-Mascher I, Scholey JM. Two anterograde intraflagellar transport motors cooperate to build sensory cilia on C. elegans neurons. Nat Cell Biol. 2004;6:1109–1113. [Abstract] [Google Scholar]
- Su X, Arellano-Santoyo H, Portran D, Gaillard J, Vantard M, Thery M, Pellman D. Microtubule-sliding activity of a kinesin-8 promotes spindle assembly and spindle-length control. Nat Cell Biol. 2013;15:948–957. [Europe PMC free article] [Abstract] [Google Scholar]
- Wei Q, Zhang Y, Li Y, Zhang Q, Ling K, Hu J. The BBSome controls IFT assembly and turnaround in cilia. Nat Cell Biol. 2012;14:950–957. [Europe PMC free article] [Abstract] [Google Scholar]
- Welzel O, Boening D, Stroebel A, Reulbach U, Klingauf J, Kornhuber J, Groemer TW. Determination of axonal transport velocities via image cross- and autocorrelation. Eur Biophys J. 2009;38:883–889. [Abstract] [Google Scholar]
- Zanic M, Widlund PO, Hyman AA, Howard J. Synergy between XMAP215 and EB1 increases microtubule growth rates to physiological levels. Nat Cell Biol. 2013;15:688–693. [Abstract] [Google Scholar]
- Zhang K, Osakada Y, Xie W, Cui B. Automated image analysis for tracking cargo transport in axons. Microsc Res Tech. 2011;74:605–613. [Europe PMC free article] [Abstract] [Google Scholar]
Articles from Molecular Biology of the Cell are provided here courtesy of American Society for Cell Biology
Citations & impact
Impact metrics
Citations of article over time
Alternative metrics
Smart citations by scite.ai
Explore citation contexts and check if this article has been
supported or disputed.
https://scite.ai/reports/10.1091/mbc.e15-06-0404
Article citations
Thymine DNA glycosylase combines sliding, hopping, and nucleosome interactions to efficiently search for 5-formylcytosine.
Nat Commun, 15(1):9226, 25 Oct 2024
Cited by: 0 articles | PMID: 39455577 | PMCID: PMC11512004
How to scan naked DNA using promiscuous recognition and no clamping: a model for pioneer transcription factors.
Nucleic Acids Res, 52(18):11098-11114, 01 Oct 2024
Cited by: 0 articles | PMID: 39287129 | PMCID: PMC11472051
MINFLUX reveals dynein stepping in live neurons.
Proc Natl Acad Sci U S A, 121(38):e2412241121, 10 Sep 2024
Cited by: 1 article | PMID: 39254993 | PMCID: PMC11420169
Real-time imaging of axonal membrane protein life cycles.
Nat Protoc, 19(9):2771-2802, 03 Jun 2024
Cited by: 0 articles | PMID: 38831222
Review
Sonic Hedgehog activates prostaglandin signaling to stabilize primary cilium length.
J Cell Biol, 223(9):e202306002, 10 Jun 2024
Cited by: 0 articles | PMID: 38856684
Go to all (106) article citations
Data
Data behind the article
This data has been text mined from the article, or deposited into data resources.
BioStudies: supplemental material and supporting data
Similar Articles
To arrive at the top five similar articles we use a word-weighted algorithm to compare words from the Title and Abstract of each citation.
KymoButler, a deep learning software for automated kymograph analysis.
Elife, 8:e42288, 13 Aug 2019
Cited by: 57 articles | PMID: 31405451 | PMCID: PMC6692109
Automated Multi-Peak Tracking Kymography (AMTraK): A Tool to Quantify Sub-Cellular Dynamics with Sub-Pixel Accuracy.
PLoS One, 11(12):e0167620, 19 Dec 2016
Cited by: 4 articles | PMID: 27992448 | PMCID: PMC5167257
MTrack: Automated Detection, Tracking, and Analysis of Dynamic Microtubules.
Sci Rep, 9(1):3794, 07 Mar 2019
Cited by: 16 articles | PMID: 30846705 | PMCID: PMC6405942
Software tools, data structures, and interfaces for microscope imaging.
Cold Spring Harb Protoc, 2012(1):50-61, 01 Jan 2012
Cited by: 3 articles | PMID: 22194261
Review


