| PMC full text: | Published online 2016 Jul 7. doi: 10.1074/jbc.M116.744433
|
FIGURE 3.

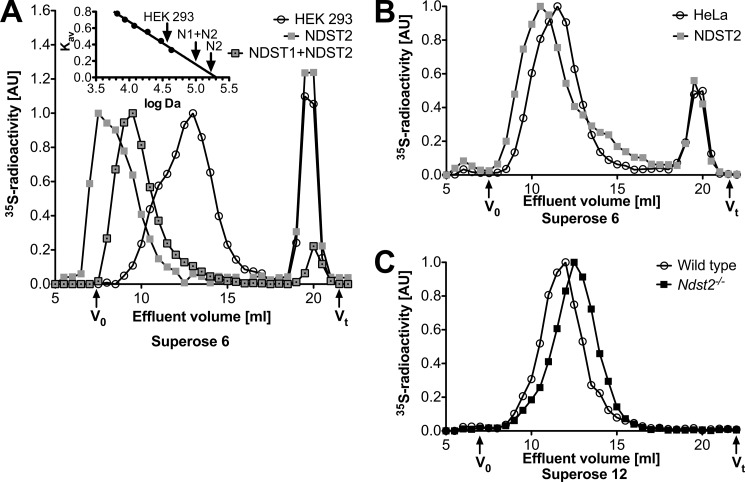
HS chain length in cells overexpressing or lacking NDST2. A, [35S]sulfate-labeled HS from mock-transfected cells (circles), cells overexpressing NDST2 (squares), and cells overexpressing both NDST2 and NDST1 (framed squares) were isolated from intact proteoglycans as described under “Experimental Procedures.” The size distribution was analyzed by gel chromatography on a Superose 6 column in 1% Triton X-100, 1 m NaCl, 50 mm Tris-HCl, pH 7.5. Fractions of 0.5 ml were collected and analyzed by scintillation counting. The inset is a plot of Kav values obtained for saccharide standards of known apparent Mr against log Mr. The three arrows correspond to Kav values used to estimate the apparent Mr of the [35S]sulfate-labeled HS samples. The experiment has been repeated with similar results. B, [35S]sulfate-labeled HS from control HeLa cells (circles) or HeLa cells overexpressing NDST2 (squares). Results shown are mean values of two experiments. C, [35S]sulfate-labeled HS from peritoneal cell-derived mast cells isolated from wild type (circles) and Ndst2−/− mice (filled squares). Results shown are mean values of two (wild type) or three (Ndst2−/−) experiments. The samples analyzed contained between 3 × 10³ and 6 × 10³ cpm, and values were normalized to arbitrary units (AU) where the highest value (cpm/fraction) of each run was set at 1.


