| PMC full text: | Published online 2016 Oct 24. doi: 10.1073/pnas.1609780113 |
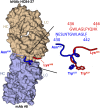
Fig. 2.

Structural analysis of HDX data. (A, Top) Deuterium incorporation into E2c2 when bound to NAb AR2A after 10 s of exchange is mapped onto the crystal structure of E2c using a color gradient. Disordered regions are represented by dotted lines, and regions not covered by peptic fragments and prolines are shown as thin, white tubes if structured or as gray dots if disordered. (A, Bottom) For clarity, the front layer, the β-sandwich, and the back layer of E2 are displayed individually. (B, Top) Deuterium exchange into E2c2 bound to NAb AR2A after 1,000 s of exchange is displayed as in A. (B, Bottom) Known mAb epitopes are highlighted. (C) HDX of a peptide spanning the N-terminal antigenic region of the CD81bs is plotted for E2c2-AR2A and E2c2-AR2A-AP33. (D) Average HDX of the E2 front layer (cyan), β-sandwich (red), and back layer (green) within the E2c2/AR2A complex is plotted.


