| PMC full text: | Published online 2017 May 25. doi: 10.1038/s41598-017-02606-2
|
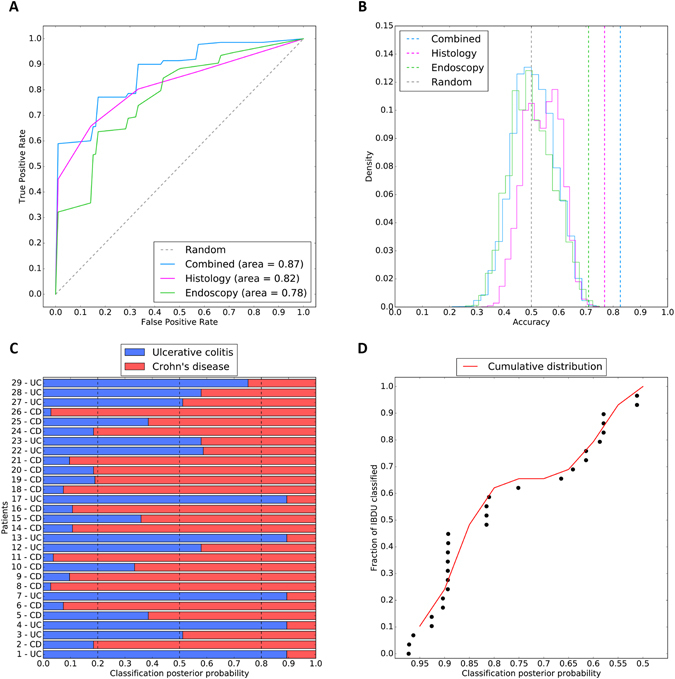
Figure 3

Supervised classification performance and metrics. (A) Receiver operating characteristic of the combined (light blue), histology (purple) and endoscopy (green) models. The grey dashed line represents the expected performance of a random model. (B) Permutation tests of models: dashed lines represent the observed accuracy of the combined (light blue), histology (purple) and endoscopy (green) models. The endoscopic, histological and combined models have a p-value of p =
= 3
3 ×
× 10−3, p
 =
= 5
5 ×
× 10−6 and p
 =
= 1
1 ×
× 10−6 respectively. The grey dashed line represents the average expected performance of random model. Solid coloured lines show the distribution of random permutations for each model. (C) Classification of IBDU patients with the combined model in Crohn’s disease (red) or ulcerative colitis (blue) subtypes. The classification posterior probability indicates the confidence of the model in assigning UC or CD labels. (D) Cumulative confidence in IBDU reclassification represented as cumulative density function (red line) of posterior probabilities for 29 IBDU patients. Each dot represents an IBDU patient.


