| PMC full text: |
|
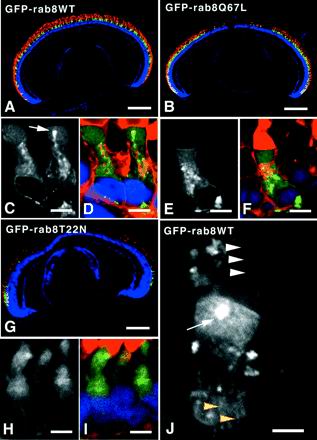
Figure 1

Expression pattern of rab8WT, rab867L, and rab822N determined by fluorescence microscopy. Frozen sections of eyes from 6-week-old transgenic tadpoles were imaged by confocal microscopy. Selected sections were labeled with the nuclear stain Hoechst 33342 and either antirhodopsin mAb mabE followed by CY3-conjugated secondary antibody (A, B, and G) or TR-WGA (C–F, H, and I). In tri-color pictures, the GFP signal is represented in green, Hoechst stain in blue, and antibody or TR-WGA labeling in red. Grayscale images show only the GFP signal. For all three transgene constructs, green fluorescence was restricted to the major rod photoreceptors, whose OS bound mabE (A, B, and G). GFP fusion proteins were primarily observed in the IS of these rods. GFP-rab8WT did not cause retinal degeneration (A). However, both GFP-rab8Q67L (B) and GFP-rab8T22N (G) caused central retinal rod degeneration as evidenced by the lack of green and red fluorescence in the central retinas in these tadpoles. Retinal degeneration caused by GFP-rab8T22N was more extensive, sparing only a few peripheral rod photoreceptors. At higher magnification, the transgene products GFP-rab8WT and GFP-rab8Q67L appeared to be primarily associated with internal membranes of the IS (C and E), although fluorescence was also observed in the cytoplasm of the IS, and to a lesser extent in the OS. Membrane-associated GFP-rab8WT and GFP-rab8Q67L colocalized with TR-WGA label (D and F), indicating that these fusion proteins were associated with Golgi and post-Golgi membranes. A bright spot of green fluorescence was often observed just below the IS/OS junction near the predicted location of the PRC (white arrows, C and J). In contrast, GFP-rab8T22N appeared to be primarily cytoplasmic (H and I). Imaging of GFP-rab8T22N was more limited because the only surviving rods were the small arched rods confined to the peripheral retina. GFP-rab8WT was also observed along axially aligned structures in the IS (J, yellow arrowheads) and in the calycal processes that surround the OS (J, white arrowheads), but its relative abundance in calyces was low. Bars, A, B, and G, 250 μm; C, D, E, F, H, and I, 5 μm; J, 2.5 μm.


