| PMC full text: | Mol Cell. Author manuscript; available in PMC 2019 Apr 19. Published in final edited form as: Mol Cell. 2018 Apr 19; 70(2): 197–210.e7. doi: 10.1016/j.molcel.2018.03.018 |
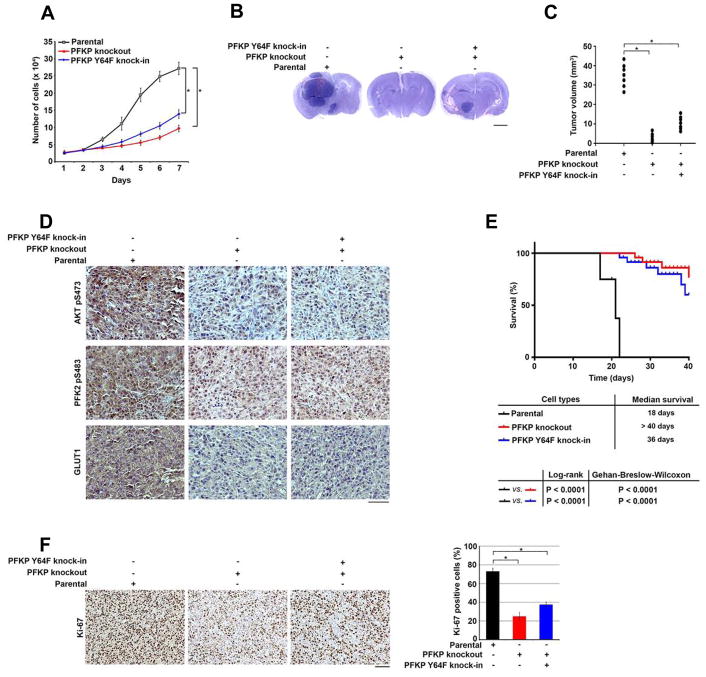
Figure 6

(A) U87/EGFRvIII cells with or without knockout of PFKP or knock-in of PFKP Y64F mutant were cultured in 1% serum medium for the indicated time periods and were harvested for cell counting. Data represent the mean ± SD of three independent experiments. *p < 0.001, based on the Student’s t test.
(B, C) A total of 5 × 10⁵ U87/EGFRvIII cells with or without knockout of PFKP or knock-in of PFKP Y64F mutant were intracranially injected into athymic nude mice. After 2 weeks, the mice were euthanized and examined for tumor growth. Hematoxylin and eosin–stained coronal brain sections show representative tumor xenografts. Scale bar, 2 mm. (B). Tumor volumes were measured by using length (a) and width (b) and calculated by using the equation: V = ab2/2. Data represent the means ± SD of 7 mice. *p < 0.001, based on the Student’s t test (C).
(D) IHC staining of the mouse tumor tissues was performed with the indicated antibodies. Representative images are shown. Scale bar, 100 μm.
(E) A total of 5 × 10⁵ U87/EGFRvIII cells with or without knockout of PFKP or knock-in of PFKP Y64F mutant were intracranially injected into athymic nude mice. Mouse survival times were recorded and visualized using Kaplan-Meier survival curves. Data represent the means ± SD of 9 mice. Tables show median survival time of mice, and the p values were calculated by using the Log-rank test and Gehan-Breslow-Wilcoxon test, respectively.
(F) IHC analyses of the tumor tissues were performed with an anti-Ki-67 antibody. Representative staining (left panel) and quantification of the staining (right panel) are shown. Scale bar, 100 μm. *p < 0.001, based on the Student’s t test.


