| PMC full text: | Published online 2020 Mar 27. doi: 10.1038/s41598-020-62414-z
|
Figure 1

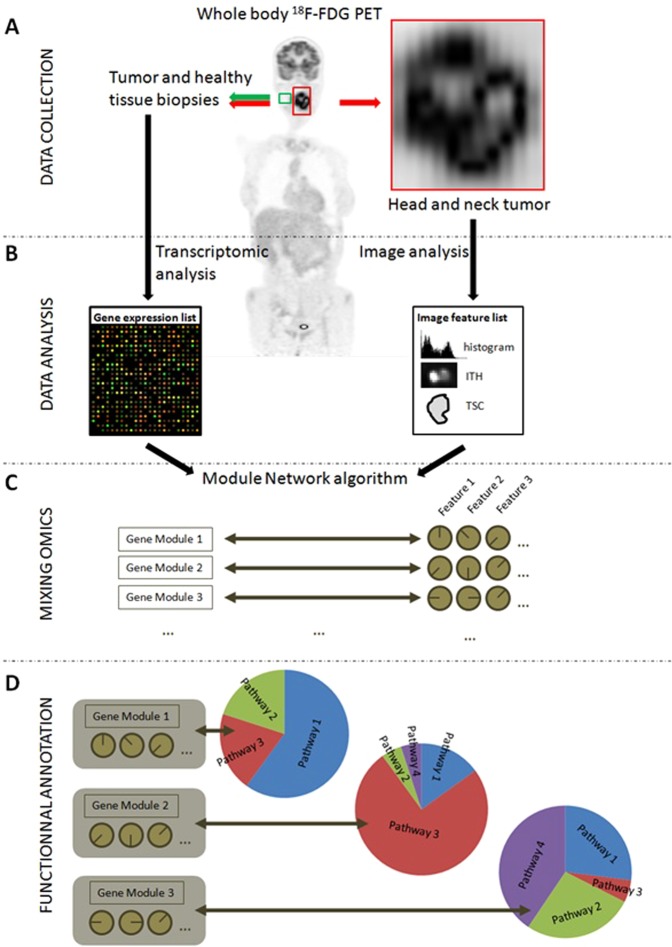
Global study workflow. (A) 18F-FDG PET acquisition and biopsies (both tumor and healthy tissues). (B) Data Analysis: RNAs were extracted from the surgical pieces and a transcriptome analysis was performed using Agilent 4 ×
× 44
44 K microarrays. From PET images, tumors were automatically delineated and then PET radiomic features were calculated. (C) A module network algorithm was used to identify thresholds on PET features than could be used to split the gene list into modules of co-regulated genes. (D) The genes from each module were functionally annotated and placed into the main pathway to which they belonged. This last step allowed correlating altered pathways within gene modules and PET radiomic features.


