Logo of radaiLink to Publisher's site
PMC full text:

Figure 1b:

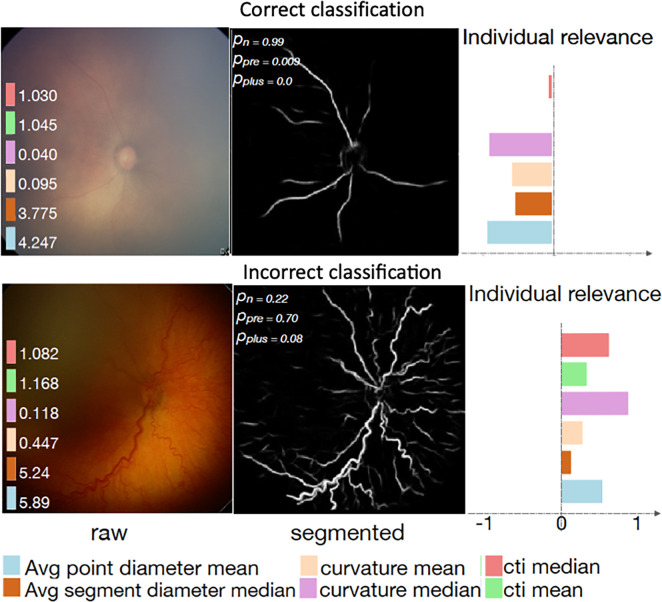
Examples of interpretability methods used on medical images. (a) Guided backpropagation and gradient-weighted class activation mapping (Grad-CAM) used on MRI to interpret areas of a brain image used by a deep learning model classifying the input image as a high-grade glioma. (Adapted and reprinted, with permission, from reference 7). Importance of pixels are color-coded as red = high importance, blue = low importance. (b) Regression concept vectors used to assess relevance of selected features describing curvature, tortuosity, and dilatation of retinal arteries and veins from retinal images, analyzed by a deep convolutional neural network. In b, examples of a correctly and wrongly classified image are shown, allowing the interpretation that the network is more sensitive to curvature and dilatation concepts for the classification of normal images, while being more sensitive to tortuosity for disease images. (Adapted and reprinted, with permission, from reference 6). Avg = average, cti = cumulative tortuosity index, Pn, Ppre, Pplus = network probabilities for normal, pre, and pre-plus classes.

Examples of interpretability methods used on medical images. (a) Guided backpropagation and gradient-weighted class activation mapping (Grad-CAM) used on MRI to interpret areas of a brain image used by a deep learning model classifying the input image as a high-grade glioma. (Adapted and reprinted, with permission, from reference 7). Importance of pixels are color-coded as red = high importance, blue = low importance. (b) Regression concept vectors used to assess relevance of selected features describing curvature, tortuosity, and dilatation of retinal arteries and veins from retinal images, analyzed by a deep convolutional neural network. In b, examples of a correctly and wrongly classified image are shown, allowing the interpretation that the network is more sensitive to curvature and dilatation concepts for the classification of normal images, while being more sensitive to tortuosity for disease images. (Adapted and reprinted, with permission, from reference 6). Avg = average, cti = cumulative tortuosity index, Pn, Ppre, Pplus = network probabilities for normal, pre, and pre-plus classes.

Images in this article

  • Examples of interpretability methods used on medical images. (a) Guided backpropagation and gradient-weighted class activation mapping (Grad-CAM) used on MRI to interpret areas of a brain image used by a deep learning model classifying the input image as a high-grade glioma. (Adapted and reprinted, with permission, from reference 7). Importance of pixels are color-coded as red = high importance, blue = low importance. (b) Regression concept vectors used to assess relevance of selected features describing curvature, tortuosity, and dilatation of retinal arteries and veins from retinal images, analyzed by a deep convolutional neural network. In b, examples of a correctly and wrongly classified image are shown, allowing the interpretation that the network is more sensitive to curvature and dilatation concepts for the classification of normal images, while being more sensitive to tortuosity for disease images. (Adapted and reprinted, with permission, from reference 6). Avg = average, cti = cumulative tortuosity index, Pn, Ppre, Pplus = network probabilities for normal, pre, and pre-plus classes.
  • Examples of interpretability methods used on medical images. (a) Guided backpropagation and gradient-weighted class activation mapping (Grad-CAM) used on MRI to interpret areas of a brain image used by a deep learning model classifying the input image as a high-grade glioma. (Adapted and reprinted, with permission, from reference 7). Importance of pixels are color-coded as red = high importance, blue = low importance. (b) Regression concept vectors used to assess relevance of selected features describing curvature, tortuosity, and dilatation of retinal arteries and veins from retinal images, analyzed by a deep convolutional neural network. In b, examples of a correctly and wrongly classified image are shown, allowing the interpretation that the network is more sensitive to curvature and dilatation concepts for the classification of normal images, while being more sensitive to tortuosity for disease images. (Adapted and reprinted, with permission, from reference 6). Avg = average, cti = cumulative tortuosity index, Pn, Ppre, Pplus = network probabilities for normal, pre, and pre-plus classes.
  • Gradient-based saliency maps for image classification. (a) Basic concepts of neuron activation. A neuron is activated via a weighted combination of inputs and application of an activation function, g. (b) Gradient-based methods rely on a forward and a backward pass. Given an input image x, a class k is maximally activated through forward passing throughout all layers of the network. All positive forward activations are recorded for later use during the backward pass. To visualize the contribution of pixels in the image to the class k, all activations are set to zero except for the studied class k, and then (c) backpropagation uses the chain rule to compute gradients from the output to the input of the network. ReLU = rectified linear unit, tanh = hyperbolic tangent.
  • Gradient-based saliency maps for image classification. (a) Basic concepts of neuron activation. A neuron is activated via a weighted combination of inputs and application of an activation function, g. (b) Gradient-based methods rely on a forward and a backward pass. Given an input image x, a class k is maximally activated through forward passing throughout all layers of the network. All positive forward activations are recorded for later use during the backward pass. To visualize the contribution of pixels in the image to the class k, all activations are set to zero except for the studied class k, and then (c) backpropagation uses the chain rule to compute gradients from the output to the input of the network. ReLU = rectified linear unit, tanh = hyperbolic tangent.
  • Gradient-based saliency maps for image classification. (a) Basic concepts of neuron activation. A neuron is activated via a weighted combination of inputs and application of an activation function, g. (b) Gradient-based methods rely on a forward and a backward pass. Given an input image x, a class k is maximally activated through forward passing throughout all layers of the network. All positive forward activations are recorded for later use during the backward pass. To visualize the contribution of pixels in the image to the class k, all activations are set to zero except for the studied class k, and then (c) backpropagation uses the chain rule to compute gradients from the output to the input of the network. ReLU = rectified linear unit, tanh = hyperbolic tangent.
  • A, Local interpretable model-agnostic explanations (LIME) method approximates a complex model f (eg, a neural network) with a simplified model g (eg, linear model) around the input case I being interpreted. B, Perturbed instances (Ip)1,...,n are produced, and C, predictions f(Ip)1,...,n = p1,...,n are obtained. D, The similarity  I(Ip)1,...,n between the input image I and each perturbed instance (Ip)1,...,n is measured, and these values are used as weights to fit a simpler (eg, linear) model g, in a weighted fashion. The size of red crosses and blue circles illustrates weights. E, An explanation,  (I), is generated by minimizing the disagreement between f and g (ie, how well g approximates f) while keeping the complexity of model g, as measured by  (g), low. Note: Perturbations can be of any type; in this example, image regions are blacked out. The similarity metric  I as well as the model g can be selected by the user.
  • A, Testing with concept activation vectors (TCAVs) requires a set of samples characterizing the concept (eg,  honeycomb pattern,  a set of  nonconcept  examples, which are not related to the concept being studied), B, a testing dataset of the class k of interest (eg, idiopathic pulmonary fibrosis), and, C, a complex model f (eg, neural network) that one desires to interpret, and which has been trained to perform classification of these classes. D, A linear model is built from the concept and nonconcept samples using model f, by employing model f to generate classification labels for the concept and nonconcept samples. E, From the resulting linear model, separating concept from nonconcept examples (dotted line in D), its main perpendicular direction vcl (red arrow in D) can be obtained to assess the sensitivity of model f to concept C at layer l by quantifying changes to the activations of model f in the vcl direction.
  • Different modalities for model interpretation. For example, an artificial intelligence (AI) system that predicts the condition from a patient s chest radiograph is shown. From top to bottom, interpretability information is added to the decision: (1) no interpretability information, (2) added output probabilities, (3) added visual saliency information describing areas of the image driving the prediction, (4) added matched real cases used during training of the AI solution influencing the prediction (ie, influential functions), and (5) added computer-generated semantic explanation.
Click on the image to see a larger version.