Abstract
Background and purpose
We investigated the relationship between tumor blood-flow measurement based on perfusion imaging by arterial spin-labeling (ASL-PI) and histopathologic findings in brain tumors.Materials and methods
We used ASL-PI to examine 35 patients with brain tumors, including 11 gliomas, 9 meningiomas, 9 schwannomas, 1 diffuse large B-cell lymphoma, 4 hemangioblastomas, and 1 metastatic brain tumor. As an index of tumor perfusion, the relative signal intensity (SI) of each tumor (%Signal intensity) was determined as a percentage of the maximal SI within the tumor per averaged SI within normal cerebral gray matter on ASL-PI. Relative vascular attenuation (%Vessel) was determined as the total microvessel area per the entire tissue area on CD-34-immunostained histopathologic specimens. MIB1 indices of gliomas were also calculated. The differences in %Signal intensity among different histopathologic types and between high- and low-grade gliomas were compared. In addition, the correlations between %Signal intensity and %Vessel or MIB1 index were evaluated in gliomas.Results
Statistically significant differences in %Signal intensity were observed between hemangioblastomas versus gliomas (P < .005), meningiomas (P < .05), and schwannomas (P < .005). Among gliomas, %Signal intensity was significantly higher for high-grade than for low-grade tumors (P < .05). Correlation analyses revealed significant positive correlations between %Signal intensity and %Vessel in 35 patients, including all 6 histopathologic types (rs = 0.782, P < .00005) and in gliomas (rs = 0.773, P < .05). In addition, in gliomas, %Signal intensity and MIB1 index were significantly positively correlated (rs = 0.700, P < .05).Conclusion
ASL-PI may predict histopathologic vascular densities of brain tumors and may be useful in distinguishing between high- and low-grade gliomas and in differentiating hemangioblastomas from other brain tumors.Free full text

Perfusion Imaging of Brain Tumors Using Arterial Spin-Labeling: Correlation with Histopathologic Vascular Density
Abstract
BACKGROUND AND PURPOSE: We investigated the relationship between tumor blood-flow measurement based on perfusion imaging by arterial spin-labeling (ASL-PI) and histopathologic findings in brain tumors.
MATERIALS AND METHODS: We used ASL-PI to examine 35 patients with brain tumors, including 11 gliomas, 9 meningiomas, 9 schwannomas, 1 diffuse large B-cell lymphoma, 4 hemangioblastomas, and 1 metastatic brain tumor. As an index of tumor perfusion, the relative signal intensity (SI) of each tumor (%Signal intensity) was determined as a percentage of the maximal SI within the tumor per averaged SI within normal cerebral gray matter on ASL-PI. Relative vascular attenuation (%Vessel) was determined as the total microvessel area per the entire tissue area on CD-34–immunostained histopathologic specimens. MIB1 indices of gliomas were also calculated. The differences in %Signal intensity among different histopathologic types and between high- and low-grade gliomas were compared. In addition, the correlations between %Signal intensity and %Vessel or MIB1 index were evaluated in gliomas.
RESULTS: Statistically significant differences in %Signal intensity were observed between hemangioblastomas versus gliomas (P < .005), meningiomas (P < .05), and schwannomas (P < .005). Among gliomas, %Signal intensity was significantly higher for high-grade than for low-grade tumors (P < .05). Correlation analyses revealed significant positive correlations between %Signal intensity and %Vessel in 35 patients, including all 6 histopathologic types (rs = 0.782, P < .00005) and in gliomas (rs = 0.773, P < .05). In addition, in gliomas, %Signal intensity and MIB1 index were significantly positively correlated (rs = 0.700, P < .05).
CONCLUSION: ASL-PI may predict histopathologic vascular densities of brain tumors and may be useful in distinguishing between high- and low-grade gliomas and in differentiating hemangioblastomas from other brain tumors.
Arterial spin-labeling perfusion imaging (ASL-PI) is an MR imaging technique for perfusion measurement. This unique technique requires no extrinsic tracer, such as gadolinium chelates or radionuclides. Instead, it uses electromagnetically labeled arterial blood water as a freely diffusible intrinsic tracer. In clinical applications, this technique has proved reliable and reproducible in the assessment of cerebral blood flow (CBF) in various pathologic states, including cerebrovascular disease,1–3 neurodegenerative disease,4,5 and temporal lobe epilepsy.6,7
Some clinical studies have reported the clinical usability in differential diagnosis as well as the therapeutic efficacy of the brain tumor based on tumor blood flow (TBF) measured by ASL-PI.8–13 However, the relationship between ASL-PI and histopathologic findings has not been sufficiently understood. The purpose of our study was to compare ASL-PI to histopathologic findings in brain tumors.
Materials and Methods
Patient Population
In 2005 and 2006, 40 patients with brain tumors underwent ASL-PI at Kyushu University Hospital. Three patients with recurrent tumors (1 glioblastoma, 1 anaplastic oligodendroglioma, and 1 dysembryoplastic neuroepithelial tumor [DNT]) were excluded from this study because they had already undergone surgery, radiation therapy, or chemotherapy. One patient with a metastatic tumor diagnosed by cytology was excluded because of the absence of a histologic specimen. One patient with a pleomorphic xanthoastrocytoma was excluded because the tumor cells as well as the vascular endothelial cells were immunostained for CD-34 and the histopathologic vascular attenuation was impossible to measure accurately. The remaining 35 patients (13 men and 22 women; age range, 4–76 years; median age, 50.7 years) were included in our study. Histologic diagnoses of the tumors according to the World Health Organization (WHO) brain tumor classification revised in 200714 included 11 gliomas (5 glioblastomas [WHO grade IV], 1 anaplastic oligodendroglioma [III], 1 gliomatosis cerebri [III], 3 diffuse astrocytomas [II], and 1 DNT [I]), 9 meningiomas (6 meningiomas of WHO grade I, 2 atypical meningiomas, and 1 papillary meningioma), 9 schwannomas, 1 diffuse large B-cell lymphoma, 4 hemangioblastomas, and 1 metastatic brain tumor. Written informed consent was obtained from each patient or the patient's parent with the approval of the institutional review board. The histologic specimen was obtained by partial or total surgical resection in 32 patients, open biopsy in 2 patients, and stereotactic biopsy in 1 patient.
MR Imaging
All ASL-PI examinations were performed on a clinical 1.5T MR imaging unit (Magnetom Symphony; Siemens, Erlangen, Germany) with a product transmit/receive head coil within 0–40 days before surgery. ASL-PI was performed by using a second version of quantitative imaging of perfusion by means of a single subtraction with the addition of thin-section periodic saturation (Q2TIPS), which is a pulsed arterial spin-labeling method that enables the acquisition of multiple sections.15 Q2TIPS has 2 important planes and 3 parameters: a labeling plane; an imaging plane; and TI1, TI1S, and TI2.15 The labeling plane is the region where the proximal arterial blood is labeled by an inversion recovery radio-frequency pulse. The imaging plane is the region where the data acquisition of the perfusion imaging is performed. TI1 is a timing parameter representing the amount of time that passes between the inversion recovery pulse for labeling the blood and the periodic saturation pulse, both of which are applied to the labeling plane. Therefore, TI1 is related to the amount of labeled blood volume. TI1S is a timing parameter and represents the amount of time between the inversion recovery pulse for labeling and the end of the saturation pulse on the labeling plane. TI2 is a timing parameter and represents the amount of time between the inversion recovery pulse for labeling and the beginning of the imaging data acquisition by an echo-planar imaging (EPI) sequence. Under the current Q2TIPS setting, the labeling plane comprised a 100-mm-wide region and was placed 10 mm proximal to the imaging plane. The imaging plane was set so as to coincide with the greatest dimension of the tumor by reference to the findings on T1-weighted images (T1WI), T2- weighted images (T2WI), and fluid-attenuated inversion recovery images (FLAIR).
Five imaging sections were acquired sequentially in a proximal-to-distal direction by using a single-shot gradient-echo EPI technique (section width/gap = 5 /2.5 mm, TR/TE = 2100/26 ms, FOV = 240 × 240 mm, matrix = 64 × 64 pixels, voxel size = 3.75 × 3.75 × 5 mm, band width = 1532 Hz/pixel, crusher gradients = 10 cm/s, phase partial Fourier acquisition rate = 6/8, phase oversampling = 13%, acquisition time per section = 49.5 ms). The signal intensity of the perfusion images was corrected for the delay due to the sequential acquisition. The inversion and saturation pulse parameters of Q2TIPS were set as follows: TI1 = 900 ms, TI1S = 1300 ms, and TI2 = 1400 ms. Fifty pairs of labeled and nonlabeled images were obtained in 3 minutes 30 seconds. The perfusion images were generated by subtracting the labeled image from the nonlabeled image at each section position.
In addition to ASL-PI, conventional images including T1WI, T2WI, FLAIR, and postcontrast T1WI were obtained by using any of 3 different clinical 1.5T MR imaging units (Magnetom Vision and Symphony, Siemens; Achieva, Royal Philips Electronics, Eindhoven, the Netherlands). The parameters for those conventional images were as follows: T1WI: TR/TE = 441–620/9.5–14 ms; T2WI: TR/TE = 2500–4902.5/90–100 ms; FLAIR: TR/TE/ TI = 9000/97–110/2200–2400 ms; postcontrast T1WI: TR/TE = 525–800/17 ms. Postcontrast images were obtained after intravenous administration of gadolinium diethylene triamine pentaacetic acid (0.1 mmol/kg; Magnevist, Nihon Schering, Osaka, Japan). In 1 patient, postcontrast T1WI was not performed because the patient had asthma.
ASL Data Processing
By reference to the findings on T1WI, T2WI, FLAIR, and postcontrast T1WI, a region of interest that had a size of at least 26 pixels was placed within the tumor. Additionally, on the same image, another region of interest was placed within the normal-appearing cortical gray matter (GM) in the contralateral cerebral hemisphere on a simply visual basis. Each region of interest was set by a neuroradiologist (T.N.) who was not blinded to the diagnosis. As an index of tumor perfusion, we used a relative signal intensity (SI) (%Signal intensity), which was defined as the ratio of maximal SI within the tumor (Tmax) to the averaged SI of GM (GMav) (%Signal intensity = Tmax / GMav × 100[%]). The relative perfusion index was used rather than the absolute blood-flow value because the accuracy of the absolute perfusion measurement by using Q2TIPS has not been fully established, especially in pathologic conditions.8,9 Although the absolute blood flow value could be theoretically determined by using ASL,15,16 the quantitative CBF by using the ASL sequence can be affected by unstable factors such as the arterial transit time of the labeled blood from the labeling plane to the brain tissue within the imaging plane, the local relaxation times of tissue and blood, the assumption of a constant T1 relaxation time of arterial blood irrespective of vessel size or blood oxygenation,10 and the equilibrium magnetization and T1 value of the blood.17 CBF values measured by using ASL are thought to be proportional rather than equivalent to the actual regional CBF values.8,9
Additionally, considering the large interindividual differences in perfusion,18 the relative perfusion measurement is the most reliable method at present. The averaged SI of GM instead of that of white matter (WM) was adopted as a reference of relative perfusion because the arterial transit time of WM was much longer than that of GM, resulting in a substantial underestimation of the blood flow for WM.19,20 The maximal SI rather than the averaged SI of brain tumors was adopted as a parameter for relative perfusion to detect the most vascularized portion of the tumor, which may correspond to the highest grade region.11
Histopathologic Evaluations
We examined the vascular attenuation and the cell proliferation as the histopathologic parameters of the tumors.
To evaluate the vascular attenuation of the brain tumors, we immunostained the tissue sections for CD-34 (Novocastra Laboratories, Newcastle, UK), which identifies vascular endothelial cells. A microscopic field of the most intense vascularization in each specimen under a ×20 objective field (area = 0.33 mm2) was photographed as a JPEG file (1600 × 1200 pixels, 16.7 million colors, 8-bit) with a microscope digital color camera (Microscope Digital Camera DP20; Olympus, Tokyo, Japan). For each tumor, the relative vascular attenuation (%Vessel) was defined as the total area of vessel lumina surrounded by the endothelial cell layer as a percentage of the entire tissue area. The vessel lumina were recognized as an area surrounded by the CD-34–positive endothelial cell layer. On the image, the vessel area was distinguished by color by using Photoshop CS2 (Adobe Systems, San Jose, Calif). The tissue area was extracted by excluding the tissue-free space on the image by using Adobe Photoshop CS2. The image was analyzed with Image ALPHA 4.0.3.2 (Scion, Frederick, Md) to measure %Vessel by counting the pixel number of the total vessel lumina and that of the entire tissue.9,21–23
To assess the proliferative activities of tumor cells, we immunostained glioma tissue sections with MIB1 (Dako, Glostrup, Denmark), a monoclonal antibody against Ki-67 antigen that is expressed throughout the cell cycle except at the G0 stage.24–26 The MIB1 index was measured in the microscopic area that showed the greatest number of immunopositive nuclei under a ×20 objective as a JPEG file with the microscope digital color camera by using the same conditions as previously described. MIB1 index was calculated as the percentage of the positive nuclei area divided by the whole nuclei area by using free computer software (Gunma-LI, Version 017; Gunma University, Gunma, Japan; available at http://omt.med.gunma-u.ac.jp/~tgaku/GunmaLI).
Data Analysis
%Signal intensity among the 4 histopathologic types including hemangioblastomas, gliomas, meningiomas, and schwannomas were compared by using the Kruskal-Wallis test with a Scheffé post hoc analysis under a significance level of .05.
The correlations between %Signal intensity and %Vessel were examined for 35 tumors, including all 6 histopathologic types, as well as for each of the 4 histopathologic types (ie, hemangioblastomas, gliomas, meningiomas, schwannomas). The correlations were then evaluated by using single linear regression analysis and Spearman signed rank test. P values under the level of .05 after application of the Bonferroni adjustment for multiple comparisons (5 comparisons) were considered statistically significant.
In gliomas, the cell-proliferation potency estimated by the MIB1 index is closely related to the histologic grade.27 We thus examined the correlation between %Signal intensity and the MIB1 index of gliomas by using single linear regression analysis and the Spearman signed rank test under the significance level of .05.
ASL-PI is reportedly useful for differentiating between high-grade (WHO grade III or IV) versus low-grade (I or II) gliomas.9–12 We examined the difference in %Signal intensity between high- and low-grade gliomas by using Mann-Whitney U test under the significance level of .05.
Results
Figure 1 shows the differences in %Signal intensity among hemangioblastomas, gliomas, meningiomas, and schwannomas. There were statistically significant differences in %Signal intensity between hemangioblastomas on the one hand and, on the other, gliomas (P < .005), meningiomas (P < .05), and schwannomas (P < .005). No statistically significant difference was observed between any other combinations.
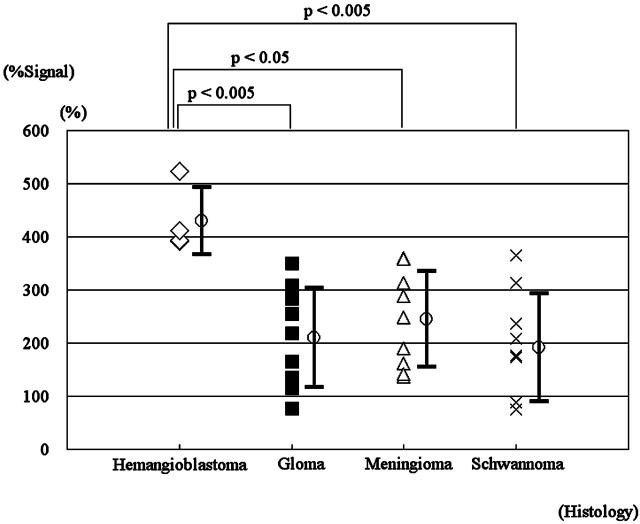
Relative maximal %Signal intensity in 4 histopathologic types of brain tumors. Statistically significant differences between hemangioblastomas and gliomas (P < .005), and meningiomas (P < .05) and schwannomas (P < .005) are revealed (Kruskal-Wallis test with Scheffé post hoc analysis).
Figure 2 shows the correlations between %Signal intensity and %Vessel. There were positive correlations between %Signal intensity and %Vessel in the 35 cases ({x: %Signal intensity, y: %Vessel}, y = 9.72x + 1.49, r2 = 0.627; rs = 0.782, P < .00005) (Fig 2) and in gliomas (y = 11.6x + 1.49, r2 = 0.514; rs = 0.773, P < .05). Correlations in hemangioblastomas (rs = 0.200), meningiomas (rs = 0.717), and schwannomas (rs = 0.817) did not reach statistical significance due to the small sample sizes, though there were trends toward positive correlations in the latter 2 tumor types.
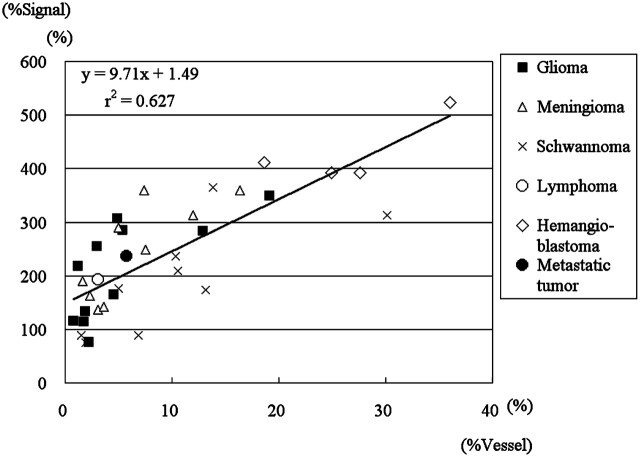
Scatter chart of %Signal intensity determined by ASL-PI and the %Vessel determined by histopathologic examination with regression lines in 35 tumors of 6 histopathologic types and 11 gliomas. Note the positive correlations between %Signal intensity and %Vessel in 35 cases ({x: %Signal intensity; y: %Vessel}, y = 9.71x + 1.49, r2 = 0.627; rs = 0.782, P < .00005) and in gliomas (y = 1.16x + 1.49, r2 = 0.514; rs = 0.773, P < .05).
Figure 3 shows the correlation between %Signal intensity and MIB1 index in gliomas. There was a positive correlation between %Signal intensity and MIB1 index in gliomas (y = 2.30x +1.67, r2 = 0.397; rs = 0.700, P < .05).
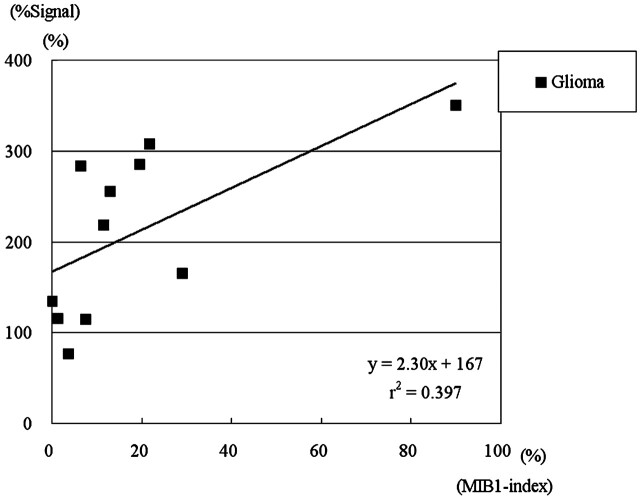
Scatter chart of %Signal intensity determined by ASL-PI and MIB1 index determined by histopathologic examination with a regression line in 12 gliomas. Note the positive correlation between %Signal intensity and MIB1 index in gliomas ({x: %Signal intensity; y: %Vessel}, y = 2.30x + 1.67, r2 = 0.397; rs = 0.700, P < .05).
Figure 4 shows the difference in %Signal intensity between high-grade and low-grade gliomas. High-grade gliomas showed significantly higher %Signal intensity than low-grade gliomas (P < .05).
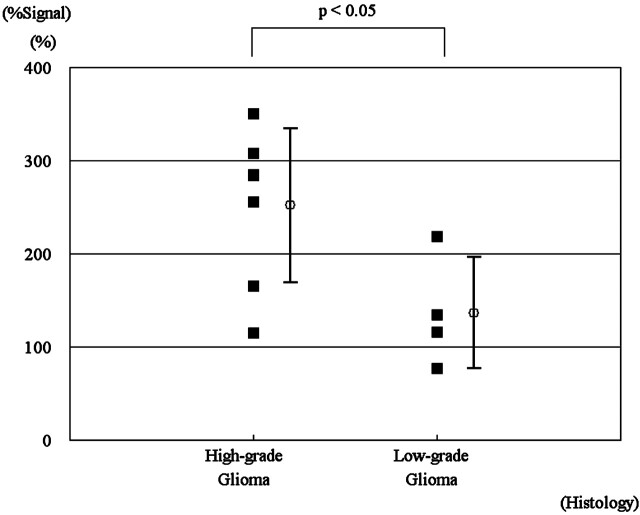
The relative maximal %Signal intensity in high- and low-grade gliomas. Note the significant difference between high- and low-grade gliomas (P < .05).
Figures 5 and and66 show representative cases of a hemangioblastoma and a glioblastoma, respectively.
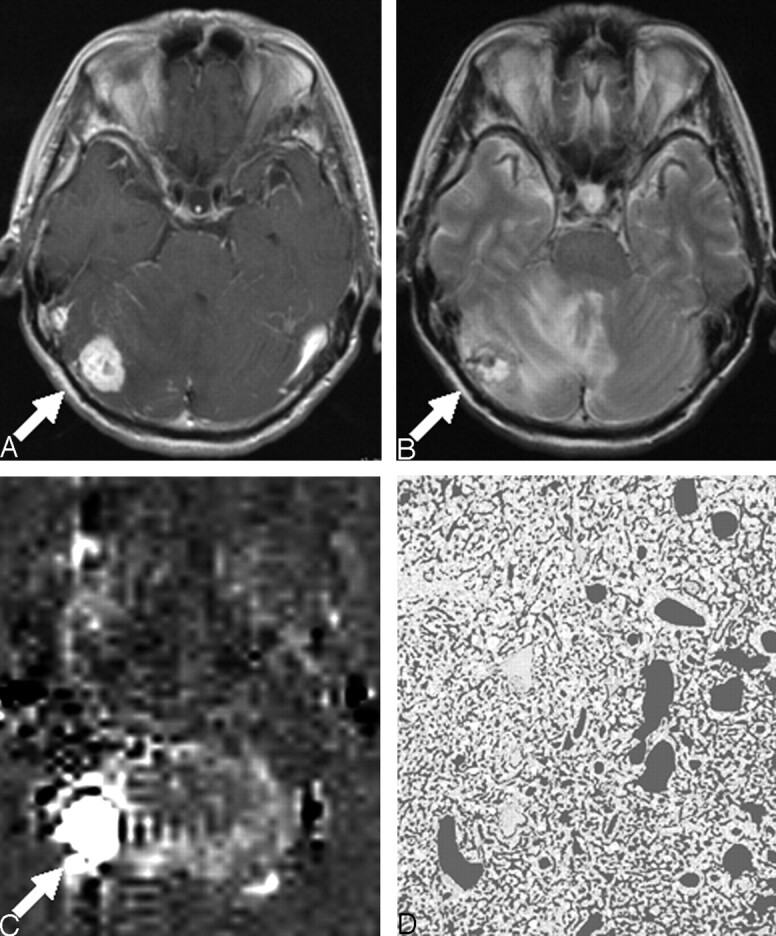
A 61-year-old woman with hemangioblastoma; postcontrast T1WI (TR/TE = 525/17 ms) (A), T2WI (2500/15 ms) (B), perfusion image by ASL (C), and CD-34–immunostained histopathologic specimen with the dark gray color overlaid on vessel lumen areas (×20) (D). A, Postcontrast T1WI shows a strongly enhanced mass (arrow) in the right cerebellar hemisphere. B, T2WI shows a high-signal-intensity mass (arrow) with surrounding edema. C, Perfusion image by ASL shows remarkably high signal intensity (%Signal intensity = 524%) (arrow). D, The image analysis of the CD-34–immunostained histopathologic specimen shows attenuated vascular proliferation (%Vessel = 36.0%).
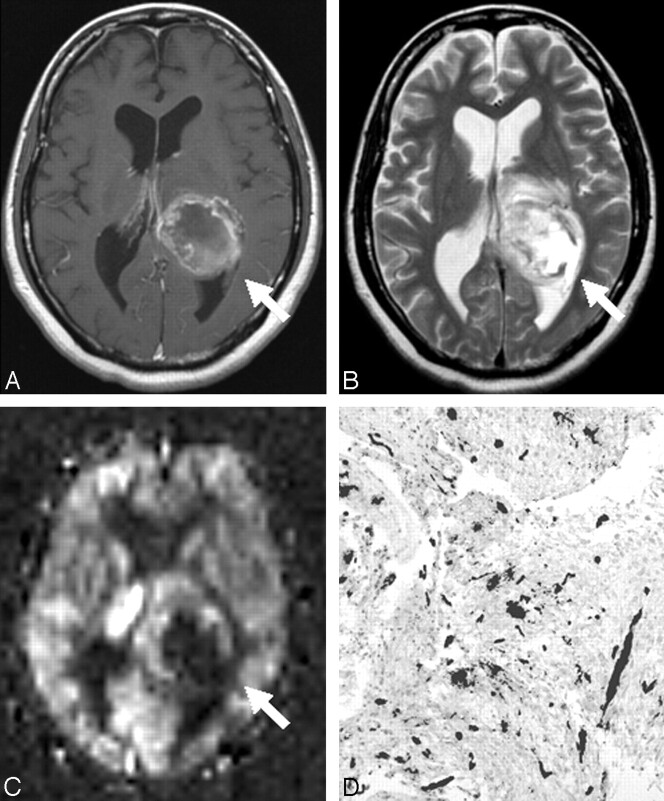
A 44-year-old woman with glioblastoma; postcontrast T1WI (591/17 ms) (A), T2WI (2800/93 ms) (B), perfusion image by ASL (C), and CD-34–immunostained histopathologic specimen with the dark gray color overlaid on vessel lumen areas (×20) (D). A, Postcontrast T1WI reveals a ringlike enhancing mass (arrow) in the left cerebral hemisphere. B, T2WI shows the high-intensity mass (arrow) with peritumoral edema. C, On the perfusion image by ASL, the tumor was depicted as a high-intensity area (%Signal intensity = 265%) with a central low perfusion area (arrow). Image analysis of the CD-34–immunostained histopathologic specimen shows scattered vascular proliferation (%Vessel = 2.97%).
Discussion
In previous reports, ASL-PI has been found useful in differentiating between high- and low-grade gliomas9–12; distinguishing glioblastomas from metastases, CNS lymphomas, and all other glioma grades9; and predicting the outcome of metastatic brain tumor after radiosurgery.8 In our study, we recruited patients with brain tumors of various relatively common histologic types, including glioma, meningioma, schwannoma, malignant lymphoma, hemangioblastoma, and metastatic brain tumor and compared the TBF among them. We found that the %Signal intensity of the hemangioblastomas was significantly higher than that of the other 3 types of the brain tumors (gliomas, meningiomas, and schwannomas) (Fig 1), indicating that hemangioblastoma had the highest TBF. Histopathologically, hemangioblastoma is characterized by channels of thin-walled tightly packed blood vessels, varying in size and interspersed by polygonal lipid-laden stromal cells.28 Our result may reflect high TBF through the abundant vessel network. This finding might be of use in differentiating hemangioblastomas from brain tumors in the posterior fossa. However, we did not compare hemangioblastoma versus metastases on the posterior fossa. Toward this end, additional examinations are desirable.
We found a positive correlation between %Signal intensity and %Vessel in the 35 patients. This may suggest that ASL-PI reflects the histopathologic vascularity across different types of brain tumors. We assume that the lack of a significant correlation in hemangioblastomas, meningiomas, and schwannomas was due to the small number of patients.
There have been only a few reports regarding the correlation between ASL-PI and the histopathologic findings in brain tumors.9,13 Kimura et al13 reported a significant correlation in meningiomas between the relative mean TBF and the microvessel area, defined in the microvessel area as a percentage of the total area in each field. In our study, there was a trend toward a positive correlation between %Signal intensity and %Vessel in meningioma, though it did not reach statistical significance, probably due to the small sample size. This finding was consistent with the results of Kimura et al. Weber et al9 attempted to elucidate the relationship between the average or maximal regional relative TBF on ASL-PI and the histopathologic findings, including the cell proliferation index, the microvessel area, and microvessel attenuation as defined by the number of microvessels.9 However, these comparisons yielded no significant correlations. They speculated that the lack of correlation might be attributable to the limitation of inherent sampling error associated with the high rate of stereotactic biopsy in their series (23/79 patients). In our study, only 1 patient was diagnosed by stereotactic biopsy, and the others were diagnosed by either surgical resection or open biopsy, which might have resulted in better histopathologic correlation with ASL-PI.
There are several indices for evaluating tumor vascular proliferation other than vascular attenuation, which was used in this study. These include microvessel attenuation and size. Microvessel attenuation is well known as an indicator of the degree of malignancy in histopathologic studies of glioma,21,22 whereas microvessel area has also been reported as an indicator of malignant potential.23 Exploration of the relationship between ASL-PI and those parameters of vascular proliferation is needed.
Among the gliomas, a statistically significant difference between high- and low-grade tumors was observed (Fig 4). Previous studies have shown that tumor blood volume, measured by dynamic susceptibility contrast MR perfusion imaging, provides useful information for assessing glioma grade.29 More recently, it was reported that TBF measured by noninvasive ASL-PI could also be suitable for differentiating high-grade from low-grade gliomas.9–12 Our result was in agreement with those reports. Given the positive correlation in our result between %Signal intensity and %Vessel in glioma, %Signal intensity could be an indicator of malignancy by depicting vascular attenuation. On the other hand, %Signal intensity positively correlated with the MIB1 index (Fig 3). However, it may be possible that the single data point of a very high MIB1 index mainly contributed to the positive correlation. Further studies to confirm this are needed.
This study has several limitations. The accuracy of blood flow measurement was limited by a low signal intensity-to-noise ratio, which is inherent in ASL-PI.30,31 This could be serious, especially in the posterior fossa, where signal intensity loss can occur due to the susceptibility effect by the skull base bone. Low spatial resolution (3.75 × 3.75 × 5 mm) and limited section coverage (5 imaging sections of 3.5 cm of total width) were other technical limitations. The difference in feeding arteries (eg, internal carotid artery versus external carotid artery) may have affected the timing of the bolus arrival, possibly resulting in potential bias. There is a possible disagreement between the measurement region of signal intensity on ASL-PI and vascular attenuation on the histopathologic specimen. Further technical improvements and investigations with larger numbers of subjects are needed to confirm the results of our study.
Conclusion
Our results revealed a general positive correlation between %Signal intensity and %Vessel in brain tumors, suggesting that ASL-PI may predict the histopathologic vascular attenuation of brain tumors. ASL-PI may be useful in differentiating hemangioblastoma from other brain tumors and in distinguishing between high- and low-grade gliomas.
Acknowledgments
We thank Saori Uchida (Department of Neurosurgery, Kyushu University) for her helpful technical assistance.
Footnotes
This work was supported by a Grant-in-Aid for Scientific Research from the Japan Society for the Promotion of Science.
References
Articles from AJNR: American Journal of Neuroradiology are provided here courtesy of American Society of Neuroradiology
Full text links
Read article at publisher's site: https://doi.org/10.3174/ajnr.a0903
Read article for free, from open access legal sources, via Unpaywall:
http://www.ajnr.org/content/ajnr/29/4/688.full.pdf
Free to read at intl.ajnr.org
http://intl.ajnr.org/cgi/content/abstract/29/4/688
Free after 18 months at intl.ajnr.org
http://intl.ajnr.org/cgi/content/full/29/4/688
Free after 18 months at intl.ajnr.org
http://intl.ajnr.org/cgi/reprint/29/4/688.pdf
Citations & impact
Impact metrics
Citations of article over time
Alternative metrics
Smart citations by scite.ai
Explore citation contexts and check if this article has been
supported or disputed.
https://scite.ai/reports/10.3174/ajnr.a0903
Article citations
Clinical Benefits of Arterial Spin-Labeling Magnetic Resonance Imaging for Primary Diffuse Large B-cell Lymphoma of the Central Nervous System Presenting With Lymphomatosis Cerebri: A Case Report.
Cureus, 16(8):e67577, 23 Aug 2024
Cited by: 0 articles | PMID: 39310434 | PMCID: PMC11416737
Diagnostic Efficacy of Dynamic Maneuver in Contrast-Enhanced Computed Tomography Compared With Conventional Contrast-Enhanced Computed Tomography in Imaging the Neck Region.
Cureus, 16(7):e65074, 22 Jul 2024
Cited by: 0 articles | PMID: 39171018 | PMCID: PMC11336514
The cortical high-flow sign of oligodendroglioma, IDH-mutant and 1p/19q-codeleted: comparison between arterial spin labeling and dynamic susceptibility contrast methods.
Neuroradiology, 66(2):187-192, 21 Dec 2023
Cited by: 0 articles | PMID: 38127124
Blood-brain barrier disruption imaging in postoperative cerebral hyperperfusion syndrome using DCE-MRI.
J Cereb Blood Flow Metab, 44(3):345-354, 01 Nov 2023
Cited by: 0 articles | PMID: 37910856 | PMCID: PMC10870963
Insights Into Meningioma Visibility on Arterial Spin Labeling MRI: Location Outweighs Size.
Cureus, 15(6):e40204, 10 Jun 2023
Cited by: 1 article | PMID: 37304385 | PMCID: PMC10257063
Go to all (132) article citations
Similar Articles
To arrive at the top five similar articles we use a word-weighted algorithm to compare words from the Title and Abstract of each citation.
Assesment of perfusion in glial tumors with arterial spin labeling; comparison with dynamic susceptibility contrast method.
Eur J Radiol, 83(10):1914-1919, 15 Jul 2014
Cited by: 36 articles | PMID: 25087109
[Application value of whole brain 3D artery spin labeling in diagnosis of intracranial tumors].
Zhonghua Yi Xue Za Zhi, 97(23):1801-1804, 01 Jun 2017
Cited by: 2 articles | PMID: 28648002
[Grading of adults primitive glial neoplasms using arterial spin-labeled perfusion MR imaging].
J Neuroradiol, 38(4):207-213, 25 Feb 2011
Cited by: 5 articles | PMID: 21353707
A meta-analysis of arterial spin labelling perfusion values for the prediction of glioma grade.
Clin Radiol, 72(3):255-261, 06 Dec 2016
Cited by: 21 articles | PMID: 27932251
Review


