Abstract
Practical brain–computer interface (BCI) demands the learning-based adaptive model that can handle diverse problems. To implement a BCI, usually functional near-infrared spectroscopy (fNIR) is used for measuring functional changes in brain oxygenation and electroencephalography (EEG) for evaluating the neuronal electric potential regarding the psychophysiological activity. Since the fNIR modality has an issue of temporal resolution, fNIR alone is not enough to achieve satisfactory classification accuracy as multiple neural stimuli are produced by voluntary and imagery movements. This leads us to make a combination of fNIR and EEG with a view to developing a BCI model for the classification of the brain signals of the voluntary and imagery movements. This work proposes a novel approach to prepare functional neuroimages from the fNIR and EEG using eight different movement-related stimuli. The neuroimages are used to train a convolutional neural network (CNN) to formulate a predictive model for classifying the combined fNIR–EEG data. The results reveal that the combined fNIR–EEG modality approach along with a CNN provides improved classification accuracy compared to a single modality and conventional classifiers. So, the outcomes of the proposed research work will be very helpful in the implementation of the finer BCI system.
Keywords: Voluntary and imagery movements, Functional near-infrared spectroscopy (fNIR), Electroencephalography (EEG), Modeling and classification, Convolutional neural network (CNN), Brain–computer interface (BCI)
Introduction
The brain controls all human activities such as movements, mental workload, emotion, vision, thinking, attention, cognitive skills, senses, etc. The brain-functions are related to the variation of oxygen saturation of the blood, which is called hemodynamics [1, 2]. During the functioning of the brain, neurons (the unit of brain tissue) communicate with each other through the low potential electric signal. Therefore, changes in the concentration of oxygenated (HbO2) and deoxygenated (dHb) hemoglobin, as well as electrical potential measurement provide information about brain functioning. Electroencephalogram (EEG) and functional near-infrared spectroscopy (fNIR) are two non-invasive methods to measure electric potential and hemoglobin concentrations, respectively, from our brain [3–5].
Functional brain imaging has added a new dimension in biomedical engineering and explored the pathway to reach the brain–computer interface (BCI). BCI contributes to diverse fields of research in biomedical applications like prevention, detection, diagnosis, rehabilitation, and restoration [6]. In the field of BCI, EEG and MEG are two non-invasive modalities based on scalp electric potential. EEG has a very high temporal resolution (~ 1 ms) with a poor spatial resolution (EEG: 5 to 9 cm) [7]. Though MEG has both high temporal (~ 1 ms) and spatial resolution (< 1 cm), it is not suitable for BCI because of its noise sensitivity and weight [8]. Based on the hemodynamics, functional magnetic resonance imaging (fMRI) provides an excellent spatial resolution (3–6 mm), but its temporal resolution is poor (1–3 s). Nevertheless, due to its very high cost, motion sensitivity, and, being bulky, it is also not suitable for BCI [9–11]. To cope with the aforementioned limitations and requirements, it is a high demand for a new modality. fNIR is such a neuroimaging modality discovered in 1977 by Jöbsis [12]. The researchers in [13–15] reported that near-infrared (NIR) range enables real-time non-invasive detection of hemoglobin oxygenation using fNIR. The fNIR modality provides a very good spatial resolution (~ 1–1.5 cm), moderate temporal resolution (up to 100 Hz), portability to use, cost-effectiveness, the high value of the signal to noise ratio (SNR), less motion artifact compared to fMRI, MEG, EEG, and PET [9]. Furthermore, fNIR is not physically confining the patient as fMRI and it allows movement during imaging. Recent works of literature [16, 17] demonstrated that the results of fNIR are comparable to fMRI and reliable for cortical activations measurement. Since fNIR provides finer spatial resolution and EEG provides finer temporal resolution, the combined information of both fNIR and EEG is getting much attention in the recent researches [18–23] on neuroimaging and BCI.
Millions of people in the world are suffering from different kinds of disabilities [24], whereas their brain works partially or fully. In this situation, a finer BCI system is a hope to provide them easier life by operating different devices through brain command. There are various proposals for BCI using single modality either EEG or fNIR. One of the main limitations of the single modality based BCI is that it gives lower accuracy (less than 40% for fNIR [25, 26] and less than 70% for EEG [27–31]) for multiple motor imagery tasks’ classifications. Among the works described [27–31], the research work proposed in [31] claimed to achieve the highest classification accuracy for up to 8-class problem which is around 57% in average, although the proposed method applied a number of composite methods for feature extraction. Such complex algorithms are required for the feature extraction of the EEG signals due to its poorer spatial resolution. Both the temporal and spatial resolutions should be satisfactory to achieve higher classification accuracy for the BCI implementation.
Therefore, to implement suitable BCI, multimodal neuroimaging methods are proposed. Some recent research works [18, 19, 23] on the classification of imagery movement-related tasks have been proposed by combining fNIR and EEG signals for BCI implementation. It has been revealed in [18–23] that the classification efficiency of combining fNIR and EEG is better than that of the individual modality. These multimodal proposals used some shallow machine learning algorithms to classify the multiple class problems where manual feature extraction was deployed. As a result, the classification accuracies are still lower than the expectations. Current researches regarding multi-class motor events show two significant limitations:
Most of the existing BCI’s are designed based on single modality which limits classification accuracies for multiple classes due to spatiotemporal resolution.
No significant research work has been accomplished utilizing deep neural network on a combination of fNIR and EEG signals.
To overcome these challenges, the proposed work attempts to develop an effective BCI model in classifying the brain signals (fNIR and EEG) of the voluntary and imagery movements. For achieving the high classification accuracy, a convolutional neural network (CNN) has been used to construct the predictive model as a classifier. In this work, eight different movement-related stimuli (four voluntary and four imagery movements of hands and feet) have been considered. The multiple channel fNIR and EEG signals are used to prepare functional neuroimages to train and test the performance of the proposed BCI system. In addition, the proposed procedure is applied to prepare neuroimages from the individual modality (fNIR and EEG separately) to train and test the performance of the BCI system. The results reveal that the combined-modality approach of fNIR and EEG provides improved classification accuracy than the individual one. Besides, the combined fNIR and EEG signals are utilized for manual feature extraction and classification by support vector machine (SVM) and linear discriminant analysis (LDA) so that the performance difference between CNN and conventional classifiers i.e., SVM and LDA could be well judged.
The main contributions of this paper are as follows:
Combining the fNIR and EEG signal to produce CNN compatible functional neuroimages.
Implementation of bimodal BCI using fNIR and EEG signals for classification of voluntary and imagery movements utilizing the CNN.
Experimentation with multi-class brain signals using the implemented BCI.
The classification accuracy comparison between CNN, SVM, and LDA.
The remaining contents of the paper are organized as follows: The materials and the applied mathematical methodology are presented in “Materials and methods” section. Experimental results along with necessary discussions are given in “Results and discussion” section. Finally, the paper is concluded in “Conclusion” section.
Materials and methods
Data acquisition protocol
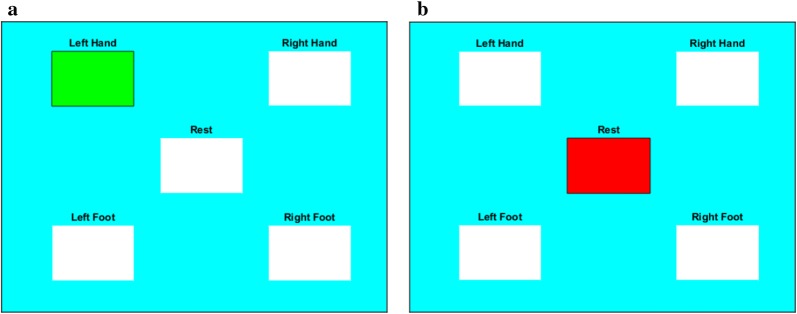
In this research eight different tasks (four voluntary and four imagery) were considered for neural stimulation. The participants were asked to perform movements by hands and feet by means of voluntary and imagery manners. The data acquisition protocol was checked and approved by the “Data Acquiring Ethics Evaluation Committee (DAEEC)” of Khulna University of Engineering & Technology (KUET). The subjects were verbally informed and practiced the protocol of the data acquisition before actual data acquisition. The subjects lifted their left hand, right hand, left foot, and right foot, sequentially. For proper neural stimulation, each task was performed for 10 s with 20 s resting period. Therefore, the scheduling of the proposed data acquisition protocol can be presented in Fig. 1. In one session, this unit protocol was performed four times by a participant. After every session, each participant took rest at least five minutes. Eventually, every participant performed 40 trials for each movement-related task. A graphical protocol aiding software designed by Matlab (given in Fig. 2) was used for this research work that instructed graphically to perform the tasks according to the schedule. The Matlab code of this software is freely available in [32]. In this program, there are five different tasks, those are movements of the hands, feet (left and right), and the rest. Eventually, eight different tasks have been considered for analysis: voluntary left hand (LH), right hand (RH), left foot (LF), right foot (RF) and imagery left hand (iLH), right hand (iRH), left foot (iLF), and right foot (iRF).
Fig. 1.
Time schedule of data acquisition protocol for each participant regarding both the voluntary and imagery movements. This is a unit task performing schedule that was repeated four times in each session to complete 40 individual trials of every task
Fig. 2.
Schematic illustration of MATLAB based protocol instruction aiding application for the experiment. Regarding the instruction of this application, the participant is asked to move the left hand (voluntary or imagery) by Fig. 3a and after that, Fig. 3b instructs to take rest
Data acquisition
Fifteen right-handed male subjects (age range = 22 to 26) participated in this bimodal (fNIR and EEG) data acquisition protocol. No participant had a history of the psychiatric, neurological, or visual disorder. In addition, no participant was reported to have any pain in their both hands and feet. The verbal consents of the participants were taken prior to the data acquisition as the rule of the university. All data acquisition procedures were completed in the Neuroimaging Laboratory of the Biomedical Engineering Department of KUET following the declaration of Helsinki [33].
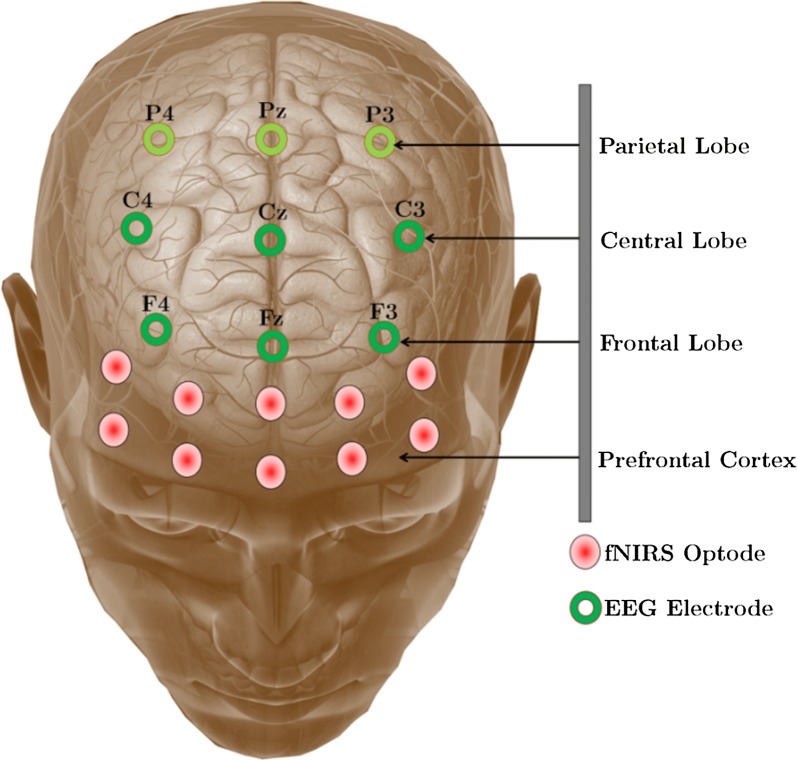
For this work, a 16 channel continuous-wave fNIR system (model: Biopac 1200 fNIR imager) and 9-channel EEG device (model: B-Alert X-100) were used. Utilizing both fNIR and EEG devices, the prefrontal, frontal, and central parts of the brain were covered. The hemodynamic signals from the prefrontal cortex were acquired by the fNIR device and the EEG signals of the frontal and central part of the brain were captured by the 9 channel EEG device. The optodes of fNIR devices and the electrode of the B-Alert system were placed at the positions indicated in Fig. 3. The Cognitive Optical Brain Imaging (COBI) studio and AcqKnowledge software were used to log the combined fNIR–EEG signal. Although there is a time gap between the starting of the EEG and fNIR signal acquisition software, it has been corrected by a reverse counting approach. The real-time data acquisition utilizing fNIR devices and B-Alert X-100 from the scalp of a participant is given in Fig. 4.
Fig. 3.
The combined fNIRS-EEG sensor positions on the scalp and prefrontal cortex. The data of parietal lobe are acquired through the main data acquisition period but excluded for proposed offline processing
Fig. 4.
Data acquisition of voluntary and imagery movements using fNIR and EEG modality
Preprocessing
Since the research work deals with two different types of signals, two different preprocessing were applied. The signal preprocessing methods regarding fNIR and EEG signals are separately presented as follows.
fNIR signal preprocessing
The following steps showing in Fig. 5 were used for the fNIR signal processing. The fNIR signals were smoothed by using the 3rd order Savitsky–Golay filter with 21 frame-size as recommended in [34]. Then the signals were divided according to the time schedule to separate each trial fNIR signal regarding applied stimuli. The baselines of all trials were corrected by subtracting baseline from the filtered signals. Baseline was calculated from the average of the first 3 s of the signals. This consideration [35, 36] ensures that the initial signal points regarding each trial remain at zero or close to zero levels.
Fig. 5.
Preprocessing steps of the fNIR signals
EEG signal preprocessing
In this preprocessing, the EEG signals are filtered in several steps because EEG signals are too much noise sensitive and complex in nature. Different types of noises are incorporated in EEG signals like power line noise, eye blink, electrooculogram (EOG), etc. The flow diagram of this preprocessing is presented in Fig. 6.
Fig. 6.
The steps applied in EEG signal preprocessing
All raw EEG signals are filtered by a 50 Hz notch filter to remove power line noise [37]. After that, a bandpass elliptical filter is used to separate the strong band power from 1 to 40 Hz. The elliptic filter provides sharp cut-off frequency and low filter order than the other IIR filters like Chebyshev, Butterworth, Bessel, etc. It is also known as Zolotarev or Cauer filters. This filter shows equi-ripple characteristics both in the pass-band and stop-band. Since the elliptic filter achieves the minimum order value for a given specification, it is considered as an optimal filter [38]. Eventually, it is slightly complex to design and it often needs several complex algorithms to implement. The response of an elliptical filter in the magnitude-square aspect in the frequency domain can be presented as [38],
| 1 |
Here, and are for the frequency and cut-off frequency, respectively. In addition, the passband ripples are presented by . Here, is the Nth order Jacobian elliptical function. Though the solution analysis of the relation (1) is difficult, however, the order calculation procedure is compact at all [39–41] and is given by,
| 2 |
In (2), and , where, is stopband frequency and is stopband attenuation. Besides, , which is an elliptical integral. A 5th order elliptical filter was used in this work to filter the EEG signals. In addition, the eye blink and EOG effects in the EEG signals were removed by the enhanced automatic wavelet independent component analysis (EAWICA) toolbox [42]. Finally, the EEG signals were separated according to the time schedule of the tasks.
Combining fNIR and EEG signal to produce neuroimages
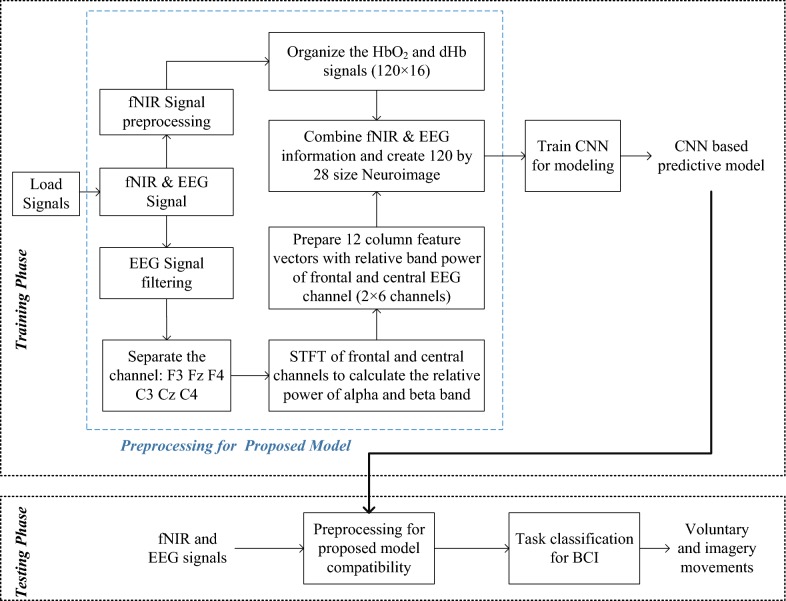
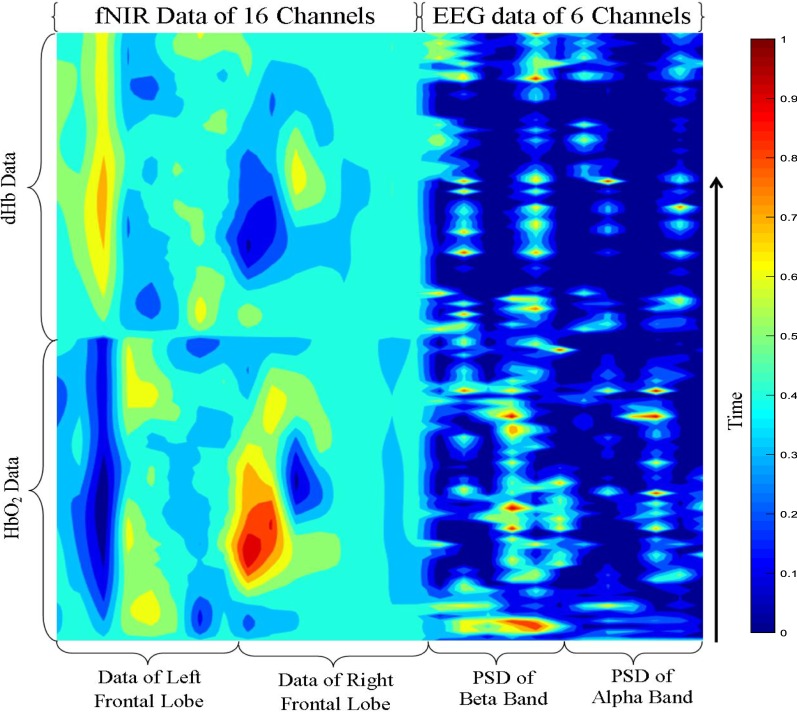
A two-dimensional data arrangement of the combined fNIR–EEG has been proposed in this work. Since the sampling rate of fNIR (2 Hz) and EEG (256 Hz) are not similar, the data of EEG signal has been transformed into the frequency domain to represent it into the similar sampling rate of the fNIR signal.
According to this proposal, the fNIR signal length is 30 s (10-s stimuli + 20-s activation). There are 16 channels (60 samples per channel) of both HbO2 and dHb data. The 16 channel data of HbO2 and dHb are arranged as the procedure shown in Fig. 7.
Fig. 7.

Combining the fNIR and EEG data to prepare the spatiotemporal neuroimages for classification by CNN
Since neural activities of imagery and voluntary movements are connected with the frontal and central parts of the brain, only frontal three channels, and central three channels were taken for further processing. The most dominant features of imagery and voluntary movements are included in the alpha, beta, and total band power of the EEG signal [15, 30]). As a result, the relative PSD of the alpha and beta band from the six channels (F3, Fz, F4, C3, Cz, and C4) were extracted considering a window of time period 1 s with 50% overlapping. We know that for a discrete-time signal, x(n) the PSD can be equated as [43],
| 3 |
In (3), represents the autocorrelation of a periodic signal. But for an Ergodic process, we can write,
| 4 |
where ‘’ denotes convolution of two signals [43, 44]. Window-based PSD calculation is very important for an EEG signal. In this case, the Welch method is the most renowned method. Suppose, the successive sequences are offset by D points, where each sequence is L points long, then the ith sequence is,
| 5 |
Thus L–D points are overlapped. If entire U data points are covered by K sequences then,
| 6 |
According to the conditions (7), the PSD calculation method was given in [45].
| 7 |
If any band relates to specific neural activities, its relative power also increases with respect to its resting condition. Therefore, relative power plays important roles in finding the specific electrical activities from the EEG signal. In this work, total power is calculated from 1 to 40 Hz by the previously explained Welch method. Eventually, the relative power of a band is the ratio of the power of the band P and total power, Ptotal that can be presented as, [43, 46],
| 8 |
Here, P indicates the power, RP represents the relative power, and f1 and f2 are the low- and high-frequency of the specific band, respectively. Furthermore, before applying the combined fNIR–EEG data to CNN the features of HbO2, dHb, alpha PSD, and beta PSD are normalized separately using the following equation:
| 9 |
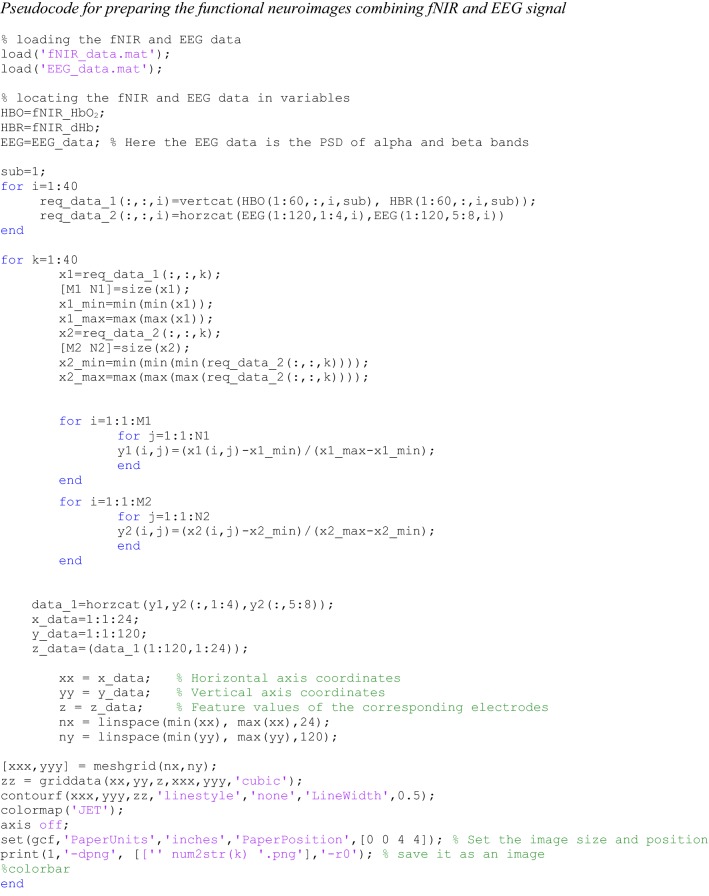
Here, are the feature values that are rescaled between the range 0 and 1. The maximum and minimum feature values are presented as and , respectively. Finally, we get a data matrix of size 120 × 28. The arrangement of fNIR and EEG data are given in Fig. 7. The data set for every task was used to prepare functional neuroimage. A demo Matlab code is given in the appendix to demonstrate the procedure of making the functional neuroimages from the numerical data of fNIR and EEG.
CNN-based modeling
CNN shows nice performance in signal and image classifications. To improve accuracy further, deep CNNs (where the number of convolutional layers ≥ 3) are often used [47]. In this work, a deep CNN is used to construct a predictive model for classifying voluntary and imagery movements. In CNN, each neuron receives some inputs and performs a dot product. CNN represents a specialization of the conventional neural networks where the individual neurons create a mathematical estimation of the biological visual receptive field [48]. The basic structure of a CNN consists of a number of layers: convolutional layer, batch normalization layer, rectified linear unit (ReLU activation layer), max pooling layer, etc. An inception block extracts the feature maps from the input images, which are concatenated and passed on to a global average pooling layer. Eventually, there is a two-unit dense layer with a softmax activation layer, which gives the categorical probability. To prevent the overfitting problem, the weights of the dense layers are L2 regularized.
The architecture of our applied CNN model is summarized in Table 1. The CNN model includes three convolutional, two max pooling, three batch normalization, and four/six/eight fully connected layers. There are four, six, and eight fully connected layers for 4-, 6-, and 8-class problems, respectively. As explained earlier, the input image size is 384 × 384 × 3, which indicates 384 × 384 image size with three color components. The filter kernel was used as 8 × 8, 4 × 4, and 4 × 4 for the 1st, 2nd, and 3rd convolutional layers, respectively. We have used stride [1 1] for the convolutional layers and [2 2] for max pooling layers. The convolution layers and its kernel and filter numbers of this proposed CNN model are given in Fig. 8 along with the feature maps for the 4-class problem of a typical subject.
Table 1.
The architecture of the proposed CNN
| Type | Description |
|---|---|
| Image input layer | 384 × 384 × 3 |
| Convolution layer 1 | Filter size = [8, 8]; number of channels = 3; number of filters = 9; padding size = [3, 4, 3, 4]; stride = [1, 1] |
| Batch normalization layer | |
| ReLU layer | |
| Maxpooling layer | Pool size = [2, 2]; stride = [2, 2] |
| Convolution layer 2 | Filter size = [4, 4]; number of channels = 9; number of filters = 16; padding size = [1, 2, 1, 2]; stride = [1, 1] |
| Batch normalization layer | |
| ReLU layer | |
| Maxpooling layer | Pool size = [2, 2]; stride = [2, 2] |
| Convolution layer 3 | Filter size = [4, 4]; number of channels = 16; number of filters = 36; padding size = [1, 2, 1, 2]; stride = [1, 1] |
| Batch normalization layer | |
| ReLU layer | |
| Fully connected layer | Output size = 4/6/8 |
| Softmax layer | |
| Classification output layer | Output size = 4/6/8; loss function = crossentropy |
Fig. 8.
The features of the input images with the changes of layers of the CNN based classifiers
Training and testing the model
The proposed CNN model was trained based on some initial considerations about different parameters, which are defined in Table 2. The loss function was calculated from the cross-entropy in the softmax layer. On the other hand, the training and testing data ratio is considered 4:1. The classification accuracy, we used fivefold cross-validation technique. Here, 25% of the training data was used for validation. The training and testing of the proposed model were conducted at the subject-dependent approach. Eventually, the data of 15 participants were separately used for training and testing. The classification accuracy was conducted for 4-, 6-, and 8-class problems, where the class level was set as 4-class: [LH, RH, iLH, and iRH], 6-class: [LH, RH, iLH, iRH, iLF, and iRF], and 8-class [LH, RH, LF, RF, iLH, iRH, iLF, and iRF]. Furthermore, the training process was conducted by two types of data set: (i) only fNIR data and (ii) combined fNIR and EEG data. The methodology of the proposed work including preprocessing, image construction by combined fNIR and EEG along with CNN based model is presented in Fig. 9.
Table 2.
Parameters considerations in the proposed CNN based model training
| Parameter Name | Consideration | Parameter Name | Consideration |
|---|---|---|---|
| Activation function | Sigmoid | Maximum epoch | 20 |
| Momentum | 0.90 | Mini batch size | 128 |
| Initial learning rate | 0.01 | Verbose frequency | 50 |
| L2 regularization | 1.00 × 10⁻⁴ | Validation frequency | 4 |
| Gradient threshold method | L2 norm | Validation patience | 5 |
Fig. 9.
The main steps of the proposed method of processing of the EEG and fNIR signal, image formation, and classification
Manual feature extraction and classification by SVM and LDA
Unlike CNN, for the classification of the multiple class signals their manual feature extraction is necessary. An excellent review work has been done in [5] where the signal’s feature extraction procedure of the combined fNIR and EEG system is recommended. According to the recommendations of the work [5], the signal dimensions of both fNIR and EEG signals were reduced in this work. In the case of the fNIR signal, common averaging filtering (CAF) was used to reduce the dimension of the signal from 16 to 4 as recommended in [44]. In the case of the EEG signals, the required six channels (F3, F4, Fz, C3, C4, and Cz) were reduced to 4 signals by excluding the Fz and Cz. Therefore, for manual feature extraction in case of both fNIR and EEG signals, four channels were considered.
From fNIR signals, two significant features were extracted those are signal mean and slope. The calculation procedures of the signal mean and slope are given in [5, 49]. On the other hand, the following features were extracted from the EEG signals: PSD [43], logarithmic power [5], L2 norm [50], and spectral entropy [51]. As a result, each fNIR signal depicts 4 × 2 = 8 (signal dimension × number of features) features and each EEG signal depicts 4 × 4 = 16 features. Therefore, the dimensions of the features of the combined fNIR and EEG signals would be (16 + 8) × 4 = 96 × 1, (16 + 8) × 6 = 144 × 1, and (16 + 8) × 8 = 192 × 1 for 4-, 6-, and 8- class, respectively.
According to the recommendations of the review work [5], SVM and LDA were chosen for modeling and classification. Since the operating mechanism of the SVM and LDA classifier is well known, the detail explanation is unnecessary (worth reading [52]). In case of modeling by the SVM structure, polynomial kernel function was used considering order value 3 and performances were measured utilizing fivefold cross-validation. The cost function was considered as 75%. Furthermore, the classification performances of the LDA model was also measured utilizing fivefold cross-validation. The predictive model preparation using SVM and LDA by the features extraction and their classification accuracy calculating steps are shortly presented by the flow diagram given in Fig. 10.
Fig. 10.
Steps regarding the manual feature extraction and classification of the combined fNIR and EEG signals by the conventional classifiers
Results and discussion
For raw data logging of EEG and fNIR, Acqknowledge 4.0 and COBI studio were used, respectively. The analytical outcomes regarding this research work are solely accomplished by Matlab 2018a programming software in a computer having a Core-i7 processor with 8 GB RAM.
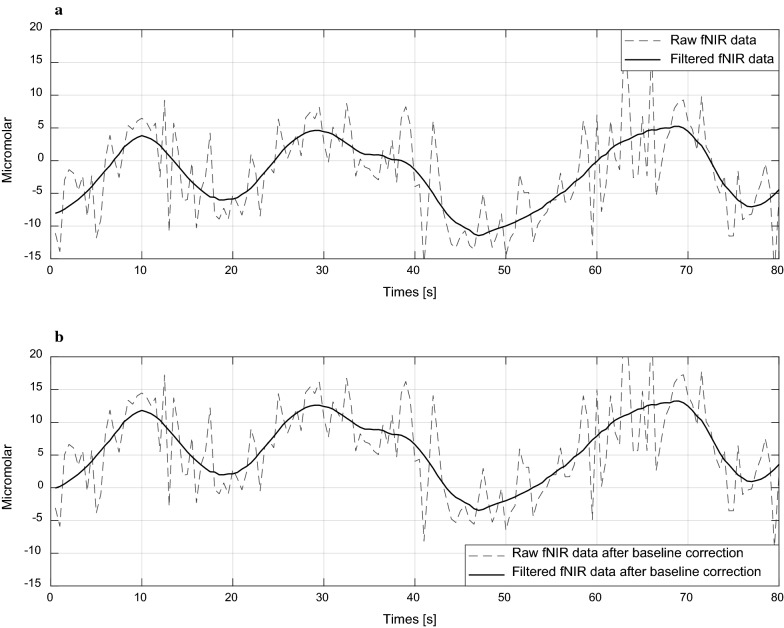
In the processing steps, we first executed the data filtering part. The filtering effect on the raw fNIR signal has been shown in Fig. 11 and that of the EEG signal has been given in Fig. 12. Here we considered the central and frontal EEG channels. This is because the functional changes occur in the central lobe mostly, but the frontal lobes become also activated due to voluntary and imagery movement-related tasks. For the justification, we have added the activation level of different positions of the brain concerning frontal, central, and parietal lobe of the brain as topoplot. The topoplots are presented in Table 3. The totoplots are prepared from the average activations of five randomly chosen subjects. A Matlab based free toolbox [53] has been utilized to prepare the graphical topoplots, which is solely designed for the 9-channel EEG data of B-Alert wireless devices. From the topoplots, we get that the voluntary movements of hands and feet create significant activations in the central lobe. On the other hand, due to imagery movements, both the frontal and central lobes become activated. One thing is noticeable for the imagery feet movements that the impact of the activation is slightly lower than that of the imagery hand movements. In addition, the patterns are also irregular compared to the movements of the voluntary feet movements. In most of the cases, the parietal lobe was inactive and that is why the information of the parietal lobe is excluded in the functional neuroimage construction. For the same reason, during the manual feature extraction from the EEG signal, the three channels of parietal lobe were excluded. Since there is a tradeoff relation between the feature dimension and the classification accuracy, this excluding process helps to reduce the feature dimension and indirectly helps to increase the possibility of higher classification accuracy.
Fig. 11.
a Raw and filtered fNIR signal without baseline correction and b filtered fNIR signal after baseline correction that starts from the baseline or zero levels
Fig. 12.
Step by step EEG signal pre-processing: a raw EEG signal of a single channel, b EEG signal after removing 50 Hz power line noise, c filtered EEG signal up to 45 Hz by third-order elliptical filter, and d eye-blink and EOG artifact-free EEG signal which is filtered by the EAWICA toolbox
Table 3.
The average neural activation regarding different stimuli
The activation was calculated based on the relative power spectral density of the channels
According to our proposal of the fNIR–EEG combined spatiotemporal data, a typical fNIR and EEG data of a particular stimulus has been considered to make the functional neuroimage and the resulting image is given in Fig. 13. The color bar is given on the right side of the figure. Therefore, using the proposed method the combined fNIR–EEG data can be transformed into images that can be applied to the input of the CNN. The Matlab code of the image generation has been given in the “Appendix”. This is our original approach of presenting the combined fNIR–EEG time series data because, so far our knowledge, no research work has not proposed in such a form of fNIR and EEG data combination process.
Fig. 13.
Combining the fNIR and EEG data to prepare the spatiotemporal neuroimages for classification by CNN
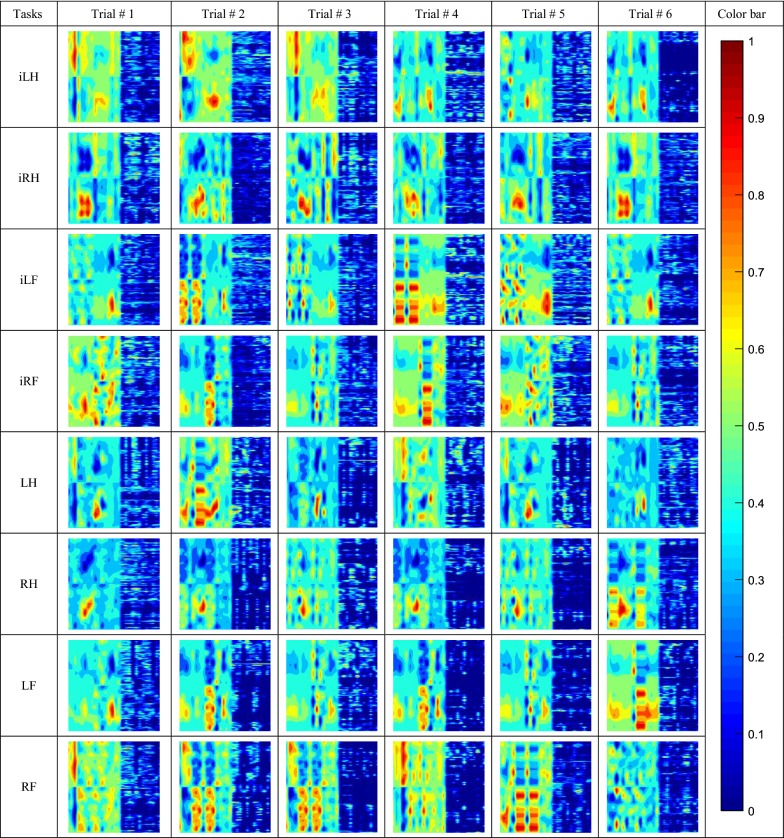
It should be mentioned that along with the combined fNIR–EEG based image, we also used only the fNIR data (HbO2 and dHb) to produce the neuroimages for the training of the CNN. It was performed to show the difference in the classification accuracy between the single fNIR modality and the combined modality approach. The neuroimages regarding the single and bimodal data of eight different class stimuli have been presented by Tables 4 and 5, respectively. The images are prepared on the basis of their normalized value. Furthermore, these images are RGB color image those are prepared to feed to the CNN.
Table 4.
Neuroimages from the temporal HbO2 and dHb fNIR data of 10-s task plus 20-s activation
Here, there are images of eight types of tasks with 6 trials of each task
Table 5.
Neuroimages from the combined fNIR and EEG data of 10-s task plus 20-s activation
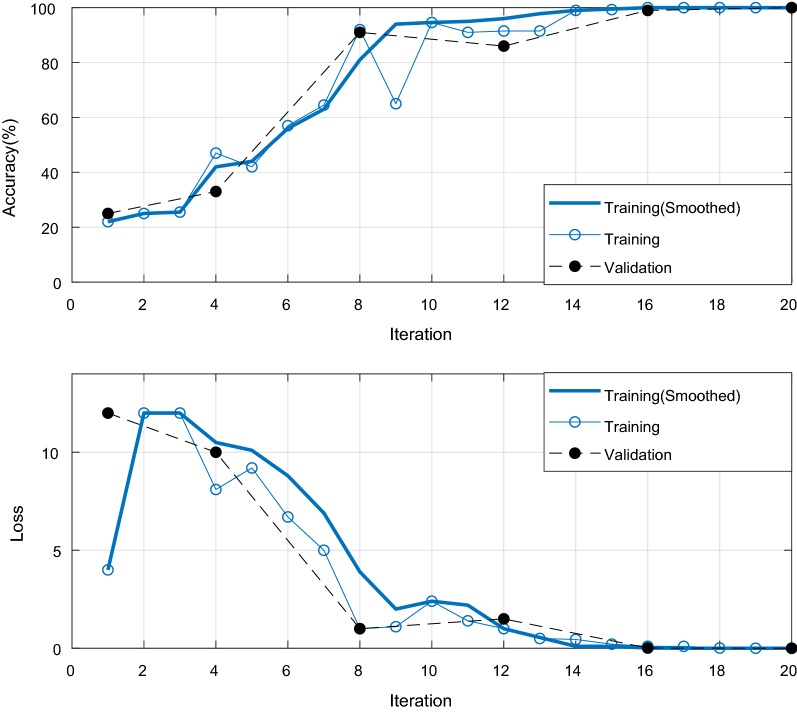
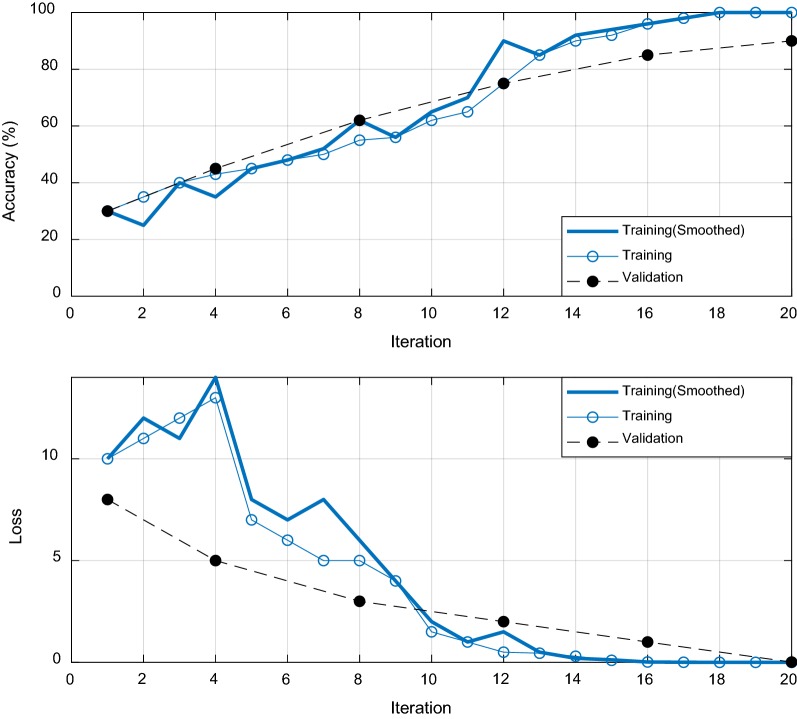
These images are sequentially fed to the CNN for automatic feature extraction and to train the predictive model for further classification. The trained model was constructed for 4-, 6-, and 8-classes. The training and validation accuracy with respect to the iteration of 4-, 6-, and 8-class problems are given in Figs. 14, 15, and 16, respectively. The loss reduction during training and validation of the proposed CNN models is also given in the figures. The training and validation accuracy of the proposed CNN model are found best in case of a 4-class problem. On the other hand, the validation accuracy was slightly inferior in the case of 6- and 8-classes.
Fig. 14.
The training and validation accuracy with loss performances with respect to the epoch iterations for 4-class problem
Fig. 15.
The training and validation accuracy with loss performances with respect to the epoch iterations for 6-class problem
Fig. 16.
The training and validation accuracy with loss performances with respect to the epoch iterations for 8-class problem
These results are found for subject 1 while the models were trained by combined fNIR and EEG data. We have applied two different approaches to find the classification accuracy: one is based on fNIR data only and the other is based on the combined information of fNIR and EEG data. The results of 15 participants are given in Tables 6 and 7, respectively. In addition, according to the proposition and scope of this work, the conventional classification methods such as LDA and SVM were also applied to check their performances. The extracted features of the fNIR data and the combined fNIR and EEG data were classified utilizing the SVM and LDA method and the regarding results are also given in Tables 6 and 7, respectively.
Table 6.
The classification accuracy of the SVM, LDA, and the proposed model with the fNIR data only
| Participant # | 4-class | 6-class | 8-class | ||||||
|---|---|---|---|---|---|---|---|---|---|
| SVM | LDA | Proposed CNN | SVM | LDA | Proposed CNN | SVM | LDA | Proposed CNN | |
| 1 | 60% | 76% | 82% | 52% | 61% | 74% | 48% | 45% | 55% |
| 2 | 63% | 66% | 78% | 53% | 59% | 71% | 45% | 48% | 50% |
| 3 | 68% | 66% | 80% | 57% | 53% | 77% | 52% | 43% | 50% |
| 4 | 70% | 74% | 84% | 60% | 63% | 77% | 58% | 54% | 55% |
| 5 | 65% | 70% | 85% | 53% | 54% | 67% | 37% | 39% | 65% |
| 6 | 68% | 69% | 76% | 61% | 58% | 71% | 54% | 47% | 60% |
| 7 | 64% | 72% | 81% | 56% | 67% | 75% | 41% | 50% | 60% |
| 8 | 69% | 67% | 78% | 64% | 58% | 61% | 52% | 56% | 55% |
| 9 | 66% | 70% | 89% | 54% | 53% | 78% | 43% | 35% | 50% |
| 10 | 65% | 68% | 78% | 59% | 62% | 65% | 48% | 48% | 55% |
| 11 | 72% | 66% | 78% | 59% | 60% | 62% | 48% | 58% | 45% |
| 12 | 68% | 64% | 82% | 56% | 59% | 71% | 37% | 48% | 50% |
| 13 | 73% | 75% | 84% | 65% | 66% | 71% | 56% | 52% | 60% |
| 14 | 70% | 74% | 90% | 62% | 62% | 74% | 58% | 51% | 65% |
| 15 | 74% | 72% | 75% | 65% | 64% | 64% | 43% | 50% | 50% |
| Average ± (SD) | 68% ± (3.88) | 70% ± (3.76) | 81% ± (4.45) | 58% ± (4.42) | 60% ± (4.33) | 71% ± (5.56) | 48% ± (6.98) | 48% ± (6.07) | 55% ± (5.97) |
Table 7.
The classification accuracy of the SVM, LDA, and the proposed model with the combined fNIR and EEG data
| Participant # | 4-class | 6-class | 8-class | ||||||
|---|---|---|---|---|---|---|---|---|---|
| SVM | LDA | Proposed CNN | SVM | LDA | Proposed CNN | SVM | LDA | Proposed CNN | |
| 1 | 77% | 80% | 92% | 70% | 65% | 90% | 54% | 50% | 74% |
| 2 | 82% | 76% | 88% | 61% | 68% | 82% | 52% | 58% | 72% |
| 3 | 81% | 80% | 88% | 69% | 57% | 84% | 58% | 60% | 75% |
| 4 | 86% | 82% | 90% | 65% | 64% | 90% | 61% | 52% | 76% |
| 5 | 77% | 78% | 94% | 73% | 70% | 88% | 48% | 54% | 70% |
| 6 | 75% | 80% | 92% | 58% | 57% | 86% | 60% | 50% | 80% |
| 7 | 80% | 77% | 94% | 62% | 69% | 82% | 55% | 48% | 78% |
| 8 | 72% | 66% | 86% | 70% | 61% | 75% | 61% | 56% | 69% |
| 9 | 78% | 74% | 98% | 65% | 65% | 85% | 58% | 55% | 71% |
| 10 | 71% | 76% | 84% | 65% | 53% | 75% | 55% | 50% | 70% |
| 11 | 81% | 79% | 83% | 66% | 69% | 78% | 58% | 58% | 68% |
| 12 | 77% | 68% | 91% | 71% | 68% | 82% | 48% | 52% | 65% |
| 13 | 78% | 80% | 90% | 65% | 68% | 80% | 60% | 54% | 65% |
| 14 | 76% | 82% | 96% | 61% | 58% | 78% | 62% | 55% | 72% |
| 15 | 84% | 78% | 87% | 64% | 70% | 75% | 54% | 50% | 70% |
| Average ± (SD) | 78% ± (4.11) | 77% ± (4.66) | 90% ± (4.54) | 66% ± (4.23) | 64% ± (5.57) | 82% ± (5.12) | 56% ± (4.49) | 53% ± (3.56) | 72% ± (4.34) |
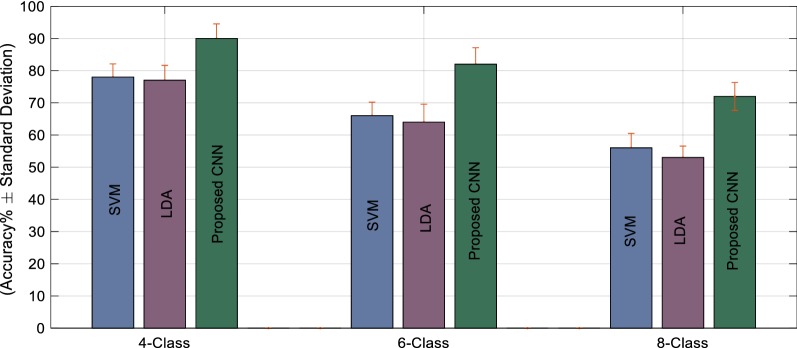
From the result, we get that the combined information provides us greater classification accuracy. For 4-, 6-, and 8-class problems, the classification accuracies are significantly improved by 9%, 11%, and 17% on average by the combined fNIR–EEG information in case of the CNN. On the other hand, the improvement in the classification accuracy occurred 10%, 8%, and 8% for SVM and 7%, 4%, and 5% for LDA. In the case of the conventional classifiers, the performances for the 6- and 8-class are not convincing at all and that is why the choice of CNN is inevitable. The average classification performances of SVM, LDA, and the proposed CNN model for single and bimodal data are presented in Figs. 17 and 18, respectively to reflect the importance of utilizing the combined information of fNIR and EEG signal as well as choosing CNN as a classifier. The results claim that for 8-class problem classification, CNN exceptionally plays a significant role to achieve the expected BCI goal. In addition, the combination of the EEG information with the fNIR signal provides an excellent increment in the classification performances. The result proves that combined information of fNIR and EEG outperforms the information regarding the fNIR signal alone. In addition, the classification accuracy has been achieved 90 ± 4.54%, 82 ± 5.12%, and 72 ± 4.34% for 4-, 6-, and 8-class problems, respectively, which is too convincing for the BCI implementation.
Fig. 17.
Overall performances (mean ± SD) of the classification accuracy through SVM, LDA, and the proposed CNN method while only the fNIR data were considered
Fig. 18.
Overall performances (mean ± SD) of the classification accuracy through SVM, LDA, and the proposed CNN method while combined fNIR and EEG data were considered
Although there is numerous research work on motor imagery signal classification, their data acquisition protocols, devices, participants, and modalities are different from each other. Therefore, to compare them directly are difficult in the scientific aspect. Although some research works have existed that deploys 4-class motor imagery EEG or fNIR signal classification, there is only one work [31] that presents both 4-class and 8-class BCI for robot hand control. Since the main objective of all these research works is to implement BCI, a general comparison regarding their protocols, methods, and performances could be a nice presentation to observe the overall concept about the trends of the multiple-class BCI implementation through fNIR, EEG or combined fNIR and EEG. Such a comparison of 4-class and 8-class BCI of the proposed method with the others has been presented in Table 8. From the performance of the proposed method, it is clear that in the process of improvement trending in the research of BCI, our proposed bimodal approach outperforms the existing previous works.
Table 8.
Comparison of the proposals of the multiple class BCI system
| Research work | Work objectives | Methodology | Modality | Resulting accuracy (%) |
|---|---|---|---|---|
| 4-class database classification | ||||
| Leon et al. [31] | Combined motor imagery classification | Feature extraction: modified CSP classifier: multistep SVM | EEG | 71.67 |
| Rahman et al. [54] | Moto imagery classification | Feature extraction: PCA and wavelet classifier: two-step ANN | EEG | 74.60 |
| Ge et al. [30] | Moto imagery classification | Feature extraction: STFT and CSP classifier: SVM | EEG | 88.1 |
| Batula et al. [26] | Moto imagery classification |
Feature extraction: mean value Classifier: SVM |
fNIR | 54 |
| Shin et al. [55] | Moto imagery classification |
Feature extraction: statistical features Classifier: Naive Bayes classifier |
fNIR | 83.15 |
| Proposed method | Moto imagery classification | Feature extraction and classification by CNN | fNIR + EEG | 90 |
| 8-class database classification | ||||
| Leon et al. [31] | Combined motor imagery classification | Feature extraction: modified CSP classifier: multistep SVM | EEG | 51.67% |
| Proposed method | Voluntary and imagery motor movement classification | Feature extraction and classification by CNN | fNIR + EEG | 77% |
CSP common spatial pattern, PCA principal component analysis, STFT short time Fourier transform
Conclusion
This paper is the first research paper based on the combined fNIR and EEG signals that deals with up to 8-class problems classification by CNN—an artificial intelligence tool. Besides, this is the first proposal to decode voluntary and imagery movements combining prefrontal hemodynamic signals (fNIR) along with the frontal and central neuroelectric signal (EEG). This proposal on the bimodal approach for CNN-based BCI implementation found excellent results in classification accuracy of the voluntary and imagery movement-related tasks. It has been also shown that the classification accuracies are increased in the combined fNIR–EEG signal rather than the unimodal information (fNIR only). In addition, this proposal extends the pathway to implement up to 8-class problem utilizing fNIR and EEG data where most of the current literature discussed 2- or 4-class. The proposed method is robust, intelligent, and efficient for the movement classification problems, which makes hope in establishing an effective BCI for the motor impaired or paralyzed persons.
This work also added the performances of the conventional classification methods where the feature extraction was done manually. During feature extraction, recommendations of some scholarly article were obeyed although the performance of the conventional classifier solely depends on the discriminative features. Therefore, further improved feature extraction method could change the performances of the conventional methods, slightly, but not be able to exceed the proposed method.
Acknowledgements
This work was partially supported by the Higher Education Quality Enhancement Project (HEQEP), UGC, Bangladesh; under Subproject “Postgraduate Research in BME”, CP#3472, KUET, Bangladesh.
Appendix
Compliance with ethical standards
Conflict of interest
This research work has no conflict of interest to anyone.
Footnotes
Publisher's Note
Springer Nature remains neutral with regard to jurisdictional claims in published maps and institutional affiliations.
Contributor Information
Md. Asadur Rahman, Email: [email protected].
Mohammad Shorif Uddin, Email: [email protected].
Mohiuddin Ahmad, Email: [email protected].
References
- 1.Fantini S. Dynamic model for the tissue concentration and oxygen saturation of hemoglobin in relation to blood volume, flow velocity, and oxygen consumption: implications for functional neuroimaging and coherent hemodynamics spectroscopy (CHS) NeuroImage. 2014;85:202–221. doi: 10.1016/j.neuroimage.2013.03.065. [DOI] [PMC free article] [PubMed] [Google Scholar]
- 2.Baker JM, Bruno JL, Gundran A, Hadi Hosseini SM, Reiss AL. fNIRS measurement of cortical activation and functional connectivity during a visuospatial working memory task. PLoS ONE. 2018;13(8):1–22. doi: 10.1371/journal.pone.0201486. [DOI] [PMC free article] [PubMed] [Google Scholar]
- 3.Shin J, Lühmann AV, Kim DW, Mehnert J, Hwang HJ, Müller KR. Data descriptor: simultaneous acquisition of EEG and NIRS during cognitive tasks for an open access dataset. Sci Data. 2018;5(180003):1–16. doi: 10.1038/sdata.2018.3. [DOI] [PMC free article] [PubMed] [Google Scholar]
- 4.Aghajani H, Garbey M, Omurtag A. Measuring mental workload with EEG + fNIRS. Front Hum Neurosci. 2017;11(359):1–20. doi: 10.3389/fnhum.2017.00359. [DOI] [PMC free article] [PubMed] [Google Scholar]
- 5.Hong K, Khan MJ, Hong MJ. Feature extraction and classification methods for hybrid fNIRS-EEG brain-computer interfaces. Front Hum Neurosci. 2018;12:246. doi: 10.3389/fnhum.2018.00246. [DOI] [PMC free article] [PubMed] [Google Scholar]
- 6.Abdulkader SN, Atia A, Mostafa MSM. Brain computer interfacing: applications and challenges. Egypt Inform J. 2015;16:213–230. doi: 10.1016/j.eij.2015.06.002. [DOI] [Google Scholar]
- 7.Burle B, Spieser L, Roger C, Casini L, Hasbroucq T, Vidal F. Spatial and temporal resolutions of EEG: is it really black and white? A scalp current density view. Int J Psychophysiol. 2015;97(3):210–220. doi: 10.1016/j.ijpsycho.2015.05.004. [DOI] [PMC free article] [PubMed] [Google Scholar]
- 8.Basic principles of magnetoencephalography. MIT Class Notes. http://web.mit.edu/kitmitmeg/whatis.html. Accessed 24 Oct 2006.
- 9.Ariely D, Berns GS. Neuromarketing: the hope and hype of neuroimaging in business. Nat Rev Neurosci. 2010;11:284–292. doi: 10.1038/nrn2795. [DOI] [PMC free article] [PubMed] [Google Scholar]
- 10.Ayaz H, Onaral B, Izzetoglu K, Shewokis PA, McKendrick R, Parasuraman R. Continuous monitoring of brain dynamics with functional near infrared spectroscopy as a tool for neuro ergonomic research: empirical examples and a technological development. Front Hum Neurosci. 2013;7(871):1–13. doi: 10.3389/fnhum.2013.00871. [DOI] [PMC free article] [PubMed] [Google Scholar]
- 11.Ernst LH, Plichta MM, Lutz E, Zesewitz AK, Tupak SV, Dresler T, Ehlis AC, Fallgatter AJ. Prefrontal activation patterns of automatic and regulated approach avoidance reactions: a functional near-infrared spectroscopy (fNIRS) study. Cortex. 2013;49(1):131–142. doi: 10.1016/j.cortex.2011.09.013. [DOI] [PubMed] [Google Scholar]
- 12.Jöbsis FF. Noninvasive infrared monitoring of cerebral and myocardial oxygen sufficiency and circulatory parameters. Science. 1977;198(4323):1264–1267. doi: 10.1126/science.929199. [DOI] [PubMed] [Google Scholar]
- 13.Ferrari M, Quaresima V. A brief review on the history of human functional near-infrared spectroscopy (fNIRS) development and fields of application. NeuroImage. 2012;63(2):921–935. doi: 10.1016/j.neuroimage.2012.03.049. [DOI] [PubMed] [Google Scholar]
- 14.Ferrari M, Giannini I, Carpi A, Fasella P, Fieschi C, Zanette E. Non-invasive infrared monitoring of tissue oxygenation and circulatory parameters. In: XII world congress of angiology 1980, Athens, September 7–12.
- 15.Giannini I, Ferrari M, Carpi A, Fasella P. Rat brain monitoring by near-infrared spectroscopy: an assessment of possible clinical significance. Physiol Chem Phys. 1982;14(3):295–305. [PubMed] [Google Scholar]
- 16.Cui X, Bray S, Bryant DM, Glover GH, Reiss AL. A quantitative comparison of NIRS and fMRI across multiple cognitive tasks. NeuroImage. 2011;54(4):2808–2821. doi: 10.1016/j.neuroimage.2010.10.069. [DOI] [PMC free article] [PubMed] [Google Scholar]
- 17.Noah JA, Ono Y, Nomot Y, Shimada S, Tachibana A, Zhang X, Bronner S, Hirsch J. fMRI validation of fNIRS measurements during a naturalistic task. J Vis Exp. 2015 doi: 10.3791/52116. [DOI] [PMC free article] [PubMed] [Google Scholar]
- 18.Allison BZ, Brunner C, Kaiser V, Muller-Putz GR, Neuper C, Pfurtscheller G. Toward a hybrid brain-computer interface based on imagined movement and visual attention. J Neural Eng. 2010 doi: 10.1088/1741-2560/7/2/026007. [DOI] [PubMed] [Google Scholar]
- 19.Pfurtscheller G, Allison BZ, Brunner C, Bauernfeind G, Solis-Escalante T, Scherer R, Zander TO, Mueller-Putz G, Neuper C, Birbaumer N. The hybrid BCI. Front Neurosci. 2010 doi: 10.3389/fnpro.2010.00003. [DOI] [PMC free article] [PubMed] [Google Scholar]
- 20.Fazli S, Mehnert J, Steinbrink J, Curio G, Villringer A, Müller KR, Blankertz B. Enhanced performance by a hybrid NIRS–EEG brain-computer interface. NeuroImage. 2012;59(1):519–529. doi: 10.1016/j.neuroimage.2011.07.084. [DOI] [PubMed] [Google Scholar]
- 21.Lee MH, Fazli S, Mehnert J, Lee SW. Improving the performance of brain-computer interface using multi-modal neuroimaging. In: 2nd IAPR Asian conference on pattern recognition, Naha, 2013, pp. 511–15. 10.1109/acpr.2013.132.
- 22.Lee MH, Fazli S, Mehnert J, Lee SW. Subject-dependent classification for robust idle state detection using multi-modal neuroimaging and data-fusion techniques in BCI. Pattern Recognit. 2015;48(8):2725–2737. doi: 10.1016/j.patcog.2015.03.010. [DOI] [Google Scholar]
- 23.Buccino P, Keles HO, Omurtag A. Hybrid EEG-fNIRS asynchronous brain-computer interface for multiple motor tasks. PLoS ONE. 2016 doi: 10.1371/journal.pone.0146610. [DOI] [PMC free article] [PubMed] [Google Scholar]
- 24.World Bank and WHO. World report on disability. World Bank and WHO; 2015. http://www.who.int/disabilities/world_report/2011/report.pdf.
- 25.Batula M, Kim YE, Ayaz H. Virtual and actual humanoid robot control with four-class motor-imagery-based optical brain-computer interface. Comput Intell Neurosci. 2017;2017(1463512):1–13. doi: 10.1155/2017/1463512. [DOI] [PMC free article] [PubMed] [Google Scholar]
- 26.Batula AM, Ayaz H, Kim YE. Evaluating a four-class motor-imagery-based optical brain-computer interface. In: 36th annual international conference of the IEEE engineering in medicine and biology society, Chicago, IL, 2014, pp. 2000–03. 10.1109/embc.2014.6944007. [DOI] [PubMed]
- 27.Abbas W, Khan NA. FBCSP-based multi-class motor imagery classification using BP and TDP features. In: 2018 40th annual international conference of the IEEE engineering in medicine and biology society (EMBC), Honolulu, HI, 2018, pp. 215–18. [DOI] [PubMed]
- 28.Mahmood A, Zainab R, Ahmad RB, Saeed M, Kamboh AM. Classification of multi-class motor imagery EEG using four band common spatial pattern. In: Annual international conference of the IEEE engineering in medicine and biology society (EMBC), Seogwipo, 2017, pp. 1034–37. 10.1109/embc.2017.8037003. [DOI] [PubMed]
- 29.Mishra PK, Jagadish B, Kiran MPRS, Rajalakshmi P, Reddy DS. A novel classification for EEG based four class motor imagery using kullback-leibler regularized Riemannian manifold. In: 2018 IEEE 20th international conference on e-Health networking, applications and services (Healthcom), Ostrava, 2018, pp. 1–5. 10.1109/healthcom.2018.8531086.
- 30.Ge S, Wang R, Yu D. Classification of four-class motor imagery employing single-channel electroencephalography. PLoS ONE. 2014;9(6):1–7. doi: 10.1371/journal.pone.0098019. [DOI] [PMC free article] [PubMed] [Google Scholar]
- 31.León CL. Multilabel classification of EEG-based combined motor imageries implemented for the 3D control of a robotic arm. PhD thesis, Université de Lorraine, 2017.
- 32.Rahman MA. Matlab based graphical protocol. MATLAB Central File Exchange. https://www.mathworks.com/matlabcentral/fileexchange/69162-matlab-based-graphical-protocol. Accessed 20 Oct 2018.
- 33.World medical association declaration of Helsinki-ethical principles for medical research involving human subjects. Adopted by 64th WMA General Assembly, Fortaleza, Brazil, Special Communication: Clinical Review & Education, 2013.
- 34.Rahman MA, Rashid MA, Ahmad M. Selecting the optimal conditions of Savitzky-Golay filter for fNIRS signal. Biocybern Biomed Eng. 2019;39(3):624–637. doi: 10.1016/j.bbe.2019.06.004. [DOI] [Google Scholar]
- 35.Wiriessnegger SC, Kurzmann J, Neuper C. Spatio-temporal differences in brain oxygenation between movement execution and imagery: a multichannel near-infrared spectroscopy study. Int J Psychophysiol. 2008;67(1):54–63. doi: 10.1016/j.ijpsycho.2007.10.004. [DOI] [PubMed] [Google Scholar]
- 36.Batula AM, Mark JA, Kim YE, Ayaz H. Comparison of brain activation during motor imagery and motor movement using fNIRS. Comput Intell Neurosci. 2017 doi: 10.1155/2017/5491296. [DOI] [PMC free article] [PubMed] [Google Scholar]
- 37.Nyhof L. Biomedical signal filtering for noisy environments. PhD thesis, Deakin University, Australia, 2014. http://hdl.handle.net/10536/DRO/DU:30079016.
- 38.Chavan MS, Agarwala R, Uplane MD. Digital elliptic filter application for noise reduction in ECG signal. WSEAS Trans Electron. 2006;3(1):210–216. [Google Scholar]
- 39.Lutovac MD, Tosic DV, Evans BL. Filter design for signal processing. Upper Saddle River: Prentice Hall; 2001. [Google Scholar]
- 40.Vlcek M, Unbehauen R. Degree, ripple, and transition width of elliptic filters. IEEE Trans Circ Syst. 1989;36(3):469–472. doi: 10.1109/31.17602. [DOI] [Google Scholar]
- 41.Orfanidis SJ. Introduction to signal processing. Upper Saddle River: Prentice Hall; 1996. [Google Scholar]
- 42.Mammone N, Morabito FC. Enhanced automatic wavelet independent component analysis for electroencephalographic artifact removal. Entropy. 2014;16(12):6553–6572. doi: 10.3390/e16126553. [DOI] [Google Scholar]
- 43.Khanam F, Rahman MA, Ahmad M. Evaluating alpha relative power of EEG signal during psychophysiological activities in Salat. In: International conference on innovations in science, engineering and technology (ICISET), 2018, Bangladesh, pp. 1–6. 10.1109/iciset.2018.8745614.
- 44.Ifeachor EC, Jervis BW. Digital signal processing: a practical approach. Boston: Addison Wesley; 1993. [Google Scholar]
- 45.Rahman MA, Haque MM, Anjum A, Mollah MN, Ahmad M. Classification of motor imagery events from prefrontal hemodynamics for BCI application. Algorithms for intelligent system. Singapore: Springer; 2018. [Google Scholar]
- 46.Zhijie B, Qiuli L, Lei W, Chengbiao L, Shimin Y, Xiaoli L. Relative power and coherence of EEG series are related to amnestic mild cognitive impairment in diabetes. Front Aging Neurosci. 2014 doi: 10.3389/fnagi.2014.00011. [DOI] [PMC free article] [PubMed] [Google Scholar]
- 47.Krizhevsky A, Sutskever I, Hinton GE. Imagenet classification with deep convolutional neural networks. Adv Neural Inf Process Syst. 2012 doi: 10.1145/3065386. [DOI] [Google Scholar]
- 48.Matsugu M, Mori K, Mitari Y, Kaneda Y. Subject independent facial expression recognition with robust face detection using a convolutional neural network. Neural Netw. 2003 doi: 10.1016/S0893-6080(03)00115-1. [DOI] [PubMed] [Google Scholar]
- 49.Rahman MA, Ahmad M. Lie detection from single feature of functional near infrared spectroscopic (fNIRS) signals. In: 2nd international conference on electrical & electronic engineering (ICEEE 2017), 27–29 December, Rajshahi University of Engineering & Technology (RUET), Rajshahi, Bangladesh. 10.1109/ceee.2017.8412900.
- 50.Rahman MA, Rashid MMO, Khanam F, Alam MK, Ahmad M. EEG based brain alertness monitoring by statistical and artificial neural network approach. Int J Adv Comput Sci Appl. 2019 doi: 10.14569/ijacsa.2019.0100157. [DOI] [Google Scholar]
- 51.Rahman MA, Khanam F, Ahmad M. Detection of effective temporal window for classification of motor imagery events from prefrontal hemodynamics. In: International conference on electrical, computer and communication engineering (ECCE), Cox’s Bazar, Bangladesh, 2019. 10.1109/ecace.2019.8679317.
- 52.Vakkuri A, Yli-Hankala A, Talja P, Mustola S, Tolvanen-Laakso H, Sampson T, Viertiö-Oja H. Time-frequency balanced spectral entropy as a measure of anesthetic drug effect in central nervous system during sevoflurane, propofol, and thiopental anesthesia. Acta Anaesthesiol Scand. 2004;48(2):145–153. doi: 10.1111/j.0001-5172.2004.00323.x. [DOI] [PubMed] [Google Scholar]
- 53.Rahman MA. Topoplot for B-Alert X-10 9-channel EEG signal. MATLAB Central File Exchange. https://www.mathworks.com/matlabcentral/fileexchange/69991-topoplot-for-b-alert-x-10-9-channel-eeg-signal. Accessed 2 Apr 2019.
- 54.Rahman MA, Hossain MK, Khanam F, Alam MK, Ahmad M. Four-class motor imagery EEG signal classification using PCA, wavelet, and two-stage neural network. Int J Adv Comput Sci Appl. 2019 doi: 10.14569/ijacsa.2019.0100562. [DOI] [Google Scholar]
- 55.Shin J, Jeong J. Multiclass classification of hemodynamic responses for performance improvement of functional near-infrared spectroscopy-based brain–computer interface. J Biomed Opt. 2014;19(6):067009-1–067009-9. doi: 10.1117/1.jbo.19.6.067009. [DOI] [PubMed] [Google Scholar]


