Abstract
Animals are grouped into ~35 ‘phyla’ based upon the notion of distinct body plans1–4. Morphological and molecular analyses have revealed that a stage in the middle of development—known as the phylotypic period—is conserved among species within some phyla5–9. Although these analyses provide evidence for their existence, phyla have also been criticized as lacking an objective definition, and consequently based on arbitrary groupings of animals10. Here we compare the developmental transcriptomes of ten species, each annotated to a different phylum, with a wide range of life histories and embryonic forms. We find that in all ten species, development comprises the coupling of early and late phases of conserved gene expression. These phases are linked by a divergent ‘mid-developmental transition’ that uses species-specific suites of signalling pathways and transcription factors. This mid-developmental transition overlaps with the phylotypic period that has been defined previously for three of the ten phyla, suggesting that transcriptional circuits and signalling mechanisms active during this transition are crucial for defining the phyletic body plan and that the mid-developmental transition may be used to define phylotypic periods in other phyla. Placing these observations alongside the reported conservation of mid-development within phyla, we propose that a phylum may be defined as a collection of species whose gene expression at the mid-developmental transition is both highly conserved among them, yet divergent relative to other species.
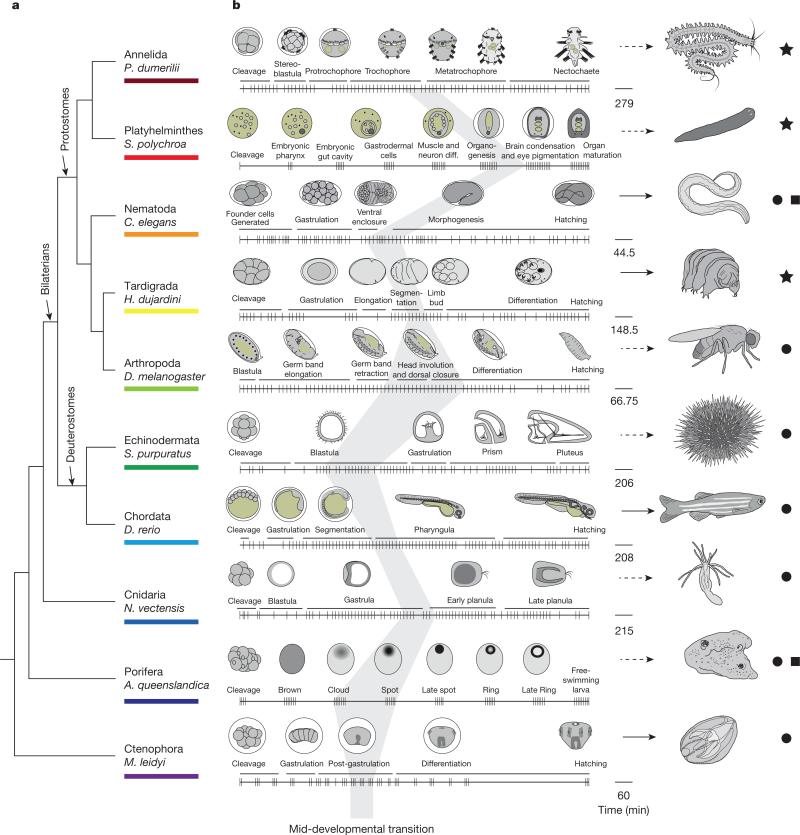
To study the broad patterns of embryonic development, we selected ten distantly related species that collectively provide a wide sampling of the variation exhibited by the animal kingdom at the level of morphological and developmental complexity (Fig. 1 and Extended Data Table 1). This collection includes a single species from poriferans, cnidarians, nematodes, arthropods, chordates, echinoderms, annelids, platyhelminthes, ctenophores, and tardigrades. Seven of the species are bilaterians—five protostomes and two deuterostomes—while the cnidarian Nematostella vectensis represents a clade that is the sister group to bilaterians, and the ctenophore Mnemiopsis leidyi and the poriferan Amphimedon queenslandica represent two earlier branching taxa11. Collectively, these species provide a unique platform for the study of global features in animal development.
Figure 1. Comparing development across ten phyla using CEL-Seq.
a, A phylogeny of the examined species based on recent work11,29,30. b, A representation of the times (notches) at which individual embryos were collected. Drawings of embryos at the indicated representative stages are shown above the collection time-course (on the right, timescale in minutes). The dark grey shading indicates the mid-developmental transitions. Stars, species where the developmental time-course is mapped to a mixed-stage transcriptome reported here; circles, mapped to the previously published genomes; squares, previously published time-courses13,28. Arrows indicate direct (solid) and indirect (dashed) developers.
For each species, we isolated on average 70 individual embryos spanning development (Fig. 1b). The transcriptome of each embryo was analysed using CEL-Seq12, a technique for low-input multiplexed RNA-seq. For three species—Hypsibius dujardini (tardigrade), Schmidtea polychroa (platyhelminth), and Platynereis dumerilii (annelid)—where a published genome was unavailable, we first produced a comprehensive developmental transcriptome (Extended Data Fig. 1, Extended Data Tables 2 and 3, and Supplementary Table 1). To assay dynamic expression so that it is not overly biased by individual embryos, for each of the ten time-courses we computed expression across twenty overlapping sliding windows of the embryos, sorted by BLIND13, a technique for ordering large-scale transcriptomic developmental time-courses (Extended Data Fig. 2a), and used these averaged expression profiles in our analyses.
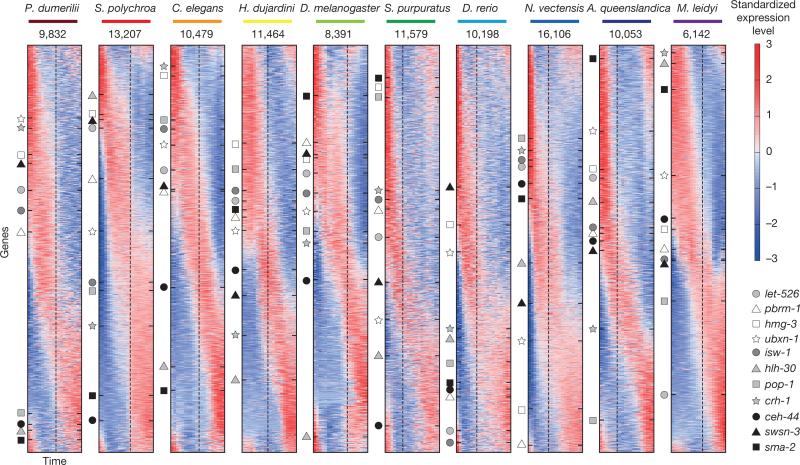
Figure 2 shows the standardized expression profiles of the dynamically expressed genes across the ten species (Extended Data Fig. 2b). To compare gene expression across these species, we delineated 11,139 orthologous protein families, with each orthologous family having representatives from an average of six species. The expression of eleven C. elegans transcription factors—conserved across the other species in this study—are indicated in Fig. 2, highlighting how this data set can serve as a resource for developmental and evolutionary biologists. For example, the TCF/LEF family is expressed in the early phases of six of the time-courses and later in the remaining species (Fig. 2, dark squares, TCF/LEF is named pop-1 in C. elegans).
Figure 2. Dynamic embryonic expression throughout the animal kingdom.
Sorted standardized temporal gene expression profiles for each species. Genes of eleven orthologous groups are indicated by the markers along with the name of the C. elegans orthologue. The dashed lines indicate the timing of the mid-developmental transition. The number indicates expressed genes in each data set.
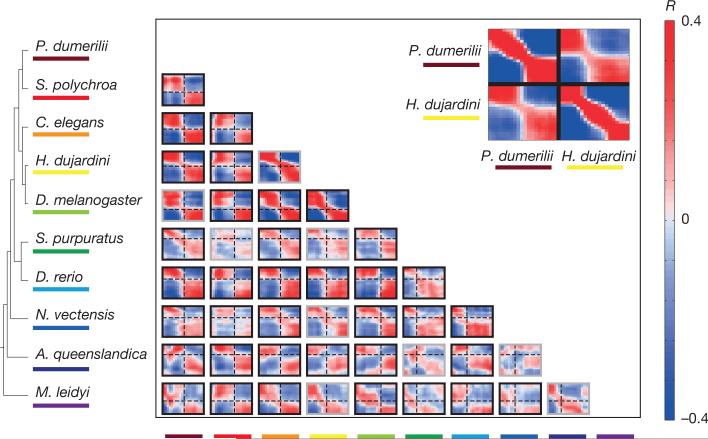
To systematically compare gene expression across species, we computed the correlation across orthologous gene expression throughout development for each pair of species. For example, comparison of tardigrade and annelid embryonic transcriptomes revealed two conserved phases of expression in these two species—early and late—separated by a sharp mid-developmental transition (P < 10−10, Kolmogorov–Smirnov test, Fig. 3, inset; Extended Data Fig. 3). These observations indicate that although the external embryonic development of these two species is enormously different—at the level of orthologous gene expression, their early and late development is comparable. Moreover, while development appears morphologically gradual in both species, it is punctuated by a dramatic change in gene expression during mid-development. Comparing all pairs of species extended this result, even for the ctenophore and the sponge, suggesting that this dual-phase feature of development dates back to the common ancestor of all animals (Fig. 3). The broad extent of this behaviour is remarkable, especially considering the challenges associated with the de novo assembly of transcriptomes and reliance upon inferred gene models. Deviations from the dual-phase pattern may occur for biological reasons. For example, the early embryos of the planarian S. polychroa contain substantial amounts of maternal RNA, which appears as a third initial phase in all comparisons with that species. Other deviations appear more cryptic, such as the correlation matrix between the cnidarian and the sponge. Overall, the dual-phase pattern holds for most pairwise species comparisons, with the exception of 9 out of 45 (Extended Data Fig. 3), and is robust to the parameters used for constructing the sliding window expression profiles and to possible biases in the embryo sampling (Extended Data Fig. 4a, b).
Figure 3. Cross-phyla comparison of developmental transcriptomes.
Each heat map shows the correlations between the developmental transcriptomes of a pair of species based upon analysis of 1,500 highly expressed orthologues (similar results are observed for other sets of orthologues, Extended Data Fig. 4c, d). Dashed lines indicate the mid-developmental transitions. The grey box outlines indicate species-pairs in which the transition is not significant (Extended Data Fig. 3). The inset shows the comparison for H. dujardini and P. dumerill, showing also the self-correlations.
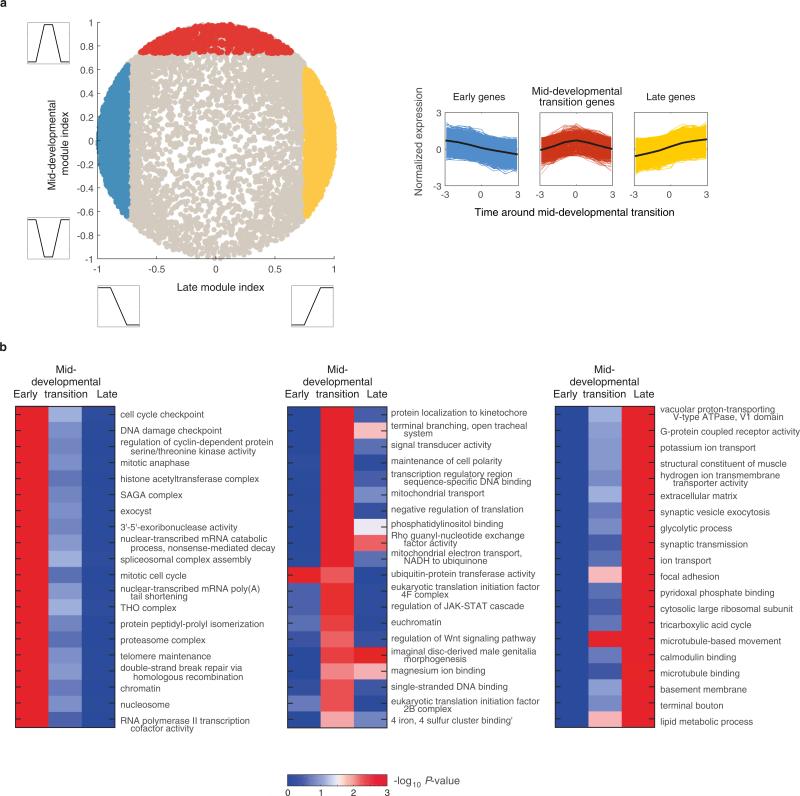
To study the deeply conserved expression modules we asked which Gene Ontology functional categories are enriched in the genes occurring in each of the two phases. Focusing on the stages spanning three windows before and following the transition, we identified genes whose expression is restricted to the early and late phases (Extended Data Fig. 5). We found that orthologous groups of genes that tend to be expressed in the early phase across the ten species are enriched for chromatin changes, cell cycle, and the regulation of gene expression (Extended Data Fig. 5), suggesting that this phase is characterized by the expression of genes involved in the cell biology of proliferation. The late phase, in contrast, was enriched with cell-type specific genes such as various transporters, metabolic enzymes, and synaptic transmission factors that together reflect a period of differentiation.
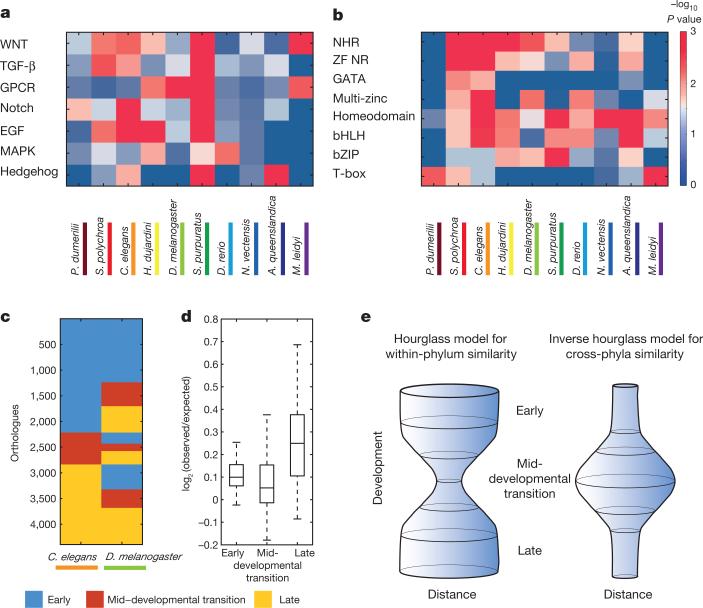
We next asked if the transition between the early and late phases is enriched in the expression of genes of particular functional groups, and found significant enrichments for signalling processes such as Notch and Wnt during this transition (Extended Data Fig. 5). Thus, a common signature among the animals studied here is that, between periods of cell proliferation and differentiation, a period of intense signalling occurs, which is expected from a developmental biology perspective14. To study the expressed signalling pathways in greater detail, we examined seven major pathways and tested for their enrichment during the transition between the two phases in each of the ten species (Fig. 4a). We found a pattern of variation indicating that each of the distantly related species uses a distinct suite of signalling pathways during the transition. Extending this analysis to transcription factor families, we found that only the homeobox gene family is enriched at the mid-developmental transition in all ten species, as might be expected; otherwise, each species expresses a unique combination of the major developmental transcription factors (Fig. 4b). A distinct combination of signalling pathways and transcription factors during the mid-developmental transition may thus be of particular importance to the development of specific body plans.
Figure 4. An inverse hourglass model for animal evolution.
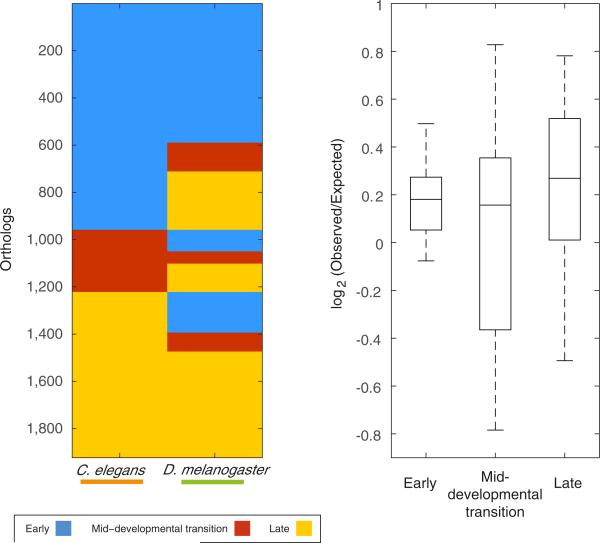
a, b, Functional enrichments for expression of seven signalling pathways (a) and seven transcription factor families (b) during the mid-developmental transitions. NHR, nuclear hormone receptors; ZF NR, zinc-finger nuclear receptors; multi-zinc, multiple zinc-fingers. c, Comparison of the orthologue temporal associations between C. elegans and D. melanogaster. d, Summary of the 45 pairwise species comparisons of orthologue temporal associations. e, Inverse hourglass model for the origin of phyla compared with the hourglass model for within-phylum evolution.
Mapping the timing of these mid-developmental transitions back onto the embryonic time-course of nematodes, arthropods, and chordates, we found that they overlap—or partially overlap—with the previously described phylotypic periods of these animals (Fig. 1b). Specifically, in nematodes the transition maps to the end of the ventral enclosure stage which has been proposed as the phylotypic period7 (Fig. 1b). In chordates, the transition maps to the early part of the pharyngula stage, which for this group of animals has been assigned the phylotypic period9,15. Furthermore, in arthropods, the transition centres upon the head involution and dorsal closure stage but also begins at the end of the germ-band stage, which has been assigned as the phylotypic period in this phylum16,17. Given this correspondence, we propose that the mid-developmental transition uncovered in this study marks a phylum's phylotypic period. We note, however, that the lack of complete correspondence of the arthropod mid-developmental transition with the germ-band stage will require further analysis and that this provisional definition will also need refinement to account for other taxonomic ranks (for example, class) and for the diversity of life cycles within a phylum.
In the annelid, the mid-developmental transition corresponds to the late trochophore stage, which overlaps the onset of differentiation of the first three larval segments, stomodeal opening (mouth), and ventral nerve cord18. These features have been proposed to define the phylotypic period in annelids19. Interestingly, the trochophore larva is common to other spiralian phyla (for example, molluscs and nemerteans). In the flatworm, which undergoes a highly derived mode of development20, the mid-developmental transition corresponds to the stage in which the embryonic pharynx is joined by a second ‘adult-pharynx’, consistent with the phylotypic period previously proposed for this phylum21. In the sponge, the mid-developmental transition may occur between the cloud and spot stages, when the primary larval axis is established22. We note however that in species with more complex life cycles with several phases of differentiation a single mid-developmental transition may be less accentuated.
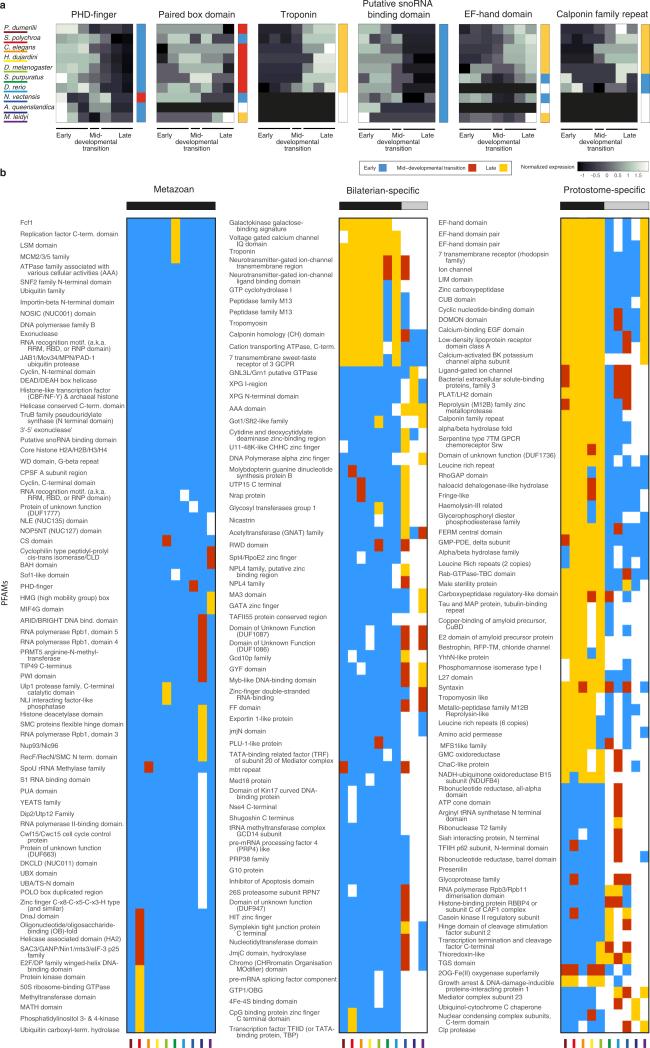
Finally, we measured the extent of evolutionary change within the two conserved phases and the mid-developmental transition by determining whether orthologues annotated for a particular temporal category in one species are also annotated to the same temporal category in another species. Figure 4c shows an example of this analysis for D. melanogaster and C. elegans. For 4,395 orthologues delineated between these two species, the early phase, mid-developmental transition, and the late phase expression account for 51%, 14%, and 35% of the C. elegans orthologues, respectively. A total of 28% of the orthologues are annotated to the early phase in both C. elegans and D. melanogaster, while by chance only 22% are expected given the fraction of genes in each category across the species (Fig. 4c). In contrast, 3% were expected to be conserved at the mid-developmental transition at random, and 3% were observed. The log-odds ratios between observed and expected for the early phase and the mid-developmental transition between C. elegans and D. melanogaster are thus 0.35 and 0, respectively. Comparing the log-odds ratios across the three temporal categories for each of the 45 pairs of the ten species, we found that the mid-developmental transition profiles are significantly less conserved than the early and late phase expression (Fig. 4d, P < 10−6 compared with the early phase and P < 10−12 with the late phase, Kolmogorov–Smirnov test). We found a similar result when comparing at the level of PFAM domains (Extended Data Figs 6 and 7).
Our results are consistent with an inverse hourglass model for metazoan body plans (Fig. 4e) in which the molecular components that comprise early and late embryogenesis are more conserved, and the signalling pathways and transcription factors acting within the mid-developmental transition are variable across major animal lineages (Fig. 4a, b). Interestingly, the model summarizing comparisons made within a phylum, where gene expression differences across species are minimal at the phylotypic period, has an inverse pattern23. Consequently, a ‘phylum’ may be defined as a set of species sharing the same signals and transcription factor networks during the mid-developmental transition. As a result, transcriptional variance will have an hourglass shape within the phylum, and the inverse is seen when comparing species across phyla (Fig. 4e). A non-phylum lower taxon would not meet these criteria since an hourglass pattern of similarities would be observed both within the taxon and across more distant species. Should this transcriptomic definition hold, evidence will be provided for the usefulness of ‘phylum’ as a biological classification. It may also suggest the delineation of new phyla, as well as the collapsing of previously distinct ones, requiring validation by zoological studies. We note that the topology of an inverted hourglass has been previously proposed for heterochrony at the phylotypic period24, though it was not invoked in the context of inter-phylum divergence.
While the Hox cluster has been implicated with the metazoan ‘zootype’25, we find that even organisms without Hox genes (Amphimedon26 and Mnemiopsis27) have a mid-developmental transition period at a time consistent with a phylotypic period (Fig. 1b). Thus, more ancient than the patterning of the body axis by Hox genes, may be the molecular constraints of the transition from a general phase of proliferation to a phase of signalling and differentiation that results in the positioning of cells in a phylum-specific manner. Such a transition may be a hallmark of development only in animals, or future work may show that this is a general characteristic of development in all multicellular life. It will be interesting to further employ systematic analyses in studying the developmental constraints on metazoans and other clades8,28.
METHODS
Data reporting
No statistical methods were used to predetermine sample size. The investigators were not blinded to allocation during experiments and outcome assessment.
Sample collection
Platynereis dumerilii embryos were collected in EMBL Heidelberg, Germany. In each of several containers, a gravid male and a female were mixed in a small container containing North Sea water. The classical breeding dance was observed after several minutes and the females and males released oocytes and sperm. Fertilized eggs were incubated at 18 °C and embryos were collected every hour after fertilization for a period of 5 days. Individual embryos were collected on the cap of a 1.5 ml Eppendorf tube using a micro mouth pipette. Excessive water was removed and the sample was flash-frozen in liquid nitrogen.
Schmidtea polychroa embryos were collected at the Max Planck Institute CBG, Dresden, Germany. A population of S. polychroa was maintained in the lab at 20 °C as previously described31. Egg capsules were regularly collected over 15 days of development just after deposition and kept in Petri dishes at 20 °C. To release embryos for isolation, capsules were carefully opened using two fine forceps. After assessment of stage of development according to the Martin–Duran system32 excess water was removed and embryos were flash-frozen in Eppendorf tubes in liquid nitrogen.
Hypsibius dujardini starting cultures were provided by Bob Goldstein (University of North Carolina at Chapel Hill) and embryos were collected as previously described33 at the Technion, Israel. Small cultures of tardigrades were kept in 60mm glass Petri dishes in commercial bottled spring water until gravid animals were visible. Tardigrades lay 2–5 eggs during molting, with the embryos deposited in their shed exoskeleton, the exuvia. Soon after the adult crawled out of the exuvia, it was cut open using a scalpel on a microscope cavity-slide to release embryos into the medium. Embryos were observed using a standard binocular and when reaching two-cell stage were deposited in a 10 μl drop mineral water on the cap of a 1.5 ml Eppendorf tube. Tubes were incubated for respective periods at 20 °C. For 4.5 days, once per hour past the two-cell stage, embryos were inspected for viability, excessive water was removed using a micro mouth pipette, and the tube was flash-frozen in liquid nitrogen.
Drosophila melanogaster embryos were collected at the Technion using a previously published protocol34. Briefly, agar plates with apple juice smeared with freshly prepared yeast were used to make young adult flies lay a lot of eggs. Cages consisting of such plates were set up with at least 20 flies and left for roughly one day for the flies to acclimatize. Plates were replaced with fresh ones twice in one hour interval to ensure the use of only newly laid eggs. Drosophila embryos are covered with a non-transparent chorion which has to be removed before live imaging by dechorionation. Shortly after being laid, embryos were washed off from plates into a plastic sieve using tap water and a fine brush used to loosen the embryos. In the sieve, embryos were submerged in 50% bleach solution for two minutes. Embryos were washed and rinsed with cold water. Using a needle pick, 20 embryos were placed in a row on a strip of agar placed on a glass slide. n-Heptane glue was applied in a thin layer on a big glass cover slip. This coverslip was carefully put upside down on top of the embryos on the agar strip so that embryos adhere to the glue layer. Embryos were covered with PBS and kept in humid chambers at 25 °C. Embryos on the coverslip were observed under the light microscope and for each embryo, the time of cellularization was noted. To collect an embryo, a needle pick was used to carefully remove it from the slide and it was flash-frozen in an Eppendorf tube in liquid nitrogen.
Strongylocentrotus purpuratus oocytes and sperm were kindly provided by Smadar Ben Tabou deLeon (Haifa University, Israel) and mixed and cultured at the Technion. Mixing occurred by 4 drops of sperm in 50 ml of eggs in sea water and incubated at 18 °C in Petri dishes. After fertilization, every 40 min (for a period of 72 hours), single embryos were deposited on the cap of a 1.5 ml Eppendorf tube. Excessive water was removed using a micro mouth pipette and the embryo was flash-frozen in liquid nitrogen.
Danio rerio fertilization was performed in the lab of Karina Yaniv (Weizmann Institute, Israel). Four female and one male Danio rerio fish were mixed in a breeder tank. Fertilized eggs were collected into zebrafish embryo medium as previously described35. Fertilized eggs were sampled in a small volume of medium every 40 min from fertilization into the cap of a 1.5 ml Eppendorf tube. Excess water was removed using a micro mouth pipette and the embryo flash-frozen in liquid nitrogen.
Nematostella vectensis egg masses and sperm were provided by Amos Schaffer (Gat Lab, Hebrew University of Jerusalem). Eggs and sperms were mixed and egg jelly was dissolved as previously described36 using 4% cysteine (pH 7.4–7.6) to make single embryos accessible for collection. The embryos were washed with cysteine six times using 30% of sea water. Fertilized embryos were observed under a light microscope and embryos reaching the 4-cell stage were deposited in a 10 μl drop of 30% salt water on the cap of a 1.5 ml Eppendorf tube. Tubes were closed and incubated for respective periods at 20 °C. At collection time, embryos were inspected for viability and excessive water was removed using a micro mouth pipette. The embryo was then flash-frozen in liquid nitrogen. After (and including) the four-cell stage, every 20 minutes (for a period of 48 hours when the embryos reached the late planula stage), single embryos were deposited on the cap of a 1.5 ml Eppendorf tube.
Mnemiopsis leidyi embryos were collected in the Whitney Institute, University of Florida as previously described37. Stages ranged from the fertilized egg to 20 h. Three replicate time-courses each comprising 20 embryos were isolated. In one replicate, embryos were flash frozen and shipped on dry ice. In the other two RNA was prepared by a TRIzol extraction and shipped in 75% ethanol on dry ice.
RNA-seq transcriptome sequencing
For Hypsibius dujardini, Schmidtea polychroa, and Platynereis dumerilii, RNA was isolated from a mixed population of embryos, larvae, and adults according to the TRIzol protocol (Invitrogen). This RNA was processed according to the Illumina TruSeq RNA-seq protocol by the Technion Genome Center and 100 bp paired-end sequencing was performed. To pre-process the reads, ‘Sickle’38 was used for quality trimming with a threshold of 31 and Illumina adaptors were removed using ‘Scythe’39. Sequencing error correction was next made using the AllpathLG toolkit40 and poly-A sequences were trimmed using trimest (Gary Williams, unpublished). The resulting libraries were cleaned of short and duplicate reads using the fastx toolkit (Assaf Gordon, unpublished). Hypsibius dujardini's genome has been recently reported by two groups41,42.
Mapping to S. purpuratus and N. vectensis
The sea urchin transcriptome was downloaded from Echinobase, NCBI BioProject PRJNA81157. The longest Isoform per transcript was selected leaving ~21,000 peptides. For this organism the mapping was done more loosely with bowtie parameters set to “–mp 3,1 -N 1 -L 15” as the RNA-seq was done on a heterogenic population. For Nematostella we retrieved the T1 transcriptome from Stellabase43. Using Transdecoder (https://transdecoder.github.io) revealed that, of the ~115,000 transcripts, only ~53,000 encoded proteins. BLAST analysis of the encoded protein resulted in ~42,000 unique proteins and the longest transcript was selected for each protein.
CEL-Seq transcriptome sequencing
Total RNA was extracted from single embryos using TRIzol as previously described7 including minor adjustments. After the addition of TRIzol to the embryos the mixture was frozen in liquid nitrogen, thawed at 37 °C and vortexed for 30 s. This procedure was repeated five times. Chloroform was then added and the sample further processed. The dried total RNA pellet was dissolved in RNase-free water before introduction into subsequent amplification and sequencing library preparation steps. Using the CEL-Seq protocol44, 1 μl of a single embryo total RNA sample with a maximum concentration of 50 ng μl−1, was mixed with 1 μl of the ERCC spike-in kit diluted according to the manufacturer's protocol45. The libraries were sequenced using Illumina paired-end sequencing as previously reported in the CEL-Seq protocol44. For Read 1, used to determine the barcode, the first 15 bp were sequenced and for Read 2, used to determine the identity of the transcript, the first 35 bp were sequenced. The CEL-Seq pipeline is available at https://github.com/yanailab/CEL-Seq-pipeline.
CEL-Seq initial analysis pipeline
Transcript abundances were obtained from the sequencing data using custom scripts organized into a multistep paralleled computational pipeline. Briefly, after trimming and filtering, the paired-end reads were demultiplexed based on the first eight bases of the first read. For each sample, reads were mapped to a reference genome or transcriptome using bowtie2 version 2.2.3 (ref. 46) with default parameters and counted using htseq-count47 to generate read counts. Samples were filtered to include only samples with at least 500,000 reads and in additions ERCC spike-in information was also used to filter out samples with low correlation coefficients (<0.65) to the known concentration or with high (>0.3) spike-in to gene read count ratio. Read counts were then normalized by dividing by the total number of counted reads and multiplying by 106. Because CEL-Seq retains only the 3′ end of the transcript, this procedure yields the estimated gene expression levels in transcripts per million (tpm) without transcript length normalization. In this work, we compare the transcripts per million developmental profiles for different genes and across orthologues, and such comparisons are generally robust to overall RNA content changes.
De novo transcriptome assembly with stranding and 3′ anchoring
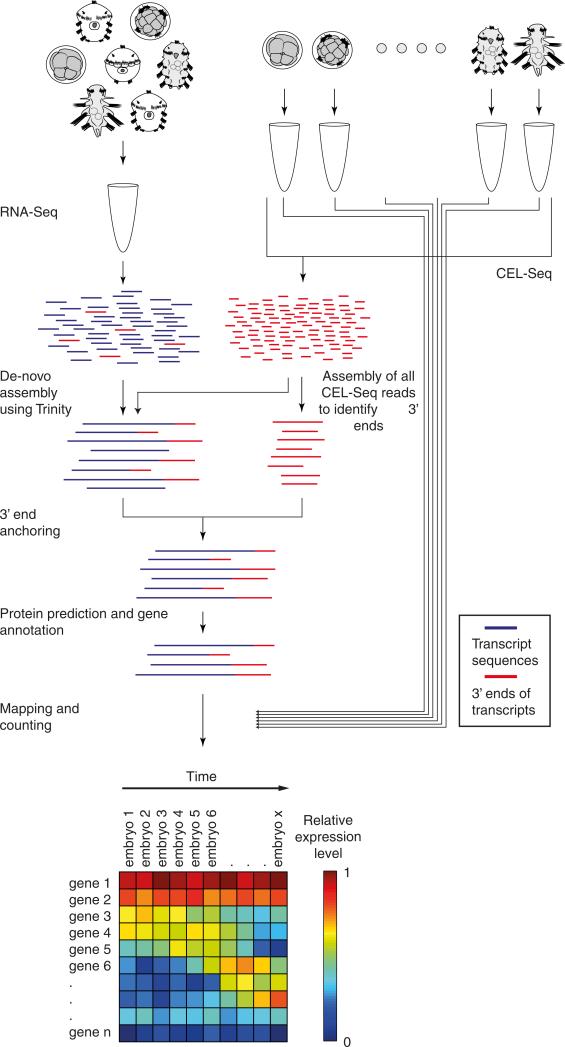
A de novo transcriptome was generated for S. polychroa, P. dumerilii and H. dujardinii. Since we had at our disposal CEL-Seq reads, in addition to the RNA-Seq reads, our strategy was to exploit the stranded and 3′-biased nature of CEL-Seq. The Trinity software48 was used to generate, for each of the three species, two de novo transcriptome assemblies: (1) single-end CEL-Seq reads were used to generate a 3′ biased stranded transcriptome, and (2) the CEL-Seq reads were combined with paired-end RNA-seq reads were used to generate a combined transcriptome. For the CEL-Seq 3′ assembly, we ran Trinity using the single-end mode with ‘SS_lib_type’ parameter set to ‘F’. For the combined assembly we ran Trinity using the paired-end mode with default parameters. The two resulting transcriptomes were then used to generate a single 3′ anchored stranded transcriptome. For each transcript (contig) in the first set, we identified the corresponding transcripts in the second set using BLAST49. Of those identified, we selected the transcript with the highest alignment score and used the strand information of the transcript in the first set to generate a stranded transcript (Extended Data Fig. 1). Genes with alternative 3′-ends may be represented as distinct genes in this set, in those rare cases when the CEL-Seq contigs do not overlap. The generated set of transcripts was further filtered to contain only transcripts with a predicted protein using the Trinotate pipeline that is a part of the Trinity software48. PFAM domains50 were then identified using HMMER51.
Gene Ontology and PFAM
GO annotations for each transcriptome were generated using Trinotate (http://trinotate.github.io/). Specifically, transcripts were searched against Uniprot sequences (comprising SwissProt and Trembl invertebrate, vertebrate, mammal, rodents and human data, clustered to 90% identity). GO and PFAM identifiers were then extracted from Uniprot accessions.
Delineation of orthologous clusters. OrthoMCL52 was used to delineate orthologous clusters from the ten proteomes of the ten species using the following parameters: “percentMatchCutoff” was set to 24, “evalueExponentCutoff” was set to −5, and the MCL parameters were “–abc -I 1.5”. In the case of multiple genes in an orthology cluster for a particular species, the one with the highest fold-change was selected as the representative. We found similar results if the representative is selected randomly among the inparalogues.
Developmental gene expression profiles
Each time-course was initially ordered using BLIND—an automated method for determining the developmental order of transcriptomic samples13 (Extended Data Fig. 2a). These profiles were smoothed using a moving average calculation with span parameter set to 3. In order to compare profiles of equal lengths, for each species we reduced the time-course to twenty sliding windows using the following method. We defined the size of the window such that there is only overlap between every two consecutive windows. For each window, the average expression was calculated for each gene across the included embryos. For each time-course, dynamic genes were defined as those with minimum expression of 10 transcripts per million and at least a twofold change. Standardized expression was used in analysis where noted: to generate a standardized expression, the mean expression value was subtracted from each expression value and the results were divided by the standard deviation. To generate the phasegrams shown in Fig. 2 we first standardized the log10 profiles by subtracting the mean and dividing by the standard deviation. We next computed the first two principal components of this expression data; since the profiles were standardized, the genes form a circle. The genes are then sorted according to their angle from the origin in this space. A gene expression profile was mapped to a temporal phase (early, transition, or late) by computing the correlation with the three idealized profiles shown in Extended Data Fig. 5 and assigning it to the pattern exhibiting the highest correlation and thus best match.
Mid-developmental transition detection
The transition period for each species was computed based upon the transcriptome similarities with the transcriptomes of the other species, shown in Fig. 3. The twenty transcriptomes were clustered using hierarchical clustering based upon the Euclidean distances among their profiles of correlations with the profiles of all other species. The two deepest clusters were then identified and the precise temporal window separating them was set as the mid-developmental transition period.
Gene Ontology (GO) enrichment analysis
A temporal phase was assigned to each orthologous group by annotating it to its most represented phase. The C. elegans Gene Ontology annotation was used on the C. elegans orthologues. Enrichment was computed using the hypergeometric distribution. In order to avoid retrieving enrichments due to the same set of genes we carried out serial enrichments as follows. The most enriched gene ontology group was noted, its genes removed from the set, and enrichment search was repeated to detect additional Gene Ontology terms. For the signalling pathways shown in Fig. 4b, the following gene ontology terms were used: ‘Wnt signalling pathway’, ‘Notch signalling pathway’, ‘hedgehog receptor activity’, ‘epidermal growth factor receptor signalling pathway’, ‘transforming growth factor beta receptor signalling pathway’, ‘MAPK cascade’, ‘G-protein coupled receptor activity’. For this analysis, we searched for enrichment up to three windows before and after the inferred transition, and kept the most significant P value for each pathway (hypergeometric distribution).
PFAM signatures
For each of 5,745 PFAMs, we computed an enrichment profile throughout time, and for each species, as follows. For each of the twenty expression windows of the matrix of standardized log10 expression values of the dynamic genes, we marked genes with expression above 0.5 as expressed. We then calculated the fraction of the genes within this set that contain genes annotated to the PFAM domain. A temporal phase was annotated using supervised clustering using the same approach shown in Extended Data Fig. 5. For the transcription factor families shown in Fig. 4d the following PFAMs were used: ‘Homeobox domain’, ‘GATA zinc finger’, ‘Ligand-binding domain of nuclear hormone receptor’, ‘Helix–loop–helix DNA-binding domain’, ‘bZIP transcription factor’, ‘Zinc finger, C4 type (two domains)’, ‘Zinc finger, C2H2 type’, and ‘T-box’. For this analysis, we searched for enrichment up to three windows before and after the inferred transition, and kept the most significant P value for each TF family (hypergeometric distribution).
Extended Data
Extended Data Figure 1. A schematic for the de novo transcriptome analysis.
See also the Methods section. CEL-Seq reads were mapped to the published transcriptomes where available.
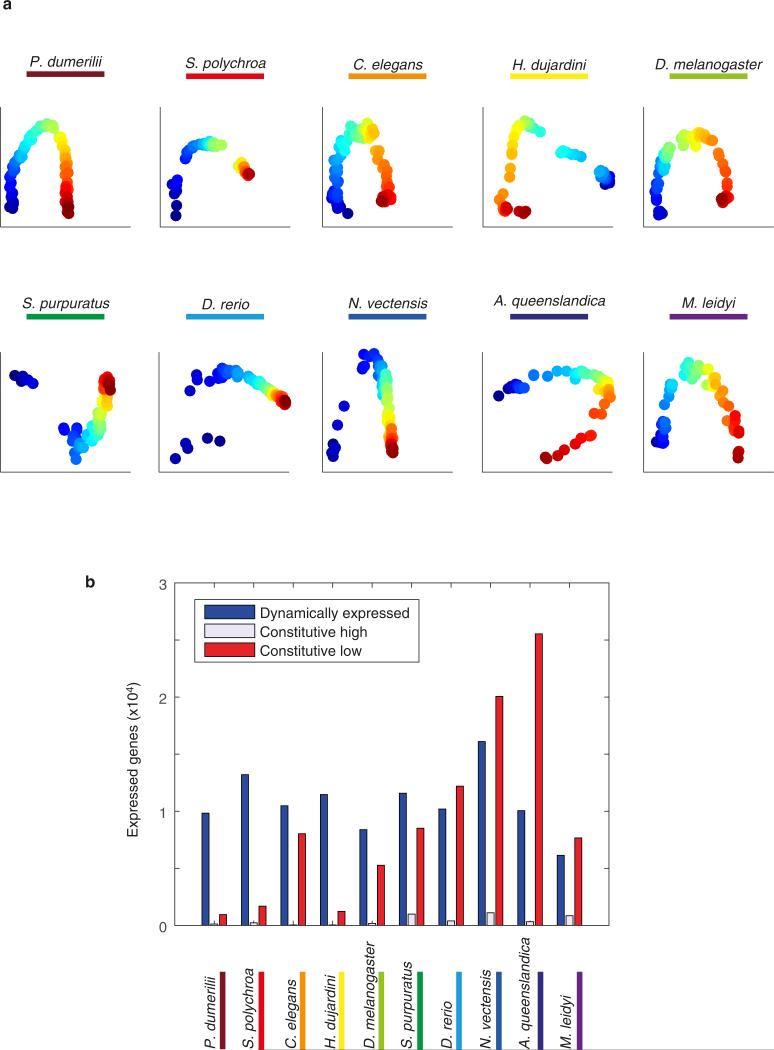
Extended Data Figure 2. Gene expression time-courses for ten species.
a, BLIND analysis on the reported time-courses. The colour indicates the ordering. The species is indicated for each plot. b, The number of dynamically expressed genes for each species. The species are shown in the same order as in the main figures. Constitutively high (low) expression is defined as that where the maximum expression is more (less) than the 10 transcripts per million threshold yet is not dynamic (two-fold change and at least 10 transcripts per million maximum expression).
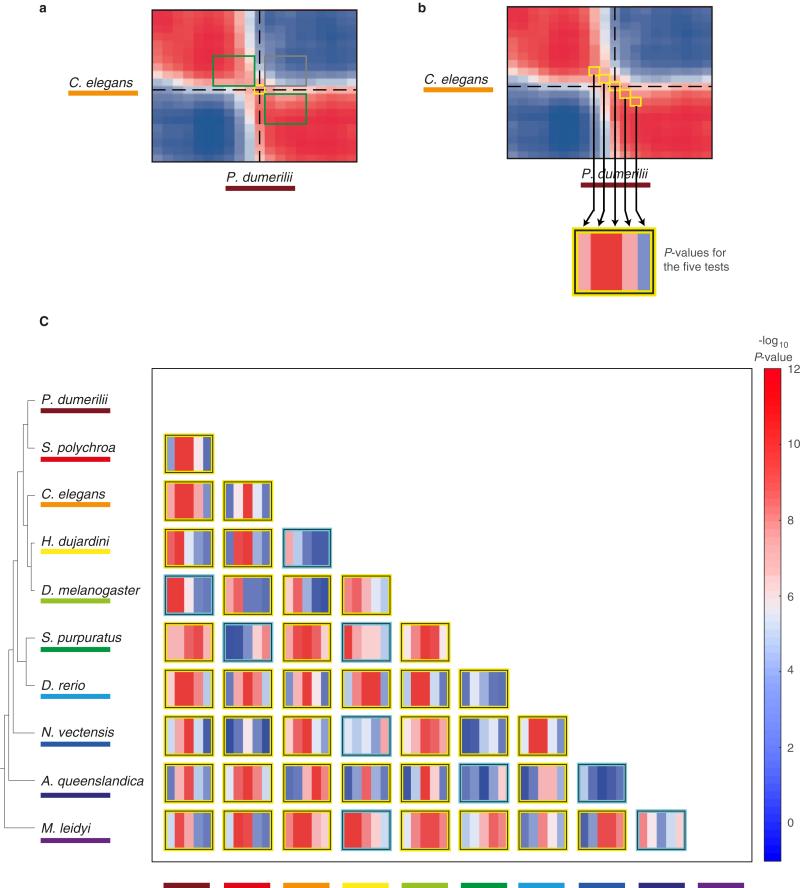
Extended Data Figure 3. Testing the significance of the transition in the orthologue correlation matrices shown in Fig. 3.
a, Schematic indicating the mid-developmental transition (orange), correlations among windows of the same phase (green), and correlations among windows of different phases (grey). b, The orange squares indicate statistical tests examined in c. c, For each pair of species a series of Kolmogorov–Smirnov tests are shown. Each test compares the intra-phase to the inter-phase correlations (a) for the mid-developmental transition and three windows before and after it (b). The yellow boxes indicate those species comparisons where there is significant statistical evidence for the dual-phase pattern (higher significance for the middle tests).
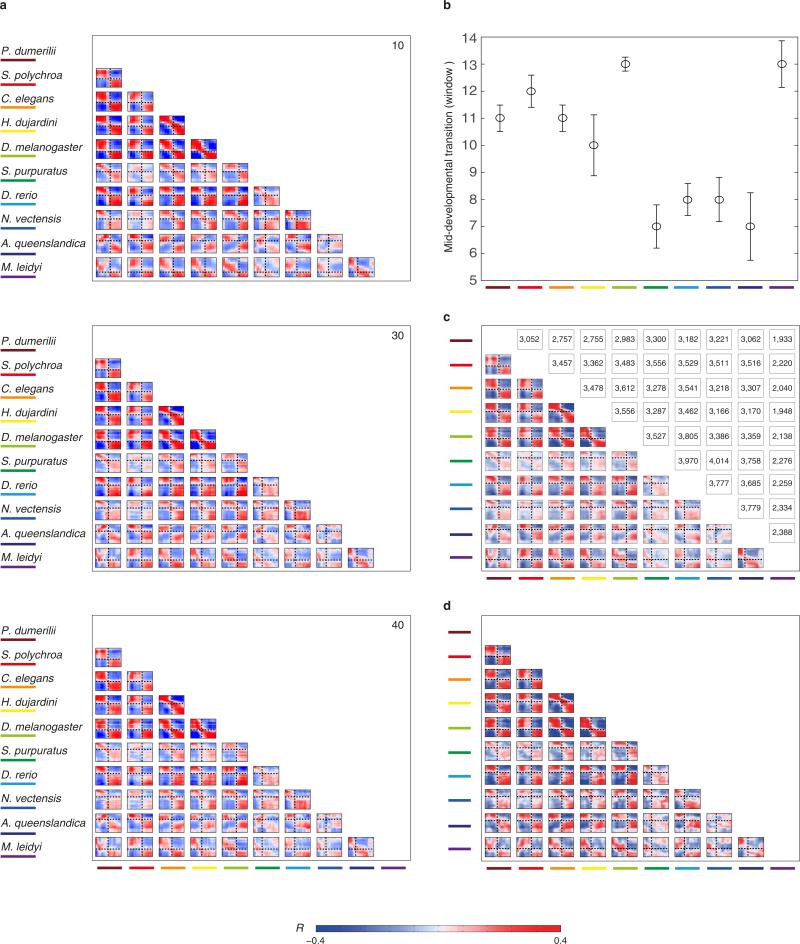
Extended Data Figure 4. Robustness of Fig. 3 analysis.
a, The analysis was repeated using the indicated number of sliding windows. b, The analysis was repeated by randomly removing embryo transcriptomes. From each of the ten data sets, we removed 10%, 20% or 30% of the embryos and repeated the analysis using 20 windows. We repeated this five times and then re-identified the mid-developmental transition. The plot indicates the median and standard deviation of the detected mid-developmental transition windows across these trials. In all species, the median is identical to the mid-developmental transition identified by the complete data set. c, d, Same as Fig. 3, using all detected orthologues for the pairwise comparisons (not limited to 1,500 as in Fig. 3, the number of examined orthologues are indicated above each plot) (c), and a set of 407 orthologues (d) across all taxa.
Extended Data Figure 5. Gene enrichment analysis.
a, A landscape showing for each gene (circle) the correlation with an idealized ‘late module profile’ (x axis) and with a ‘transition profile’ (y axis). The idealized profiles used to compute correlations are shown in the insets. Spots correspond to C. elegans genes. They are coloured according to the assigned sets: early module (blue), mid-developmental transition (red), and late module (yellow). b, Gene Ontology (GO) enrichment for the early phase, transition, and late phase gene sets. The gene sets were defined by integrating expression from all ten species. ‘RNA polymerase II...’ is short for ‘RNA polymerase II core promoter sequence-specific DNA binding transcription factor activity involved in preinitiation complex assembly’. The legend indicates the assigned sets: early phase (blue), mid-developmental transition (red), and late phases (yellow). The profiles are of length seven since we examined three windows before and after the mid-developmental transition.
Extended Data Figure 6. PFAM enrichment and conservation across phyla.
a, For each of 5,746 PFAM protein domains, we computed an expression signature based upon the fraction of its genes expressed at each stage throughout development across each of the ten species. As an example of this approach, a shows the signatures for six PFAMs, indicating the normalized fraction of genes in that group expressed at the time points surrounding the transition for each species. The profiles are centred according to the mid-developmental transition as defined in Fig. 3, examining four windows before and after it. The greyscale indicates the fraction of genes expressed in each window. We attributed a phase of expression for each PFAM in each species, as we have for individual genes. To the right of each PFAM signature is the annotated phase; early (blue), mid-developmental transition (red), or late (yellow). We then computed the degree to which the temporal expression across phyla matches a coherent phase expression in three groupings: metazoan, bilaterian, and protostomes. b, Metazoan (all ten species), bilaterian (all except the cnidarian, sponge, and ctenophore), and protostome (nematode, arthropod, tardigrade, annelid, and platyhelminth) groups are shown. To identify PFAMs in the metazoan group, we queried for PFAMs whose signature contains the same temporal phases of expression across the species. The metazoan-consistent PFAMs were nearly exclusively expressed in the early phase, suggesting stronger evolutionary constraints on this phase. A similar pattern was also observed for PFAMs with coherent expression in the seven bilaterian species in our data set. From this analysis, we conclude that bilaterians and protostomes each possess unique suites of innovations that are reflected in these shared phase-specific PFAM enrichments. Interestingly, protostome-coherent PFAMs are biased towards the late phases, possibly related to common differentiation processes operating in these taxa.
Extended Data Figure 7. Same as Fig. 4c, d for PFAM analysis.
The degree of conservation of early, transition, and late phase annotation of PFAMs was computed across species. A similar pattern was observed as that for orthologues (Fig. 4c, d).
Extended Data Table 1.
Developmental systematics of the examined species
| Species | Super-phyla classification |
Egg type; Cleavage type |
Direct developer53 |
Germ layers | Method of development |
Specialties | Ref |
|---|---|---|---|---|---|---|---|
| D. melanogaster | Metazoa/Bilateria/Protostomia/Ecdysozoa/Arthropoda | Centrolecithal egg; Syncytial cleavage | No | 3 | Embryonic development ends with hatching of the self-feeding first star larva | Cleavage occurs in a multinucleate syncytium | 54 |
| H. dujardini | Metazoa/Bilateria/Protostomia/Ecdysozoa/Tardigrada | Isolecithal egg; Rotational holoblastic cleavage | Yes | 3 | Embryonic development ends with hatching of self-feeding juvenile | Stereotyped cleavage pattern with asymmetric cell divisions | 34 |
| D. rerio | Metazoa/Bilateria/Deuterostome/Chordata | Telolecithal egg;Discoidal meroblastic cleavage | Yes | 3 | Embryonic development ends with hatching of larva still feeding on yolk | Teleost egg is telolecithal; i.e., a mound of cytoplasm (the blastodisc) sits on the large mass of yolk and undergoes incomplete (meroblastic) cleavage. Embryo is derived from the blastodisc, and the remainder of the zygote becomes the yolk sac, which is later digested. | 55 |
| S. polychroa | Metazoa/Bilateria/Protostomia/Lophotrochozoa/Platyhelmenthesis | “Blastomere anarchy” | No | 3 | Embryonic development ends with hatching of self-feeding juvenile | During early cleavage (stage 1), yolk cells fuse and enclose the zygote into a syncytium. The zygote divides into blastomeres that dissociate and migrate into the syncytium. During stage 2, a subset of blastomeres differentiate into a transient embryonic epidermis that surrounds the yolk syncytium, and an embryonic pharynx. Other blastomeres divide as a scattered population of cells in the syncytium. During stage 5 the external syncytial yolk mantle is resorbed and the embryonic cells contained within differentiate into an irregular scaffold of muscle and nerve cells. Epidermal cells differentiate and replace the transient embryonic epidermis. | 56 |
| C. elegans | Metazoa/Bilateria/Protostomia/Ecdysozoa/Nematoda | Isolecithal egg; Rotational holoblastic cleavage | Yes | 3 | Embryonic development ends with hatching of self-feeding L1 larva | Stereotyped cleavage pattern with asymmetric cell divisions | 57 |
| A. queenslandica | Metazoa/Porifera | Chaotic cell cleavage and morular delamination | No | 0 | Embryogenesis gives rise to larvae with at least a dozen cell types that are segregated into three layers and patterned along the body axis. | The pattern of cells within the embryo appears to be individualistic, suggesting that fixed cleavage patterns and cell lineages do not exist.The embryos develop asynchronously in brood chambers until they reach a certain size, then disperse as parenchymella larvae. | 58 |
| P. dumerilii | Metazoa/Bilateria/Protostomia/Lophotrochozoa/Annelida | Isolecithal egg; Spiral holoblastic cleavage | No | 3 | Embryogenesis gives rise to Mid-nectochaete larvae | Larval development comprises traditionally three major stages: the trochophore - spherical larva characterized by an equatorial ciliated belt and an apical organ with a ciliary tuft, the metatrochophore - segmented trunk, which slightly elongates ,and the nectochaete - bears parapodial appendages used for swimming and crawling, and resembles the adult in major traits. | 18 |
| S. purpuratus | Metazoa/Bilateria/Deuterostome/Echinodermata | Isolecithal egg; Radial holoblastic cleavage | No | 2 | Embryonic development ends in a pluteus larva that transforms after 1-3 months in the plankton into a juvenile urchin | By the 60-cell stage, most of the embryonic cell fates are specified, but cells are not irreversibly committed. Certain blastomeres consistently produce the same cell types in each embryo, but these cells remain pluripotent and can give rise to other cell types if experimentally placed in a different part of the embryo. | 59 |
| M. leidyi | Metazoa/Ctenophora | Centrolecithal and isotropic eggs; Unipolar and holoblastic cleavage | Yes | 2 | Embryos develop into and hatch as juvenile adults with a free-swimming cydippid stage | Fertilized eggs go through a highly stereotyped ctenophore-specific cleavage program in which the fate of some (but not all) blastomeres are determined at the time of their birth. | 60 |
| N. vectensis | Metazoa /Cnideria | Telolecithal egg; Holoblastic cleavage | No | 2 | Embryonic development ends in a primary polyp | Early cleavage stages are characterized by substantial variability from embryo to embryo, yet invariably lead to the formation of a coeloblastula. | 61 |
Extended Data Table 2.
Basic statistics of the expression data
| Species | Average counted reads (genes) |
Average counted reads (ERCC) |
Genes | Counted genes |
Dynamically expressed genes |
Collected samples |
Collected samples |
|---|---|---|---|---|---|---|---|
| P. dumerilii | 852,212 | 88,165 | 10,908 | 10,906 | 9,832 | 97 | 80 |
| S. polychroa | 781,744 | 37,837 | 15,124 | 15,124 | 13,207 | 132 | 58 |
| C. elegans | 1,364,849 | 4,626 | 20,687 | 18,553 | 10,479 | 139 | 81 |
| H. dujardini | 1,498,810 | 199,916 | 12,746 | 12,744 | 11,464 | 126 | 62 |
| D. melanogaster | 1,784,414 | 90,767 | 15,682 | 13,842 | 8,391 | 91 | 77 |
| S. purpuratus | 462,396 | 141,587 | 21,092 | 17,443 | 11,579 | 87 | 57 |
| D. rerio | 2,010,010 | 32,058 | 32,433 | 22,790 | 10,198 | 106 | 88 |
| N. vectensis | 1,147,629 | 176,166 | 40,499 | 37,272 | 16,106 | 123 | 83 |
| A. queenslandica | 1,783,845 | 45,455 | 44,719 | 35,922 | 10,053 | 63 | 51 |
| M. leidyi | 1,583,798 | 6,111 | 16,548 | 14,664 | 6,142 | 60 | 53 |
Extended Data Table 3.
Assemblies for CEL-Seq mapping and their BUSCO completeness53
| Species | Assembly used for mapping | BUSCO |
|---|---|---|
| P. dumerilii | Pdum_transcriptome_v1 (De Novo - NCBI BioProject PRJNA271451) | 57% |
| S. polychroa | Spol_transcriptome_v1 (De Novo - NCBI BioProject PRJNA271420) | 70% |
| C. elegans | WS230 (WormBase) | 90% |
| H. dujardini | Hduj_transcriptome_v1 (De Novo - NCBI BioProject PRJNA271450) | 71% |
| D. melanogaster | BDGP5 (Ensembl) | 99% |
| S. purpuratus | WHL22 transcriptome63,64 | 78% |
| D. rerio | Zv9 (Ensembl) | 96% |
| N. vectensis | NvT1 (Stellabae)65 | 78% |
| A. queenslandica | Aqu2.166 | 83% |
| M. leidyi | MlScaffold0911,67 | 70% |
Supplementary Material
Acknowledgements
We thank M. Rockman and B. de Bivort for helpful discussions. We also thank U. Gat, A. Salzberg, S. B. Tabou De Leon, M. Blaxter, G. Koutsovoulos, S. Mansour, and B. Goldstein for materials and reagents. We thank the Technion Genome Center for technical assistance and the Radcliffe Institute for Advanced Studies at Harvard University for hosting the analysis phase. This work was supported by a European Research Council grant (EvoDevoPaths), the EMBO Young Investigator Program, and a grant from the Australian Research Council.
Footnotes
Online Content Methods, along with any additional Extended Data display items and Source Data, are available in the online version of the paper; references unique to these sections appear only in the online paper.
Supplementary Information is available in the online version of the paper.
Author Contributions M.L., T.H., and I.Y. conceived and designed the project. M.L. led the collection of samples with help from N.N., D.S., N.M., S.K. and A.J.-V. The processing of the samples for CEL-Seq was carried out by M.L., T.H., N.M., S.K., and N.S. De novo transcriptome assembly was carried out by L.A. with assistance from I.Y., E.W., J.F.R., and S.-Y.L. Processing of CEL-Seq reads and initial bioinformatics was performed by L.A. with help from M.F., E.W., E.K., D.H.S, O.S., T.L., and S.L.F.-V. The data was analysed by I.Y. and L.A. I.Y. coordinated the interpretation of the data with significant help from B.M.D.; L.A., S.M.D., T.H., A.G.C., D.A., J.F.R., M.Q.M., K.Y., and J.C.R. also contributed to the interpretation of the data. I.Y. wrote the manuscript which the authors commented on.
Author Information The complete data set has been deposited to the NCBI GEO database GSE70185. The authors declare no competing financial interests. Readers are welcome to comment on the online version of the paper.
References
- 1.Valentine JW. On the Origin of Phyla. Univ. Chicago Press; 2004. [Google Scholar]
- 2.Haeckel E. The Evolution of Man. Vol. 1. C. K. Paul & Company; 1879. [Google Scholar]
- 3.Darwin C. Murray J, editor. On the Origin of Species by Means of Natural Selection, or, The Preservation of Favoured Races in the Struggle for Life. 1859 [PMC free article] [PubMed] [Google Scholar]
- 4.Gould SJ. Ontogeny and Phylogeny. Harvard Univ. Press; 1977. [Google Scholar]
- 5.Abzhanov A. Von Baer's law for the ages: lost and found principles of developmental evolution. Trends Genet. 2013;29:712–722. doi: 10.1016/j.tig.2013.09.004. [DOI] [PubMed] [Google Scholar]
- 6.Kalinka AT, et al. Gene expression divergence recapitulates the developmental hourglass model. Nature. 2010;468:811–814. doi: 10.1038/nature09634. [DOI] [PubMed] [Google Scholar]
- 7.Levin M, Hashimshony T, Wagner F, Yanai I. Developmental milestones punctuate gene expression in the Caenorhabditis embryo. Dev. Cell. 2012;22:1101–1108. doi: 10.1016/j.devcel.2012.04.004. [DOI] [PubMed] [Google Scholar]
- 8.Domazet-Lošo T, Tautz D. A phylogenetically based transcriptome age index mirrors ontogenetic divergence patterns. Nature. 2010;468:815–818. doi: 10.1038/nature09632. [DOI] [PubMed] [Google Scholar]
- 9.Irie N, Kuratani S. Comparative transcriptome analysis reveals vertebrate phylotypic period during organogenesis. Nature Commun. 2011;2:248. doi: 10.1038/ncomms1248. [DOI] [PMC free article] [PubMed] [Google Scholar]
- 10.Scholtz G. Balkema AA, editor. Evolutionary Developmental Biology of Crustacea. Crustacean Issues. 2004;15:3–16. [Google Scholar]
- 11.Ryan JF, et al. The genome of the ctenophore Mnemiopsis leidyi and its implications for cell type evolution. Science. 2013;342:1242592. doi: 10.1126/science.1242592. [DOI] [PMC free article] [PubMed] [Google Scholar]
- 12.Hashimshony T, Wagner F, Sher N, Yanai I. CEL-Seq: single-cell RNA-Seq by multiplexed linear amplification. Cell Rep. 2012;2:666–673. doi: 10.1016/j.celrep.2012.08.003. [DOI] [PubMed] [Google Scholar]
- 13.Anavy L, et al. BLIND ordering of large-scale transcriptomic developmental timecourses. Development. 2014;141:1161–1166. doi: 10.1242/dev.105288. [DOI] [PubMed] [Google Scholar]
- 14.Davidson EH. The Regulatory Genome: Gene Regulatory Networks in Development And Evolution. Academic Press; 2006. [Google Scholar]
- 15.Ballard WW. Morphogenetic movements and fate maps of vertebrates. Am. Zool. 1981;21:391–399. [Google Scholar]
- 16.Patel NH. Developmental evolution: insights from studies of insect segmentation. Science. 1994;266:581–590. doi: 10.1126/science.7939712. [DOI] [PubMed] [Google Scholar]
- 17.Sander K. In: Development and Evolution. Goodwin BC, Holder N, Wylie CC, editors. Cambridge Univ. Press; 1983. pp. 137–160. [Google Scholar]
- 18.Fischer AH, Henrich T, Arendt D. The normal development of Platynereis dumerilii (Nereididae, Annelida). Front. Zool. 2010;7:31. doi: 10.1186/1742-9994-7-31. [DOI] [PMC free article] [PubMed] [Google Scholar]
- 19.Slack JMW. In: Keywords and Concepts in Evolutionary Developmental Biology. Hall BK, Olson WM, editors. Vol. 476. Harvard Univ. Press; 2003. [Google Scholar]
- 20.Cardona A, Hartenstein V, Romero R. Early embryogenesis of planaria: a cryptic larva feeding on maternal resources. Dev. Genes Evol. 2006;216:667–681. doi: 10.1007/s00427-006-0094-3. [DOI] [PubMed] [Google Scholar]
- 21.Martín-Durán JM, Egger B. Developmental diversity in free-living flatworms. Evodevo. 2012;3:7. doi: 10.1186/2041-9139-3-7. [DOI] [PMC free article] [PubMed] [Google Scholar]
- 22.Adamska M, et al. The evolutionary origin of hedgehog proteins. Curr. Biol. 2007;17:R836–R837. doi: 10.1016/j.cub.2007.08.010. [DOI] [PubMed] [Google Scholar]
- 23.Raff RA. The Shape of Life: Genes, Development, and the Evolution of Animal Form. Univ. Chicago Press; 1996. [Google Scholar]
- 24.Richardson MK. Vertebrate evolution: the developmental origins of adult variation. Bioessays. 1999;21:604–613. doi: 10.1002/(SICI)1521-1878(199907)21:7<604::AID-BIES9>3.0.CO;2-U. [DOI] [PubMed] [Google Scholar]
- 25.Slack JM, Holland PW, Graham CF. The zootype and the phylotypic stage. Nature. 1993;361:490–492. doi: 10.1038/361490a0. [DOI] [PubMed] [Google Scholar]
- 26.Larroux C, et al. The NK homeobox gene cluster predates the origin of Hox genes. Curr. Biol. 2007;17:706–710. doi: 10.1016/j.cub.2007.03.008. [DOI] [PubMed] [Google Scholar]
- 27.Ryan JF, Pang K, Mullikin JC, Martindale MQ, Baxevanis AD. The homeodomain complement of the ctenophore Mnemiopsis leidyi suggests that Ctenophora and Porifera diverged prior to the ParaHoxozoa. Evodevo. 2010;1:9. doi: 10.1186/2041-9139-1-9. [DOI] [PMC free article] [PubMed] [Google Scholar]
- 28.Hashimshony T, Feder M, Levin M, Hall BK, Yanai I. Spatiotemporal transcriptomics reveals the evolutionary history of the endoderm germ layer. Nature. 2015;519:219–222. doi: 10.1038/nature13996. [DOI] [PMC free article] [PubMed] [Google Scholar]
- 29.Hejnol A, et al. Assessing the root of bilaterian animals with scalable phylogenomic methods. Proc. R. Soc. Lond. B. 2009;276:4261–4270. doi: 10.1098/rspb.2009.0896. [DOI] [PMC free article] [PubMed] [Google Scholar]
- 30.Dunn CW, et al. Broad phylogenomic sampling improves resolution of the animal tree of life. Nature. 2008;452:745–749. doi: 10.1038/nature06614. [DOI] [PubMed] [Google Scholar]
- 31.Martín-Durán JM, Duocastella M, Serra P, Romero R. New method to deliver exogenous material into developing planarian embryos. J. Exp. Zool. B Mol. Dev. Evol. 2008;310:668–681. doi: 10.1002/jez.b.21243. [DOI] [PubMed] [Google Scholar]
- 32.Martín-Durán JM, Amaya E, Romero R. Germ layer specification and axial patterning in the embryonic development of the freshwater planarian Schmidtea polychroa. Dev. Biol. 2010;340:145–158. doi: 10.1016/j.ydbio.2010.01.018. [DOI] [PubMed] [Google Scholar]
- 33.Gabriel WN, et al. The tardigrade Hypsibius dujardini, a new model for studying the evolution of development. Dev. Biol. 2007;312:545–559. doi: 10.1016/j.ydbio.2007.09.055. [DOI] [PubMed] [Google Scholar]
- 34.Kiehart DP, Crawford JM, Montague RA. Collection, dechorionation, and preparation of Drosophila embryos for quantitative microinjection. Cold Spring Harb. Protoc. 20072007 doi: 10.1101/pdb.prot4717. http://dx.doi.org/10.1101/pdb.prot4717. [DOI] [PubMed]
- 35.Detrich HW, Westerfield M, Zon LI. Essential Zebrafish Methods: Cell and Developmental Biology. Academic Press; 2009. [Google Scholar]
- 36.Fritzenwanker JH, Technau U. Induction of gametogenesis in the basal cnidarian Nematostella vectensis(Anthozoa). Dev. Genes Evol. 2002;212:99–103. doi: 10.1007/s00427-002-0214-7. [DOI] [PubMed] [Google Scholar]
- 37.Pang K, Martindale MQ. Mnemiopsis leidyi spawning and embryo collection. Cold Spring Harb. Protoc. 2008 doi: 10.1101/pdb.prot5085. 2008 http://dx.doi.org/10.1101/pdb.prot5085. [DOI] [PubMed]
- 38.Joshi N, Fass J. Sickle: A sliding-window, adaptive, quality-based trimming tool for FastQ files. 2011 https://github.com/najoshi/sickle.
- 39.Vince B. Scythe — A Bayesian adapter trimmer. 2011 https://github.com/vsbuffalo/scythe.
- 40.Gnerre S, et al. High-quality draft assemblies of mammalian genomes from massively parallel sequence data. Proc. Natl Acad. Sci. USA. 2011;108:1513–1518. doi: 10.1073/pnas.1017351108. [DOI] [PMC free article] [PubMed] [Google Scholar]
- 41.Boothby TC, et al. Evidence for extensive horizontal gene transfer from the draft genome of a tardigrade. Proc. Natl Acad. Sci. USA. 2015;112:15976–15981. doi: 10.1073/pnas.1510461112. [DOI] [PMC free article] [PubMed] [Google Scholar]
- 42.Koutsovoulos G, et al. The genome of the tardigrade Hypsibius dujardini. 2015 Preprint at bioRxiv http://dx.doi.org/10.1101/033464.
- 43.Sullivan JC, Reitzel AM, Finnerty JR. Upgrades to StellaBase facilitate medical and genetic studies on the starlet sea anemone, Nematostella vectensis. Nucleic Acids Res. 2008;36:D607–D611. doi: 10.1093/nar/gkm941. [DOI] [PMC free article] [PubMed] [Google Scholar]
- 44.Hashimshony T, Wagner F, Sher N, Yanai I. CEL-Seq: single-cell RNA-Seq by multiplexed linear amplification. Cell Rep. 2012;2:666–673. doi: 10.1016/j.celrep.2012.08.003. [DOI] [PubMed] [Google Scholar]
- 45.Baker SC, et al. The External RNA Controls Consortium: a progress report. Nature Methods. 2005;2:731–734. doi: 10.1038/nmeth1005-731. [DOI] [PubMed] [Google Scholar]
- 46.Langmead B, Salzberg SL. Fast gapped-read alignment with Bowtie 2. Nature Methods. 2012;9:357–359. doi: 10.1038/nmeth.1923. [DOI] [PMC free article] [PubMed] [Google Scholar]
- 47.Anders S, Pyl PT, Huber W. HTSeq—A Python framework to work with high-throughput sequencing data. Bioinformatics. 2015;31:166–169. doi: 10.1093/bioinformatics/btu638. [DOI] [PMC free article] [PubMed] [Google Scholar]
- 48.Haas BJ, et al. De novo transcript sequence reconstruction from RNA-seq using the Trinity platform for reference generation and analysis. Nature Protocols. 2013;8:1494–1512. doi: 10.1038/nprot.2013.084. [DOI] [PMC free article] [PubMed] [Google Scholar]
- 49.Altschul SF, Gish W, Miller W, Myers EW, Lipman DJ. Basic local alignment search tool. J. Mol. Biol. 1990;215:403–410. doi: 10.1016/S0022-2836(05)80360-2. [DOI] [PubMed] [Google Scholar]
- 50.Punta M, et al. The Pfam protein families database. Nucleic Acids Res. 2012;40:D290–D301. doi: 10.1093/nar/gkr1065. [DOI] [PMC free article] [PubMed] [Google Scholar]
- 51.Finn RD, Clements J, Eddy SR. HMMER web server: interactive sequence similarity searching. Nucleic Acids Res. 2011;39:W29–W37. doi: 10.1093/nar/gkr367. [DOI] [PMC free article] [PubMed] [Google Scholar]
- 52.Li L, Stoeckert CJ, Roos DS. OrthoMCL: identification of ortholog groups for eukaryotic genomes. Genome Res. 2003;13:2178–2189. doi: 10.1101/gr.1224503. [DOI] [PMC free article] [PubMed] [Google Scholar]
- 53.Simão FA, Waterhouse RM, Ioannidis P, Kriventseva EV, Zdobnov EM. BUSCO: assessing genome assembly and annotation completeness with single-copy orthologs. Bioinformatics. 2015 doi: 10.1093/bioinformatics/btv351. [DOI] [PubMed] [Google Scholar]
Associated Data
This section collects any data citations, data availability statements, or supplementary materials included in this article.


