Abstract
Free full text

A comprehensive strategy enabling high-resolution functional analysis of the yeast genome
Abstract
Functional genomic studies in Saccharomyces cerevisiae have contributed enormously to our understanding of cellular processes. Their full potential, however, has been hampered by the limited availability of reagents to systematically study essential genes and the inability to quantify the small effects of most gene deletions on growth. Here we describe the construction of a library of hypomorphic alleles of essential genes and a high-throughput growth competition assay to measure fitness with unprecedented sensitivity. These tools dramatically increase the breadth and precision with which quantitative genetic analysis can be performed in yeast. We illustrate the value of these approaches by using genetic interactions to reveal new relationships between chromatin-modifying factors and to create a functional map of the proteasome. Finally, by measuring the fitness of strains in the yeast deletion library, we addressed an enigma regarding the apparent prevalence of gene dispensability and found that most genes do contribute to growth.
A fundamental challenge of the post-genomic era is to assign functions to genes and to understand how gene networks are organized to execute diverse cellular processes. The budding yeast S. cerevisiae has served as a premier eukaryotic model system for this task1–5, and a library of strains in which each nonessential yeast gene is deleted has been an important tool for these efforts1. This resource has made it possible to assess the contribution of each nonessential gene to any measurable phenotype.
These genomic approaches can be extended by systematically measuring genetic interactions5. Genetic interactions describe how the phenotype associated with compromising one gene is modulated by perturbing a second gene. Such effects can be defined quantitatively as the difference between the observed magnitude of a phenotype for a double mutant and that expected if the genes do not interact, as given by ε= WAB − WA × WB, where ε is the interaction score and WX refers to the phenotype seen in genetic background X (refs. 6,7). Theoretical considerations and empirical experience have established the utility of genetic interactions in defining functional relationships between genes2,3,6,8. Early studies focused on ‘synthetic sick or lethal’ or ‘negative’ interactions3, in which the phenotype associated with perturbing two genes simultaneously is more severe than expected given the phenotypes of the individual gene perturbations (ε < 0). More recently, interactions in which the phenotype of a double mutant is less severe than expected (ε > 0, ‘alleviating’ or ‘positive’ interactions) have proven highly valuable as they often occur between genes that have closely related functions—for example, between members of the same complex or pathway2,9.
Functional genomic studies have been hampered, however, by two shortcomings of existing technologies. The first of these is the limited precision of many techniques for high-throughput growth measurement. Indeed, current approaches cannot be used to detect growth defects for a surprisingly large fraction of nonessential gene-deletion strains under standard conditions1,10. For example, in rich media, only about 20% of nonessential gene deletions are reported to cause measurable growth defects1,11, whereas at least 80% of genes are detectably expressed12. From an evolutionary standpoint it would be surprising if such a large fraction of expressed genes were truly dispensable for normal growth; one possible explanation is that for many gene deletions, growth phenotypes are present but difficult to measure using existing approaches. The technical challenges associated with measuring growth defects also have implications for chemical- and genetic-interaction studies, as the ability to quantitatively measure such interactions is critically dependent upon accurate fitness measurements. This is particularly true for identifying alleviating interactions, which typically requires detecting differences in growth even smaller than the defects seen for single-gene deletion strains.
A second major challenge is our limited ability to systematically probe the functions of the 1,033 essential yeast genes (~18% of open reading frames13). Essential genes are a highly conserved and medically relevant gene subset, with ~40% having counterparts in humans14. Two general approaches have been developed to systematically explore essential gene function. One strategy uses inducible gene inactivation, either by transcriptional shut-off14 or conditional protein destabilization15, and has proven quite effective for examining the immediate consequences of gene loss. These approaches, however, typically produce severe steady-state growth defects, complicating analysis of constitutive phenotypes14,15. The second approach, which involves the use of heterozygous diploids to reduce gene dosage, suffers from the opposite problem: most of these strains show no obvious growth defects11.
In large part owing to these limitations, over 1,100 yeast genes remain completely uncharacterized13, with many more that are poorly characterized or are likely to have noncanonical functions that have been overlooked. To facilitate high-precision functional analysis of the yeast genome, we constructed a library of hypomorphic alleles (alleles with reduced gene function) for ~82% of essential yeast genes using the decreased abundance by mRNA perturbation (DAmP) approach2. Additionally, we developed a rapid and sensitive flow cytometry–based growth competition assay that allowed us to detect growth defects and genetic interactions for many more strains in the deletion library than previously reported. Together, these tools enable in-depth functional dissection of pathways and complexes.
RESULTS
A library of hypomorphic alleles for essential yeast genes
We previously described an approach, termed DAmP, for creating hypomorphic alleles of essential genes2. In this strategy, a gene’s 3′ untranslated region (UTR) is disrupted with an antibiotic resistance cassette (Fig. 1a), thereby destabilizing the corresponding transcript and reducing the mRNA amount typically two- to tenfold2. Here we report the construction of DAmP alleles for 842 essential yeast genes (~82% of all essential genes; Fig. 1b and Supplementary Fig. 1 and Supplementary Data 1 online). We constructed strains first as diploids to minimize the accumulation of secondary mutations, then sporulated them to obtain the haploid DAmP library; both collections are available through Open Biosystems.
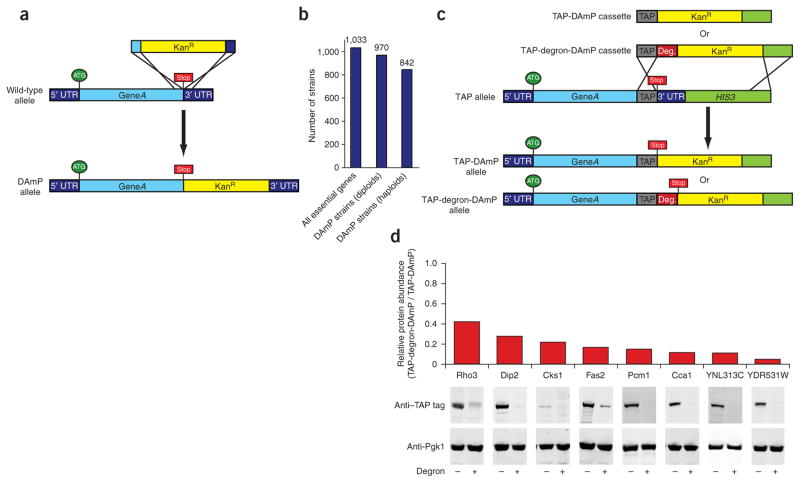
A library of hypomorphic alleles of essential yeast genes constructed using the DAmP approach. (a) Schematic of the strategy used to construct DAmP alleles. The kanamycin-resistance (KanR) cassette was inserted immediately after the open reading frame of each gene by transformation with a PCR product encoding the KanR cassette flanked at each end with homology to the targeted locus. (b) Number of DAmP diploid and haploid strains obtained. Of the 1,033 essential yeast genes, ~970 were obtained in diploid form and 842 as MATa haploids. (c) Schematic of the generation of DAmP strains and of degron-DAmP strains from existing strains with TAP tags by high-efficiency transformation with either of two universal cassettes. Deg, degron. (d) TAP-degron-DAmP alleles typically reduce protein abundance more than the DAmP allele alone as determined by western blots using an antibody to the TAP tag. To normalize for variation in loading, 3-phosphoglycerate kinase (Pgk1) was probed.
We also present a parallel approach for producing stronger hypomorphic alleles in which we combined the DAmP strategy with a short C-terminally fused degradation tag (degron)16 that targets the protein for proteasomal degradation (Fig. 1c). This approach takes advantage of a strain library containing tandem affinity purification (TAP) tags12 to efficiently produce degron alleles, using a cassette with homology to the TAP-tag sequence and to downstream sequences in these strains, without requiring gene-specific primers. Addition of the degron leads to 2.5- to >10-fold reduction in protein abundance beyond that in TAP-DAmP strains (Fig. 1d), and the majority of strains examined showed a corresponding reduction in growth rate (Supplementary Table 1 online).
Development of a high-throughput growth assay
The ability to precisely measure fitness in high throughput is necessary for functional genomic studies but has proven difficult to achieve in practice. A key issue is that functionally relevant differences in growth can be small and thus only become apparent after the cumulative effects of many generations. Consequently, approaches based on colony size2,3 or optical density10,17 measurements that do not carefully control the growth microenvironment are susceptible to external sources of variation that can obscure true biological differences. Methods using competitive growth can avoid this pitfall by measuring relative growth differences among strains competing in a homogeneous environment (for example, microarray-based monitoring of pooled competitions of the deletion library)1,4. Even in a competition-based format, however, precise measurements over a broad dynamic range are necessary.
We therefore developed a fitness assay in which we used flow cytometry to monitor growth competition of fluorescently tagged strains. In this assay, a red fluorescent protein (RFP)-expressing wild-type strain is co-cultured with a green fluorescent protein (GFP)-expressing strain bearing a mutation of interest, and the relative abundance of each strain is monitored over time by flow cytometry. The rate at which the fraction of mutant cells declines serves as a direct measure of the relative growth rate (Fig. 2). Notably, fluorescent protein expression allows the strains to be clearly distinguished with little to no effect on growth (Supplementary Fig. 2 online). This approach is also robust to variability in GFP expression attributable to a given mutation; in principle, even nonfluorescent mutant cells can be distinguished from wild-type cells on the basis of the latter’s RFP expression. Furthermore, the large number (~30,000) of cells measured by flow cytometry allows precise quantification of the ratio of mutant to wild-type cells in the co-culture over a range spanning approximately five orders of magnitude. Last, we paired this strategy with a high-throughput flow cytometry platform18 that allows ~2,000 competition time courses to be completed, in duplicate, per week.
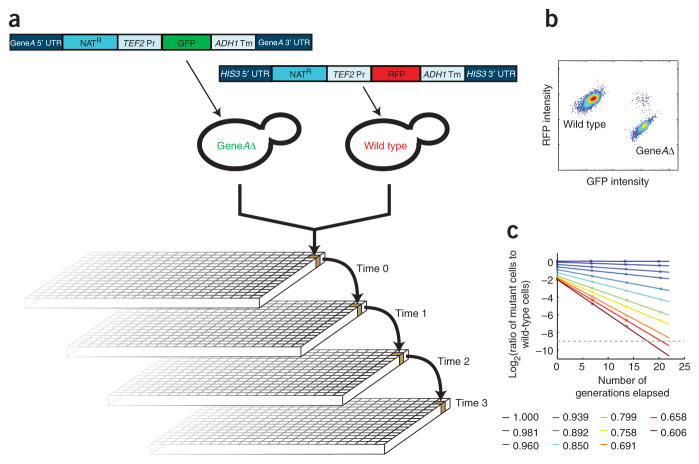
A flow cytometry–based technique for high-precision growth rate measurements. (a) Schematic of the assay. GFP-labeled mutant strains were competed with an RFP-labeled wild-type strain in 384-well format with cultures maintained by serial dilution over a 72-h time course. At each time point, samples were removed for analysis by flow cytometry to determine the ratio of GFP-positive to RFP-positive cells. (b) Wild-type and mutant cell populations can be resolved by flow cytometry. Rare events that appear to be GFP-positive and RFP-positive represent instances in which a mutant cell and a wild-type cell are misidentified by the cytometer as a single cell, and we took this into account during analysis. (c) Representative growth rate data obtained by flow cytometry. Relative growth rates spanning ~0.6 (sick) to 1.0 (wild-type growth) were observed with a high degree of linearity in the rate of mutant strain depletion over time. Dashed gray line indicates the approximate limit of sensitivity.
We evaluated the sensitivity and reproducibility of this technique by measuring the growth of 344 DAmP and deletion strains in triplicate. These replicate measurements were in good agreement (r = 0.993; Fig. 3a), with a median s.d. for the three measurements of 0.0038 (Fig. 3b and Supplementary Data 2 online). This reproducibility was maintained across a range of growth rates, with only modest increases in error for sicker strains (Fig. 3b). Thus, we can accurately measure growth rates from ~0.5–1.0 (where wild-type growth equals 1.0), a range that includes nearly all yeast single-gene deletions. Strains with more extreme fitness defects can likely be measured with simple experimental modifications, such as by using a slow-growing RFP competitor strain or by collecting additional measurements at early time points. Last, in the current form, our growth competitions include multiple entries and exits from saturation in addition to exponential growth. Thus, our assay likely detects competitive disadvantages in any of these steps, and direct comparisons with continuous exponential-phase growth data should be made with caution. However, our method could be readily modified for a variety of desired growth formats according to experimental needs.
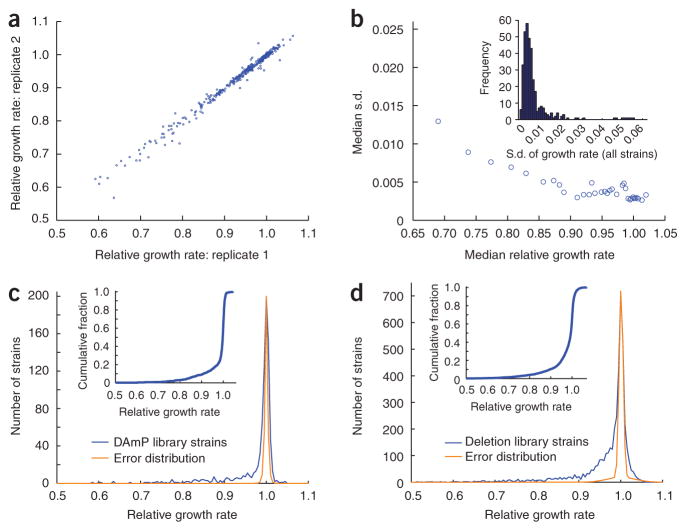
Growth rate measurements of deletion and DAmP yeast strains by the flow cytometry–based technique. (a) Correspondence between replicate measurements of relative growth rates for 344 deletion and DAmP strains. (b) Error as a function of the relative growth rate observed. For groups of 30 strains with similar growth rates, median fitness and median s.d. of triplicate measurements are shown. Inset, distribution of s.d. of triplicate measurements for all strains measured; the median s.d. was 0.0038. (c) Distribution predicted from experimental error and observed distribution of relative growth rates for 835 DAmP strains, with the inset showing the cumulative distribution of growth rates. (d) Distribution predicted from experimental error and observed distribution of relative growth rates for 4,204 deletion strains, with the inset showing the cumulative distribution of growth rates.
Fitness measurements for deletion and DAmP library strains
To explore the potential of our growth assay, we introduced the GFP expression cassette into the deletion and DAmP libraries and obtained growth rate measurements for 835 DAmP strains and 4,204 deletion strains. We analyzed the correspondence between full biological replicates (independently derived GFP-marked derivatives of the strains) to evaluate the uncertainty in our measurements (Supplementary Methods, Supplementary Fig. 3 and Supplementary Table 2 online). Notably, we confidently detected even very small growth defects (for example, >85% of strains with measured fitness between 0.985 and 0.990 had true growth defects; Supplementary Table 2). Thus, we estimate that 360 DAmP strains (~43% of 835 measured) and 1,875 deletion strains (~45% of 4,204 measured) have observable growth defects in minimal medium (Fig. 3c,d and Supplementary Data 3 and 4 online). Notably, the number of deletion strains for which we detected growth phenotypes considerably exceeds previous estimates (Supplementary Note online). Although this finding could in part result from differences in growth conditions, our ability to detect growth defects for more strains is dependent on the greater precision of our technique (Supplementary Fig. 4 online) and cannot simply be explained by differences in growth format. In support of the sensitivity of our assay, we also found several differences in the functional properties of genes that can be deleted with no apparent growth defect compared to those that cause even slight growth defects. For example, the former group was enriched for genes with very low expression19 and for genes involved in sporulation and the response to stress20, whereas the latter was not (data not shown and Supplementary Figs. 5 and 6 online). Finally, a few strains exhibited a slight growth advantage in our assay (Supplementary Data 3 and 4). Many of these strains contained mutations in genes encoding components of the cAMP-dependent protein kinase (PKA) pathway, including TPK2, TPK3, RAS2, GPA2, GPB1, GPB2, PDE2, SHR5 and IRA1. This notable enrichment suggests that this nutrient-sensing pathway may help to regulate or limit growth.
Chemical sensitivities of DAmP strains
Analysis of chemical sensitivity in heterozygous diploids can provide information about mechanisms of drug action21,22. We therefore explored the utility of our DAmP library for such screens. Indeed, with three antibiotics we tested in a drug halo assay (5-fluorouracil, sulfanilamide and clotrimazole), DAmP strains of the known targets (CDC21, FOL1, FOL3 and ERG11) had larger zones of growth inhibition than a wild-type strain (2.5-fold, 1.9-fold, 4.3-fold and 2.2-fold increases in the radii of inhibition, respectively; average of 2–4 replicates; Fig. 4a). Furthermore, in the case of ERG11, the DAmP strain was 1.4-fold more sensitive to clotrimazole than the heterozygous diploid strain. We also screened the DAmP library for sensitivity to tunicamycin, which inhibits N-linked glycolsyation in the endoplasmic reticulum23. The DAmP allele of ALG7, the direct target of tunicamycin, was by far the most sensitive strain in the library (Fig. 4b). Other sensitive strains identified were consistent with the role of glycosylation in protein folding and included DAmP alleles of genes encoding the endoplasmic reticulum chaperones Kar2 and Pdi1, members of the COP-I coatomer, and members of the protein synthesis and degradation machineries (Supplementary Data 3). Notably, several of these strains had only modest sensitivity to tunicamycin and may not have been detected using alleles that cause milder phenotypic effects or using a less precise growth assay. Together, these findings suggest that our DAmP library and growth assay are a highly effective complement to haplo-insufficiency as a strategy for discovery of drug targets21,22.
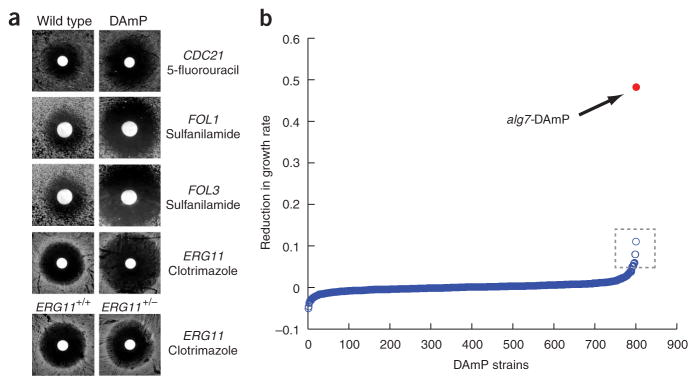
Utility of DAmP strains for identification of drug targets. (a) Sensitivity of DAmP alleles of known targets to the indicated drugs. Zones of growth inhibition surrounding drug-soaked discs were measured to determine the relative drug sensitivity of the indicated strains. (b) Distribution of growth defects for DAmP library strains grown in medium containing 0.25 μg/ml tunicamycin. Data for the strain bearing a DAmP allele of ALG7 is in red. Additional sensitive strains were also detected (dashed box; see Supplementary Data 2).
Measurement of genetic interactions by flow cytometry
A major challenge for functional genomics is the quantitative measurement of genetic interactions. The identification of alleviating (positive) interactions has been particularly difficult, as this requires detecting differences in growth that are even smaller than the defects observed for single-gene deletion strains. Additionally, there is a spectrum of positive genetic interactions in which the phenotype of a given mutation may be partially reduced, completely masked or even suppressed by the presence of a second mutation, with each of these outcomes having different biological interpretations17. However, the magnitude of the genetic interaction score alone cannot be used to resolve these classes, an issue that has been recently addressed by the introduction of a normalization6 that rescales raw interaction scores using as a natural reference point the value expected for ε in the case of complete alleviation (that is, the interaction score expected if the effect of the first mutation was completely masked by the second; Fig. 5a). This procedure defines normalized interaction scores (εNORM) as εNORM = ε/(min(WA,WB) −WA × WB), which yields εNORM = 1.0 for complete alleviation, εNORM = 0 for no interaction, 0 < εNORM < 1 for partial alleviation and εNORM > 1 for suppression6. However, because the absolute differences in growth rates involved are typically very small, in practice this normalization has been difficult to implement17.
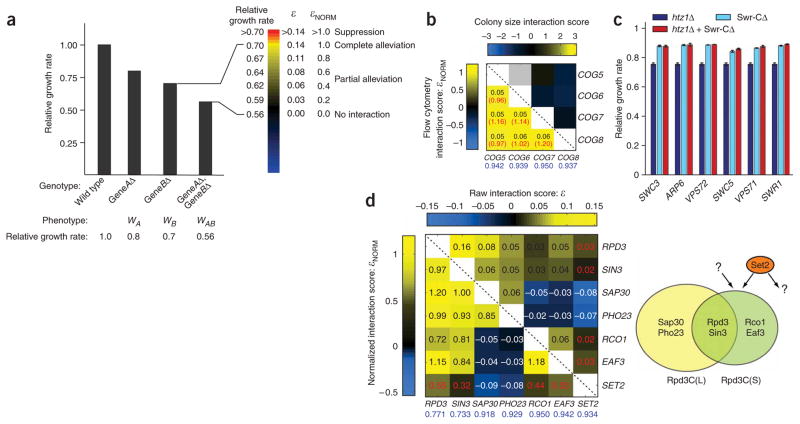
Highly sensitive growth rate measurements enable resolution of previously inaccessible classes of genetic interactions. (a) Schematic illustrating normalization of genetic interaction scores for an example case involving two genes, A and B. The bar graph indicates relative growth rates for the indicated strains, with the double-gene deletion growth rate shown to be equal to that expected for the case of no genetic interaction (left). For possible observed double-gene deletion growth rates, raw and normalized interaction scores are shown, along with the corresponding classes of alleviating interactions and a colorbar used for graphical representation of normalized interaction scores (right). (b) Comparison of genetic interactions observed between members of the COG complex when using fitnesses measured by flow cytometry (lower left) versus colony size (upper right; data from reference 2). Values shown for interactions calculated from flow cytometry measurements are the raw genetic interaction score (ε; black) and the normalized interaction score (εNORM; red). Relative growth rates for the single-gene deletion strains are indicated in blue. (c) Growth rates measured by flow cytometry for strains with deletions of HTZ1 and/or genes encoding members of the Swr-C. Error bars indicate s.d., n ≥ 3. (d) Genetic interactions between genes encoding members of Rpd3C(S) and Rpd3C(L). The organization of these complexes is shown schematically at right (note that both complexes also contain additional members). Question marks indicate additional functions for Set2 and Rpd3C(S) suggested by genetic interaction data. Raw interaction scores (upper right) and normalized interaction scores (lower left) were calculated as in a. Note that synthetic (ε < 0) interactions are normalized using a different scale (see Supplementary Methods).
To determine whether our growth assay permits us to distinguish among these types of positive interactions, we examined three complexes and pathways. First, we focused on the conserved oligomeric Golgi (COG) complex, a mediator of vesicular trafficking to the Golgi apparatus24. The genes COG5–COG8 encode four tightly associated subunits of this complex and exhibit a similar pattern of phenotypes and genetic interactions2. However, colony size–based genetic interaction measurements did not detect the alleviating interactions expected between these genes2, presumably because loss of the complex only mildly affects growth (Fig. 5b). By contrast, we clearly resolved these positive interactions with our growth assay (Fig. 5b). Moreover, the normalized interaction scores were ~1.0 and thus reflect the complete alleviation expected when the loss of any subunit fully disrupts complex formation.
Next, we examined interactions between HTZ1, which encodes the histone variant H2A.Z, and members of the Swr complex (Swr-C), a histone exchange factor that deposits H2A.Z into chromatin25. As previously reported9, we detected positive interactions between htz1Δ and deletions of genes encoding Swr-C members. However, the absence of H2A.Z reduced fitness more severely than did the loss of the complex responsible for its deposition (Fig. 5c). Furthermore, deletion of genes encoding Swr-C components suppressed, rather than simply alleviated, the phenotype of the htz1Δ strain (that is, εNORM > 1). This unexpected suppression suggests a more complex relationship between the functions of H2A.Z and those of the Swr-C.
Our genetic interaction measurements also helped to dissect the more intricate functional relationships in the pathways involving Rpd3, a multifaceted histone deacetylase that exists in two distinct physical complexes. Specifically, the core components (Rpd3 and Sin3) associate with different accessory proteins to form both a small complex, Rpd3C(S), and a large complex, Rpd3C(L)26 (Fig. 5d). As expected, we detected positive interactions between genes encoding members of the same complex. However, a more striking pattern emerged after normalization: the wide range of raw ε values converged on a value very close to 1.0 (complete alleviation; Fig. 5d). Such normalization therefore removed the potentially confounding effects of gene deletions with different growth rates.
One exception to this pattern is the histone methyltransferase Set2, which mediates recruitment of Rpd3C(S) to chromatin via Eaf3 (ref. 26). Although the genetic interactions between set2Δ and members of Rpd3C(S) were positive, the εNORM values were considerably less than 1.0 (0.32–0.55; Fig. 5d). This incomplete alleviation suggests that Set2 has additional functions independent of Rpd3C(S), consistent with a recent report27, and that Rpd3C(S) must similarly have Set2-independent activities. These examples underscore the potential of high-resolution genetic interaction measurements to reveal complexity in pathways not readily accessible by traditional approaches.
Functional dissection of the 26S proteasome
The functional dissection of essential multiprotein complexes is an important technical challenge. We therefore tested the suitability of our DAmP alleles to study the proteasome, a 2.5-MDa macro-molecular machine with over 30 different subunits that are organized into a 20S core complex and a 19S regulatory particle28 (Fig. 6a). The core complex is composed of α and β rings, and the regulatory particle contains a lid subcomplex that mediates substrate deubiquitination and a base subcomplex that mediates recognition of ubiquitinated substrates and their ATP-dependent unfolding. The intricate yet modular organization of the proteasome makes it an excellent test case for dissection by our genetic approach. Futhermore, although its role in protein degradation is well appreciated, recent studies suggest additional functions for the proteasome, including the possibility that the regulatory particle can act independently of the core29.
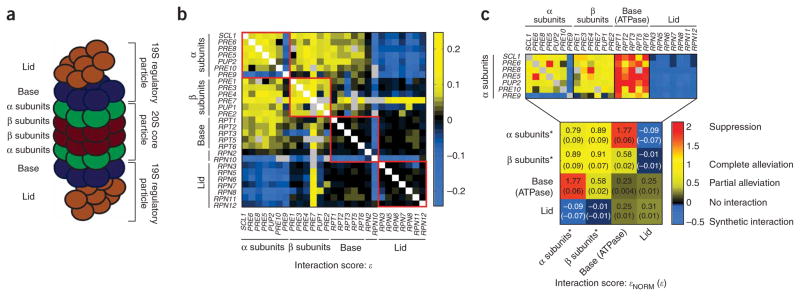
Functional dissection of the 26S proteasome. (a) Schematic representation of the 26S proteasome. (b) Map of raw genetic interaction scores for the 26S proteasome. Interactions between pairs of genes encoding components of the same physical subcomplex are indicated by red boxes. (c) Map of normalized interaction scores for the 26S proteasome. In the lower panel, double-mutants were grouped according to the subcomplex(es) with mutations, with the median score for each group shown (*, data for PRE9 and PRE7 were excluded when calculating the medians). Individual scores for interactions with the α ring subunits are shown at the top. Note that synthetic interactions (ε < 0) are normalized using a different procedure (see Supplementary Methods).
We measured growth rates for pairwise combinations of DAmP alleles to construct a genetic interaction map of the proteasome. This map revealed a rich set of interactions, with each subcomplex exhibiting distinct interactions consistent with the known organization of the proteasome (Fig. 6b). Furthermore, we observed exceptions to these trends that provided more detailed functional information. For example, PRE9 exhibits synthetic rather than alleviating interactions with DAmP alleles of other α ring subunits, and indeed, Pre9 is unique in that it is the only nonessential component of the core (thus we used a deletion rather than DAmP allele of PRE9). The basis of this dispensability was recently explained by the observation that, in the absence of Pre9, a second copy of Pre6 substitutes for Pre9 in the α ring30. Consistent with this, we observed a severe synthetic interaction between pre9Δ and pre6-DAmP (Supplementary Fig. 7a online). An additional example of the rich information content of our map is the distinction between the ATPase components of the base (RPT1-6), which exhibit positive interactions with α subunit genes, and the non-ATPase components RPN2 and RPN10, which do not.
We next explored whether normalized interaction scores could facilitate interpretation of the proteasome interaction map. Indeed, normalization revealed that the positive interactions both between pairs of α subunits and between pairs of β subunits represented instances of complete alleviation (Fig. 6c). This result is consistent with the cooperative association of these proteins into rings, where the least abundant ring component likely dictates the amount of functional proteasome formed. Normalization also revealed suppressive interactions between the ATPase components of the base and the α ring with which the base interacts. Notably, the median raw ε measured between base and α ring genes was smaller than that observed for fully alleviating interactions between α ring genes (0.06 versus 0.09), and thus only with high precision measurements is it possible to determine that the normalized interaction scores actually indicate the opposite relationship (1.77 versus 0.79; Fig. 6b,c and Supplementary Data 5 online). The mechanism by which decreasing amounts of the base proteins suppress the growth defects caused by reduced amounts of the α subunits remains to be explored. One possibility is that reduced amounts of the α ring permit unregulated activity of the base ATPases that may impact recently defined roles for the regulatory particle in transcription29. Finally, we observed similar suppressive interactions between pre7-DAmP (a β subunit) and genes encoding the regulatory particle (Supplementary Fig. 7b). A molecular basis for these interactions is not known to us but may merit further exploration. Thus, our analysis of the proteasome demonstrates that rich functional information can be obtained for essential complexes using DAmP alleles.
DISCUSSION
Our library of DAmP strains has several features that make it a useful resource. First, we constructed the library in the same strain background as the deletion library, and it uses the same linked antibiotic marker (kanamycin resistance)1. Thus, our strains can be immediately used in parallel with the deletion library in the assays that have been developed for that collection. Second, because the DAmP approach is based on mRNA destabilization by 3′ UTR disruption, DAmP strains express unmodified proteins from endogenous promoters and thus are unlikely to cause complications such as misregulation or neomorphic activities. Third, DAmP strains are likely to be a highly useful complement to heterozygous diploids for the identification of drug targets21,22. Fourth, our library has a similar range of growth defects as the deletion library, and therefore should prove as valuable for studying essential genes as the deletion library has for nonessential genes. Finally, degron-DAmP strains provide a ready means to obtain stronger hypomorphic alleles when desired.
The second key component of our study is the ability to measure fitness with unprecedented sensitivity. This sensitivity allowed us to identify growth phenotypes for a larger fraction of the deletion library than previously possible1,10,11. In total, our analysis revealed that roughly half (2,322 of 4,817) of nonessential gene deletion strains had measurable growth defects in a single condition, as 447 of the 613 strains not included in our dataset had been previously shown to exhibit growth phenotypes10,11. Taking into account the 1,033 essential genes, we obtained a new picture of yeast gene dispensability in which the majority (57%) of the genome (and an even larger fraction of the expressed genome; Supplementary Fig. 5) contributes to growth, even under a single growth format. This finding is important in the context of recent attempts to understand the surprising observation that many genes do not appear to contribute to fitness under standard conditions1,31,32. This robustness is partially explained by the presence of duplicate genes31 and by examples of condition-specific gene requirements1,32,33. Nonetheless, given that ~80% of genes are detectably expressed in a given condition12, it is difficult to rationalize why resources would be expended to produce these proteins if they do not contribute to fitness in that condition. Our data instead revealed that the majority (and perhaps the vast majority) of expressed genes do contribute to fitness. For many genes, this contribution is small in a laboratory context, but on an evolutionary timescale, the competitive advantage conferred by such genes is likely to be sufficient to ensure their retention.
The power of these quantitative genetic tools is illustrated by our ability to gain new functional insights for several complexes and pathways. We identified complete alleviating interactions for members of the COG complex2,24 and distinguished additional types of alleviating genetic interactions that suggest more complex functional relationships for members of the H2A.Z/Swr-C and Rpd3C(S)/Set2 pathways as well as for the proteasome. Such examples of unanticipated interactions even for well-characterized genes may indeed be more common than the idealized view of genes functioning predominantly in simple linear pathways.
The ability to dissect pathways and complexes in fine detail argues strongly for applying this approach more broadly across the large fraction of the yeast genome now amenable to quantitative genetic analysis. Indeed, the throughput of our growth assay is such that all currently known genetic and physical interactions can be explored at high resolution. A comprehensive strategy for yeast functional genomics would therefore be to broadly query the genome for interactions using lower-resolution ultra-high-throughput techniques2,4, then probe interaction-rich subsets more precisely by flow cytometry. Finally, our analysis of genetic interactions using DAmP alleles suggests that a comparable strategy using RNA interference may be directly applicable to functional genomics in metazoan systems. Thus, in both yeast and higher eukaryotes, quantitative genetic approaches have the potential to transform ongoing efforts to close the gap between genome and function.
METHODS
Growth rate measurement by flow cytometry
We prepared growth competitions in 384-well plates (Nunc) by mixing GFP-labeled mutant cells and RFP (dTomato34)-labeled wild-type cells using a Biomek NX liquid handling robot (Beckman Coulter). We inoculated co-cultures at a ratio of 2.5:1 (mutant:wild type) and at an optical density of ~0.1. We incubated plates sealed with Breathe-Easy gas-permeable membranes (Diversified Biotech) at 30 °C in humidified DTS-4 shakers (Elmi) at 1,200 r.p.m. for 24 h, at which point we made time-zero (T0) measurements. We made subsequent measurements (T1–T3) every 24 h, with each 24-h interval consisting of growth from optical density of ~0.05 to ~5.0. At each time point, we diluted cells 100-fold into fresh liquid media for growth until the next time point. For cytometry measurements, we diluted an aliquot of cells 12-fold into rich medium, incubated these cells with shaking for 90 min, washed them once with Tris-EDTA, pH 8.0 (TE) buffer, then resuspended the cells in TE for analysis. We counted RFP- and GFP-labeled cells using an LSRII cytometer fitted with a high-throughput sampler (Becton Dickinson). GFP was excited at 488 nm and fluorescence was collected through a 505-nm long-pass filter and a HQ515/20 band-pass filter (Chroma Technology). dTomato was excited at 532 nm and fluorescence collected through a 600-nm long-pass filter and a 610/20 band-pass filter (Chroma Technology).
Additional methods
Details of media used, strain construction and data analysis are available in Supplementary Methods.
Supplementary Material
Supp Data 1 file
Supp Data 2 file
Supp Data 3 file
Supp Data 4 file
Supp Data 5 file
supp
Acknowledgments
We acknowledge J. Hill and E. Rodriguez for help with strain construction; C.-S. Chin for flow cytometry software development; J. Newman for an introduction to high-throughput flow cytometry; R. Tsien (University of California, San Diego) for a construct encoding dTomato; B. Toyama for assistance with graphics; C. Boone, G. Giaever and C. Nislow for communication of results before publication; and V. Denic, J. Hollien, J. Ihmels, N. Ingolia, J. Newman and members of the Weissman laboratory for helpful discussion and critical reading of the manuscript. This work was supported by funding from the Howard Hughes Medical Institute (J.S.W.), the Fannie and John Hertz Foundation (D.K.B.), the US National Science Foundation (D.K.B) and the Larry L. Hillblom Foundation (D.M.C.).
References
Full text links
Read article at publisher's site: https://doi.org/10.1038/nmeth.1234
Read article for free, from open access legal sources, via Unpaywall:
https://europepmc.org/articles/pmc2756093?pdf=render
Citations & impact
Impact metrics
Citations of article over time
Alternative metrics
Smart citations by scite.ai
Explore citation contexts and check if this article has been
supported or disputed.
https://scite.ai/reports/10.1038/nmeth.1234
Article citations
Experimental evolution of Saccharomyces cerevisiae for caffeine tolerance alters multidrug resistance and target of rapamycin signaling pathways.
G3 (Bethesda), 14(9):jkae148, 01 Sep 2024
Cited by: 0 articles | PMID: 38989875 | PMCID: PMC11373655
An efficient gene targeting system using Δku80 and functional analysis of Cyp51A in Trichophyton rubrum.
AMB Express, 14(1):96, 31 Aug 2024
Cited by: 0 articles | PMID: 39215862 | PMCID: PMC11365917
Clearing the JUNQ: the molecular machinery for sequestration, localization, and degradation of the JUNQ compartment.
Front Mol Biosci, 11:1427542, 21 Aug 2024
Cited by: 0 articles | PMID: 39234568 | PMCID: PMC11372896
Loss-of-function mutations are main drivers of adaptations during short-term evolution.
Sci Rep, 14(1):7128, 26 Mar 2024
Cited by: 0 articles | PMID: 38532077 | PMCID: PMC10965932
SNARE chaperone Sly1 directly mediates close-range vesicle tethering.
J Cell Biol, 223(6):e202001032, 13 Mar 2024
Cited by: 3 articles | PMID: 38478018 | PMCID: PMC10943277
Go to all (344) article citations
Data
Data behind the article
This data has been text mined from the article, or deposited into data resources.
BioStudies: supplemental material and supporting data
Similar Articles
To arrive at the top five similar articles we use a word-weighted algorithm to compare words from the Title and Abstract of each citation.
Functional Profiling Using the Saccharomyces Genome Deletion Project Collections.
Cold Spring Harb Protoc, 2016(9), 01 Sep 2016
Cited by: 1 article | PMID: 27587776
Letter to the editor. Chemical-genetic strategy for inhibiting proteasome function in Saccharomyces cerevisiae.
Yeast, 29(2):93-94, 08 Dec 2011
Cited by: 6 articles | PMID: 22162073 | PMCID: PMC3657583
Screening the yeast genome for new DNA-repair genes.
Genome Biol, 3(4):REVIEWS1009, 13 Mar 2002
Cited by: 4 articles | PMID: 11983062 | PMCID: PMC139348
Review Free full text in Europe PMC
CRISPR/Cas9-Mediated Genome Engineering Reveals the Contribution of the 26S Proteasome to the Extremophilic Nature of the Yeast Debaryomyces hansenii.
ACS Synth Biol, 10(2):297-308, 27 Jan 2021
Cited by: 5 articles | PMID: 33501828
Funding
Funders who supported this work.


