Abstract
Free full text

An efficient and accurate new method for locating the F3 position for prefrontal TMS applications
Abstract
The International 10–20 system is a method for standardized placement of electroencephalogram (EEG) electrodes. The 10–20 system correlates external skull locations with the underlying cortical areas. This system accounts for variability in patient skull size by using certain percentages of the circumference and distances between four basic anatomical landmarks. This 10–20 system has recently been used in transcranial magnetic stimulation (TMS) research for locating specific cortical areas. In the treatment of depression (and some types of pain), the desired placement of the TMS coil is often above the left dorsalateral prefrontal cortex (DLPFC) which corresponds to the F3 location given by the 10–20 system. However, for an administrator with little experience with the 10–20 system, the numerous measurements and calculations can be excessively time-consuming. Additionally, with more measurements comes more opportunity for human error. For this reason we have developed a new, simpler and faster way to find the F3 position using only three skull measurements. In this paper, we describe and illustrate the application of the new F3 location system, provide the formulas used in the calculation of the F3 position, and summarize data from 10 healthy adults. After using both the International 10–20 system and this new method, it appears that the new method is sufficiently accurate; however, future investigations may be warranted to conduct more in dept analyses of the method's utility and potential limitations. This system requires less time and training to find the optimal position for prefrontal coil placement and it saves considerable time compared to the 10–20 EEG system.
Background
The International 10–20 system is a method for standardized placement of electroencephalogram (EEG) electrodes. The 10–20 system correlates external skull locations to the underlying cortical areas. This system accounts for variability in patient skull size by using certain percentages of the circumference and distances between four basic anatomical landmarks. The desired skull locations are found by using these measurements and relating them to the four landmarks [3]. This method has recently been used in transcranial magnetic stimulation (TMS) research for locating specific cortical areas [1,2,4]. The desired placement of the TMS coil is often above the dorsalateral prefrontal cortex (DLPFC) especially for the treatment of depression and certain types of pain [2]. There are several methods for locating the DLPFC. These methods include but are not limited to the 5 cm rule and neuroimaging/co-registration techniques. Both of these methods have advantages and disadvantages. The 5 cm rule requires the investigator to functionally locate the motor cortex and then move the TMS coil 5cm anterior along a parasagital line. This method is very fast and simple, but it does not take into account differences in cortical anatomies or skull sizes between each individual. Further, it has been shown that in many cases, the prefrontal location yielded by the 5cm rule can be appreciably posterior to the desired location. This is especially problematic in participants with larger skulls [2,3]. Neuroimaging/co-registration techniques offer an accurate means for locating specific cortical areas, but these approaches are more time consuming and much more expensive. The International 10–20 system is a compromise between the two methods mentioned above. It takes into account the individual head size, which the 5cm rule does not, and is also much less expensive than neuroimaging methods. Herwig's study [3] concludes that the 10–20 system is affordable and reliable when dealing with larger scale cortex areas.
Because the DLPFC is believed to correspond to the F3 location given by the 10–20 system, many clinical research applications might reasonably use F3 as a target [1,3,4]. However, for an administrator with little experience with the 10–20 system, the numerous measurements and calculations can be excessively time-consuming (especially considering that the TMS administrator preparing to do left-prefrontal TMS is only interested in one of 10–20 coordinates). Additionally, with more measurements comes more opportunity for human error. There are universal caps for the 10–20 system which alleviate much of the human error and time necessary to find specific locations; however, they are not free and not always readily available. For this reason we have developed a new method of finding the F3 position which requires fewer measurements and only tools which are commonly found in most laboratories. These tools include a felt tipped marker, a tape measure, and a computer. Free software is available for running the necessary calculations described below.
The Beam F3 System
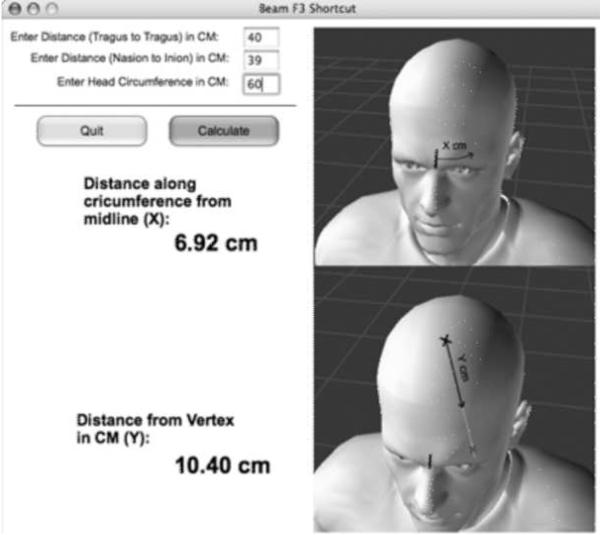
This new system for locating F3 requires the administrator to plug three measurement values into a free, stand-alone computer program. The program provides instructions as to how to find the F3 location. The first input into the computer program is the distance from nasion to inion, measured with a tape measure in cm. The administrator marks the halfway point on this line on the subject's scalp. He/she then measures from the left preaurical point to the right preaurical point. This measurement is entered into the program and the administrator marks the halfway point on this line as well. The vertex can now be marked on the patient's head by the intersection of the two lines. The last measurement the administrator takes is the circumference. The tape measure should be placed at the level of the eyebrow and pass over the inion for this measurement. Once this value has been input into the program, it produces two output values. The first is the distance to a point (we'll call point-x) along the circumference from the center-line (in cm's) and the second is the distance (in cm's) from the vertex along a line intersecting point-x. The distance from the vertex specified by the computer program along a ray beginning at the vertex and intersecting point-x, will be the F3 location from the 10–20 system.
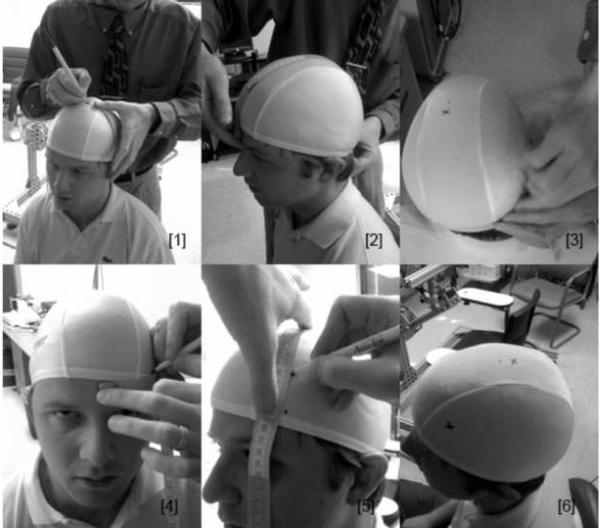
See figure 1 for an illustration of the system in practice, and figure 2 for a screen-shot of the free software program used to facilitate calculations.

Illustration of the Beam F3 Location system in practice. [1] measurement of the distance from tragus to tragus and marking of the midpoint [2] measurement of the distance from nasion to inion (the midpoint is marked here as well and the vertex is the point where the two lines containing the midpoints meet) [3] measurement of head circumference. Once these three measurements are attained, they are entered into the software package which provides two output values (values X and Y) [4] a point along the circumference is marked X cm from the midline [5] F3 is marked as a point along the line running from the vertex through the point created in the previous step Y cm from the vertex [6] the “x” at the top of the head is the vertex, the other “x” is the F3 location
Calculations Used in the Beam F3 Location System
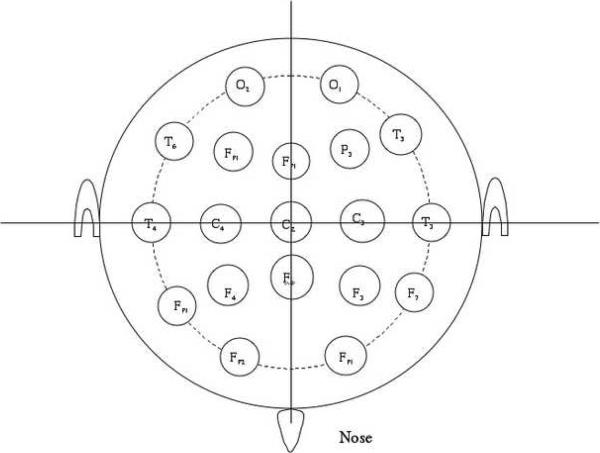
When looking at the basic 10–20 system one can create a coordinate plane and then find the equations of the two lines intersecting at the F3 location. Without loss of generality we will orient this coordinate plane with the nasion on 270° (the negative y-axis) and the inion on 90° (the positive y-axis) and the vertex in the center of the plane, as shown in figure 1.
First, we find the polar coordinates of the four desired points, which will allow us to find the two equations of the lines intersecting at the F3 location. We will let R1 be the distance from the vertex to the point Fpz. Likewise, we will let R2 be the distance from the vertex to the point T3.
The coordinates for the points Fz, F7, Fp1, and C3 are now intersected by an imaginary circle with radius R1. Note that a point in the polar coordinate system is expressed as two coordinates: the radial coordinate and the angular coordinate. The radial coordinate is the distance from the center of the plane and the point and the angular coordinate is the angle of the ray beginning at the center and containing the point. The angular coordinate is measured counter clockwise from the 0°ray (which is equivalent to the ray making up the positive half of the x-axis on the Cartesian plane)
The four points are expressed first as polar coordinates and then as Cartesian coordinates.
The equation to the line containing the points F7 and Fz is expressed in y intercept form as:
The equation of the line containing the points C3 and Fp1 is expressed in y intercept form as:
In order to find F3 we will set these two equations equal to one another, and then solve for x. Plug x into either of the first two equations and then solve for y. This will give you the following coordinates on the cartestian plane.
This pair of Cartesian coordinates must then be translated back polar coordinates
Now that we know the angle from the line from tragus to tragus, we will use its complementary angle in order to find the angle off of the midline.
Let this new angle be Φ. Then to find the distance(u) along the circumference(c) beginning at the midline we will use the following equation
Clearly, the head is not a flat plane nor is it a sphere. The distance from the vertex to the nasion or any other points around the circumference will be much longer if measured along the scalp than the shortest distance between the two points. This is because of the curvature of the head.
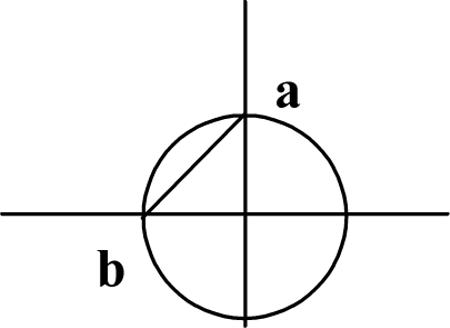
The radius coordinate of the polar coordinates for F3 must now go through a small correction in order to account for this. When measuring from vertex to the desired location we have assumed that the head is a sphere; however, upon looking at this measurement, the line we are measuring is actually closer to being on a plane than a sphere. The following diagram illustrates the shortest distance between a and b is a straight line as shown. The distance of the arc along a circle going through a and b with its center at the origin is shown.

Unlike our measurements from the vertex to the inion, nasion, or trachus, the measurement from the vertex to the F3 location close to a straight line. Therefore, we must find the correction for this distance. Assuming the distance from a to the center and be to the center are the same, say r, the distance from a to b is given by r(2)1/2. Whereas arc length from a to b will be given by (0.25)2π r = π r(0.5). Now to find the correction factor q we will solve for q in the following equation.
Thus we multiply the radius coordinate of the polar coordinates for F3 by 0.9 in order to account for the head not being a sphere.
Evaluation of the Beam F3 System
Ten healthy adults were enrolled in a preliminary pilot study to investigate the accuracy of the Beam F3 system. Participants were randomly assigned either to undergo the Beam F3 measurement followed by a standard 10–20 measurement, or to undergo the 10–20 measurement followed by the Beam F3 measurement. The 10–20 measurement system was implemented by a trained neurophysiology research assistant. All participants wore a form-fitting vinyl head cap that was held in place with a chin strap. All measurements were marked on the caps with a felt-tipped marker. After both system measurements were complete, the F3 locations determined by each system were compared and any difference between the two locations was measured with a fabric ruler. The locations matched exactly (i.e., distance of 0 mm between the points identified by each method) in 80% of participants, and were within 1mm of each other in the remainder of the sample (note, however that the observed differences could have been due to error in the administration of either the 10–20 or the Beam F3 systems). The Beam F3 system required only 20% of the time to conduct compared to the 10–20 system. These preliminary results support the reliability and utility of the Beam F3 System, however, future investigations might be warranted to conduct more in-depth analyses of its utility and potential limitations. Future studies should also be conducted comparing this system with not only the 10–20 system, but also the 5cm method as well as neuroimaging/co-registration systems.
Conclusions
The Beam F3 system may be an efficient an accurate way to locate the F3 position from the 10–20 system for prefrontal TMS applications. The free software package for running the Beam F3 system is available for download from the Software page at www.clinicalresearcher.org in either Mac or Windows formats.
Footnotes
Publisher's Disclaimer: This is a PDF file of an unedited manuscript that has been accepted for publication. As a service to our customers we are providing this early version of the manuscript. The manuscript will undergo copyediting, typesetting, and review of the resulting proof before it is published in its final citable form. Please note that during the production process errors may be discovered which could affect the content, and all legal disclaimers that apply to the journal pertain.
References
Full text links
Read article at publisher's site: https://doi.org/10.1016/j.brs.2008.09.006
Read article for free, from open access legal sources, via Unpaywall:
https://europepmc.org/articles/pmc2882797?pdf=render
Citations & impact
Impact metrics
Citations of article over time
Alternative metrics
Smart citations by scite.ai
Explore citation contexts and check if this article has been
supported or disputed.
https://scite.ai/reports/10.1016/j.brs.2008.09.006
Article citations
Procognitive Effects of Adjunctive D-Cycloserine to Intermittent Theta-Burst Stimulation in Major Depressive Disorder: Effets procognitifs de la D-cyclosérine en traitement complémentaire par la stimulation thêta-burst intermittente dans le trouble dépressif caractérisé.
Can J Psychiatry, 7067437241293984, 29 Oct 2024
Cited by: 0 articles | PMID: 39470367 | PMCID: PMC11562928
A phase I trial of accelerated intermittent theta burst rTMS for amnestic MCI.
J Neurol Neurosurg Psychiatry, 95(11):1036-1045, 16 Oct 2024
Cited by: 1 article | PMID: 38719432 | PMCID: PMC11483208
Impact of age-related hearing loss on decompensation of left DLPFC during speech perception in noise: a combined EEG-fNIRS study.
Geroscience, 24 Oct 2024
Cited by: 0 articles | PMID: 39446223
Effects of intermittent theta burst stimulation add-on to dialectical behavioral therapy in borderline personality disorder: results of a randomized, sham-controlled pilot trial.
Eur Arch Psychiatry Clin Neurosci, 19 Sep 2024
Cited by: 0 articles | PMID: 39297977
Trajectory Modeling and Response Prediction in Transcranial Magnetic Stimulation for Depression.
Pers Med Psychiatry, 47-48:100135, 22 Aug 2024
Cited by: 0 articles | PMID: 39257484
Go to all (209) article citations
Similar Articles
To arrive at the top five similar articles we use a word-weighted algorithm to compare words from the Title and Abstract of each citation.
Exploring the optimal site for the localization of dorsolateral prefrontal cortex in brain stimulation experiments.
Brain Stimul, 2(4):234-237, 03 Apr 2009
Cited by: 82 articles | PMID: 20633422
Comparison of Site Localization Techniques for Brain Stimulation.
J ECT, 35(2):127-132, 01 Jun 2019
Cited by: 5 articles | PMID: 30113992
Modulation of cortical responses by transcranial direct current stimulation of dorsolateral prefrontal cortex: A resting-state EEG and TMS-EEG study.
Brain Stimul, 11(5):1024-1032, 18 Jun 2018
Cited by: 15 articles | PMID: 29921529
Characterizing and Modulating Brain Circuitry through Transcranial Magnetic Stimulation Combined with Electroencephalography.
Front Neural Circuits, 10:73, 22 Sep 2016
Cited by: 50 articles | PMID: 27713691 | PMCID: PMC5031704
Review Free full text in Europe PMC
Funding
Funders who supported this work.
NINDS NIH HHS (2)
Grant ID: K23 NS050485
Grant ID: K23 NS050485-04


