Abstract
Free full text

Amyloid β (Aβ) Peptide Directly Activates Amylin-3 Receptor Subtype by Triggering Multiple Intracellular Signaling Pathways*
Abstract
The two age-prevalent diseases Alzheimer disease and type 2 diabetes mellitus share many common features including the deposition of amyloidogenic proteins, amyloid β protein (Aβ) and amylin (islet amyloid polypeptide), respectively. Recent evidence suggests that both Aβ and amylin may express their effects through the amylin receptor, although the precise mechanisms for this interaction at a cellular level are unknown. Here, we studied this by generating HEK293 cells with stable expression of an isoform of the amylin receptor family, amylin receptor-3 (AMY3). Aβ1–42 and human amylin (hAmylin) increase cytosolic cAMP and Ca2+, trigger multiple pathways involving the signal transduction mediators protein kinase A, MAPK, Akt, and cFos. Aβ1–42 and hAmylin also induce cell death during exposure for 24–48 h at low micromolar concentrations. In the presence of hAmylin, Aβ1–42 effects on HEK293-AMY3-expressing cells are occluded, suggesting a shared mechanism of action between the two peptides. Amylin receptor antagonist AC253 blocks increases in intracellular Ca2+, activation of protein kinase A, MAPK, Akt, cFos, and cell death, which occur upon AMY3 activation with hAmylin, Aβ1–42, or their co-application. Our data suggest that AMY3 plays an important role by serving as a receptor target for actions Aβ and thus may represent a novel therapeutic target for development of compounds to treat neurodegenerative conditions such as Alzheimer disease.
Introduction
Alzheimer disease and type 2 diabetes mellitus are age-prevalent diseases that are associated with the deposition of proteinaceous amyloid proteins within the brain (amyloid β protein, Aβ) and pancreatic islet cells (islet amyloid polypeptide, amylin), respectively (1–4). Aβ and amylin also share biophysical and biochemical characteristics including a propensity to aggregate and form fibrillar structures composed of a core of β-pleated sheets (5). Furthermore, amylin inhibits self-association of Aβ into cytotoxic aggregates through direct amylin and Aβ interactions (6, 7). A recent proteomics study also indicates that Aβ1–42 and human amylin (hAmylin)2 share a common pathway for induction of toxicity via mitochondrial dysfunction (8). Also, evidence from pathophysiological, clinical, and epidemiological studies suggests that these two amyloidoses are linked to each other (9–11). In line with these findings, our studies on cultured human or rat fetal neurons, have shown that electrophysiological and neurotoxic actions of Αβ are strikingly similar to those for hAmylin and that such effects can be blocked by the amylin receptor antagonists AC253 and AC187 (12, 13). Additionally, we identified that down-regulation of the AMY3 isoform in neurons using shRNA can blunt the neurotoxic effects of Αβ (12). Collectively, these observations support the notion that Aβ and amylin share a common pathophysiological mechanism possibly via AMY3.
G protein-coupled receptors (GPCRs) constitute a superfamily of cell surface signaling proteins that mediates transduction of a large variety of extracellular stimuli across cell membranes and is involved in numerous key brain neurotransmitter systems, which may be disrupted in pathophysiological conditions such as Alzheimer disease (14). Amylin receptors belong to class B GPCRs and are heterodimeric complexes, formed by calcitonin receptor (CTR) association with receptor activity-modifying proteins (RAMPs) (15). The CTR component of this receptor shares the same general GPCR architecture: seven membrane-spanning interconnected α-helices that transmit extracellular signals to the intracellular cytoplasmic signaling cascade. Activation of amylin receptors in mammalian cells has been shown previously to raise cAMP and presumed to involve GS protein (Gs α-guanine nucleotide-binding signal transduction protein) and stimulation of adenylate cyclase (16, 17). Recent binding data indicate that amylin has a high affinity for the AMY3 isoform of amylin receptors (18). However, the precise intracellular signal transduction pathways following AMY3 activation are not fully understood, and it is not known whether Aβ directly activates AMY3. In the present study, we have for the first time expressed the AMY3 using human embryonic kidney 293 (HEK293) cells to study intracellular signal transduction pathways that are activated by Aβ or hAmylin and to further investigate whether their cytotoxic effects are mediated via this particular isoform of the amylin receptor.
EXPERIMENTAL PROCEDURES
AMY3 Gene Construction and Expression
AMY3 component gene cDNAs were purchased from Open Biosystems (Huntsville, AL): CTR (catalog no. MHS1010-98052186, gene access no. BC075028.2), RAMP3 (catalog no. MHS1010-9205630, gene access no. BC053852.1), RAMP1 (catalog no. MHS1011-59255, gene access no. BC000548.2), and RAMP2 (catalog no. MHS1010-7430169, gene access no. BC027975.1). CTR and RAMP3 genes were further subcloned in pcDNA3.1(+) (Invitrogen) and pBud-gfp vector (19), respectively. (The pBud-gfp vector was provided by Dr. David Westaway from University of Alberta.) The pBud-gfp-RAMP3 is a bigenic vector, which originally generated from the pBud CE4 vector and contained two distinct promoters upstream for GFP and RAMP3 genes. All of the CTR and RAMP3 gene sequences were confirmed by further DNA sequencing. HEK293 cells were cultured with DMEM (Invitrogen) with 10% FBS (Invitrogen) and grown at 37 °C, 5% CO2. An AMY3-expressing HEK293 (AMY3-HEK293) cell line was generated by co-transfecting pcDNA3-CTR with pBud-gfp-RAMP3 with a 1:1 molecule ratio using Lipofectamine 2000 transfection reagent (Invitrogen). For controls, AMY1 (CTR+RAMP1) and AMY2 (CTR+RAMP2) expressing cells were generated using similar procedures as above. The blank plasmid pcDNA3 and pBud-gfp also were transfected and generated GFP-positive control wild type HEK293 cells. ZeocinTM was used for stable cell line selection and maintenance (200 ng/ml of final concentration). Passages 5–15 of AMY3-HEK293 cells were used for all experiments.
Immunohistochemistry
For CTR expression, AMY3-HEK293 cells were plated on glass coverslips precoated with poly-l-ornithine (Sigma) in DMEM, 10% FBS, Zeocin medium for 12–24 h. Cells on coverslips were then fixed with 4% paraformaldyhyde and stained with a CTR antibody (12, 13, 20) (rabbit anti-CTR sera, provided by Dr. P. M. Sexton from Monash University, Victoria, Australia). The secondary antibody was Alexa Fluor 594 donkey anti-rabbit antibody (Invitrogen). Vectashield mounting medium with DAPI (Vector Laboratories Inc., Burlingame, CA) was used to mount slides and DAPI staining. For cAMP determination, mouse monoclonal anti-cAMP (R&D Systems, Minneapolis, MN) antibody was used as a primary antibody and Alexa Fluor 546 goat anti-mouse antibody (Invitrogen) as a secondary antibody. Photomicrographs were imaged using an Axioplan-2 fluorescent microscope with AxioVision software (Carl Zeiss, Toronto, Ontario).
RAMP Gene Expression
To further confirm AMY3 receptor expression, RT-PCR for RAMP1–3 expression was performed. Initially, RNA was extracted from AMY3-HEK293 and control HEK293 cells using a Qiagen RNeasy kit (Qiagen, Valencia, CA) and following the manufacturer's instructions. RNA samples (500 ng) were reverse-transcribed into cDNA by SuperScript II reverse transcriptase according to the manufacturer's protocol (Invitrogen). One microliter of cDNA was incubated in a 24-μl PCR reaction mix (SYBR PCR Mastermix, Qiagen). Primers for human RAMP1, RAMP2, RAMP3, and GAPDH (glyceraldehyde-3-phosphaate dehydrogenase) were purchased from Qiagen (catalog no. PPH02548A, PPH02591A, PPH02536B, and QT01192646, respectively.) Ten microliters of each PCR product were subjected to ethidium bromide gel electrophoresis, and photographs were taken under UV illumination by AlphaImager 2200 (Alpha Innotech, Toronto, Canada).
Quantitative cAMP Measurements
AMY3-HEK293 cells were plated on 24-well plates overnight. Cells were stimulated for 30 min with hAmylin, rat amylin (rAmylin), human calcitonin gene-related peptide, human adrenomedullin, Aβ1–42, and salmon calcitonin 8–32 over a concentration range (1 pm–1 μm). Cellular cAMP levels were measured using a parameter cyclic AMP assay kit (catalog no. KGE002B, R&D Systems) according to the manufacturer's instructions. Data were plotted, and nonlinear regression was fitted with four parameters using Prism software (version 5, GraphPad Software, La Jolla, CA).
Signal Profiling
Intracellular signaling profiles were determined using in-cell Western blot techniques. AMY3-HEK293 cells were seeded at 10,000 cells/well in a 96-well plate (Nalge Nunc Intl., Rochester, NY) in DMEM, 10% FBS, and Zeocin medium. After culturing for 12–16 h, cells were pretreated for 24 h either or not with AC253 (10 μm) and then treated with either hAmylin or Aβ1–42 in culture medium for time periods between 10 min and 30 h. Subsequently, cells were fixed with 4% paraformaldehyde for 20 min, permeabilized with 0.2% Triton X-100, blocked with Odyssey blocking buffer (LI-COR, Lincoln, NE), and stained with the following target antibodies. The phospho-p44/42 MAPK (ERK1/2, Thr-202/Tyr-204), phospho-Akt (Ser-473), and phospho-PKC (βII Ser-660) rabbit monoclonal antibodies were purchased from Cell Signaling, Inc. (Danvers, MA). The phospho-PKA R2 (S96) was purchased from Abcam, Inc. (Cambridge, MA), and the cFos rabbit polyclonal antibody was from Santa Cruz Biotechnology (Santa Cruz, CA). The secondary antibody was IRDye 800CW goat anti-rabbit antibody, whereas Sapphire700 and DRAQ5 were used for cell number normalization (LI-COR). For in-cell Western blot cyclic adenosine-monophosphate (cAMP) quantification, mouse monoclonal anti-cAMP (R&D Systems) was used as a primary antibody, and IRDye 700 goat anti mouse antibody (LI-COR) was used as a secondary antibody. Plates were imaged using an Odyssey Infrared Imaging System (LI-COR), and the integrated intensity was normalized to the total cell number on the same well.
Ca2+ Imaging
Dynamic changes of the free cytosolic Ca2+ concentration were monitored with confocal microscopy as described previously (21). For this, AMY3-HEK293 cells were plated on glass coverslips precoated with poly-l-ornithine and incubated at 37 °C for 12–36 h with DMEM, 10% FBS, and Zeocin medium. For Ca2+ imaging, superfusate of ion content similar to extracellular brain fluid thus containing the following: 130 mm NaCl, 4 mm KCl, 1 mm MgCl2, 2 mm CaCl2, 10 mm HEPES, and 10 mm glucose (pH 7.35) was applied at a rate of 3 ml/min using a roller pump (Watson-Marlow Alitea, Sin-Can, Calgary, AB, Canada). For zero calcium experiment, superfusate as described above except 5 mm, MgCl2 was used, and no calcium was added. For incubation with the membrane-permeant fluorescent Ca2+-sensitive dye Fluo-8L-AM (AAT Bioquest, Inc., Sunnyvale, CA), cells were washed twice with superfusate and then incubated with 5 μm of the agent for 40 min at room temperature (20–23 °C) within <2 h before imaging. Aβ1–42 and hAmylin were dissolved in sterile bidistilled water at 1 mm stock solution and incubated at room temperature for 10 min before dilution with superfusate for use at a final concentrations of 0.1–10 μm. Fluorescence intensity was monitored with a FV-300 laser-scanning confocal microscope (Olympus FV300, Markham, Ontario, Canada) equipped with an argon laser (488 nm) and excitation/emission filters (FF02-520/28-25; Semrock, Inc.) for an emission wavelength at 514 nm, measured with a numerical aperture of 0.95 20× XLUMPlanF1 objective (Olympus). Images were acquired at scan rates of 1.25–1.43 per second using a 2–3× digital zoom at full frame (512 × 512 pixel) resolution. Regions of interest were drawn around distinct cell bodies, and analysis of time courses of change in fluorescence intensity were generated with FluoView software (version 4.3; Olympus).
MTT Cell Death Assay
AMY3-HEK293 cells were seeded to 5000 cells/well in a 96-well plate in DMEM, 10% FBS, and Zeocin medium and incubated overnight. Cells in culture medium were preincubated for 24 h either with or without AC253, KH7 (selective soluble adenylyl cyclase inhibitor, R&D Systems), or FR180204 (selective ERK inhibitor, R&D Systems) and followed by treatment with either hAmylin, Aβ1–42, or Aβ42–1 for 24–48 h. At the end of treatment, 20 μl of 5 mg/ml methylthiazolyldiphenyl-tetrazolium bromide (MTT; Sigma) was added to each well and incubated at 37 °C for 3 h. Medium was removed, 100 μl of MTT solvent (isopropanol with 4 mm HCl) added to each well, and the plates were incubated for 30 min at room temperature on a rotating shaker. Plates were analyzed on a microplate reader at a 562-nm wavelength.
Drug Treatment
Cell dysfunction and cell death resulting from exposure to Aβ or hAmylin are mediated by soluble small or intermediate oligomers, whereas large, insoluble deposits might function as reservoirs of the bioactive oligomers (5, 22, 23). Soluble oligomeric Aβ1–42, the reverse non-functional sequence peptide Aβ42–1, hAmylin were used in the present study and were prepared here as per published protocols (12, 24). Human variants of CGRP and adrenomedullin), as well as rAmylin, and salmon calcitonin (8–32), which are also members of the same CGRP family, were used here for a comparison with the effects of Aβ1–42, Aβ42–1, hAmylin, and AC253. AC253 (LGRLSQELHRLQTYPRTNTGSNTY) is a polypeptide that is a potent amylin receptor antagonist similar to AC187 or salmon calcitonin (8–32), which also display antagonist activity at the amylin receptor (12, 13, 25). Aβ1–42 and Aβ42–1 were purchased from rPeptide (Bogart, GA), and hAmylin and AC253 were purchased from American Peptide (Sunnyvale, CA).
Statistical Analysis
Values are expressed as mean ± S.E. Statistical analysis was performed by one-way analysis of variance followed by Tukey's test when appropriate using Prism software. p < 0.05 was taken as significant.
RESULTS
Stable Expression of AMY3 in HEK293 Cells
We first generated the novel, AMY3-HEK293 stable cell line using co-transfection of the genes for the AMY3 constituents, CTR, and RAMP3 (Fig. 1a), in a 1:1 molecule ratio with the assumption of equal CTR and RAMP3 expression in individual cells. As an indication of RAMP3 expression, 60–70% of AMY3-HEK293 cells were GFP-positive 24 h following co-transfection, whereas >95% of cells were GFP-positive already after 3 passages with zeocin selection using 200 ng/ml. RT-PCR further confirmed RAMP3 gene expression in the AMY3-HEK293 cells. There is weak endogenous RAMP1 and RAMP2 gene expression in HEK293 cells that does not change after AMY3 expression. There is also little endogenous RAMP3 gene expression in HEK293 cells (Fig. 1b). Fig. 1c shows GFP-positive cells are all stained with CTR, which indicated successful AMY3 expression.
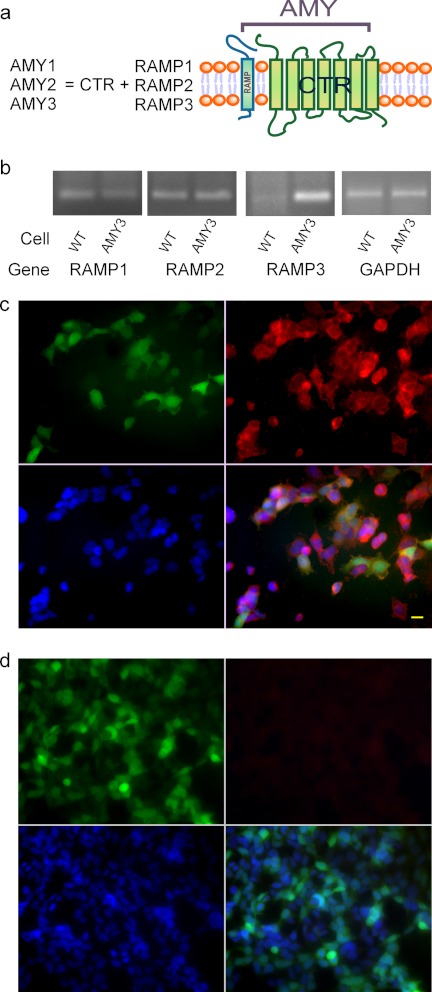
Stable expression of amylin-3 receptors (AMY3) in HEK293 cells. The AMY receptor structure is illustrated in the schema of a. b shows RT-PCR target RAMP1, RAMP2, and RAMP3 genes from wild type control HEK293-gfp cell (left) and AMY3-HEK293 cell (right). GAPDH is used as a loading control. c shows passage 5 AMY3-expressing cells stained with CTR antibody. Green fluorescent protein (GFP), which is produced from bigenic pBud-gfp vector and separately co-expressed with RAMP3 protein, indicates RAMP3 is expressed in these AMY3-HEK293 cells (upper left panel). AMY3-HEK293 cells in the same culture well expressing CTR are shown in the upper right panel. The lower left panel shows DAPI stain; merged image in lower right panel indicate that all cells are AMY3 positive HEK293 cells. Scale bar, 20 μm. d shows control HEK-gfp cells immunostained for CTR show no endogenous CTR expression in HEK293 cells (upper right panel). GFP (upper left panel) is derived from a blank pBud-gfp vector.
AMY3 Activation with Aβ1–42 and hAmylin Increases Cellular cAMP
As indication that the AMY3 is functional in the new cell line, we first identified that cAMP increases observed after 30 min of exposure to the established agonist for this receptor, hAmylin (1 μm), could also be evoked following application of Aβ1–42 (1 μm) (Fig. 2a). As expected, hAmylin and Aβ1–42 did not evoke cAMP increases in control wild type cells (Fig. 2b). There also was no significant increase in cAMP following exposure to hAmylin or Aβ1–42 in HEK293 cells that expressed single components of AMY3, i.e. either a functional CTR (supplemental Fig. 1) or RAMP3. Next, we quantified the effects of hAmylin (0.1–10 μm) on cAMP levels with in-cell Western blot. In fact, both agents increased cAMP in a very similar, concentration-dependent manner (Fig. 2c). In contrast, cAMP was not affected by Aβ42–1, human calcitonin gene-related peptide or human adrenomedullin (Fig. 2d). To further validate functional expression of AMY3 in the HEK cells, a cAMP assay over a full concentration range of the different peptides was performed. Aβ1–42, hAmylin, and rAmylin concentration-response curves were non-linearly fitted (Fig. 2e). The EC50 values for Aβ1–42, hAmylin, and rAmylin are 7.7, 2.4, and 6.9 nm, respectively.
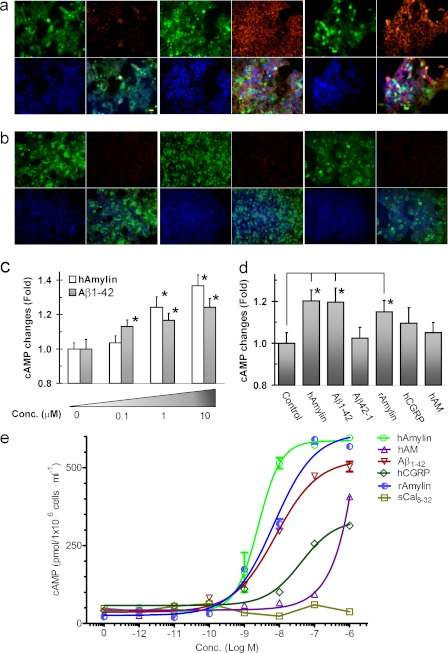
Aβ1–42 and hAmylin increase cellular levels of cyclic adenosine-monophosphate (cAMP) upon AMY3 activation. a, in unstimulated AMY3-HEK293 cells, cAMP levels are mostly very low (left panel; green, GFP; red, cAMP; and blue, DAPI. Scale bar, 20 μm). AMY3-expressing cells were activated after 30 min of incubation with 1 μm hAmylin (middle panel) and 1 μm Aβ1–42 (right panel). b, in control HEK-gfp cells, applications of either hAmylin (1 μm, middle panel) or Aβ1–42 (1 μm, right panel) did not induce increase of cAMP. c, shown is a quantification of cAMP changes using in-cell Western blot after 30-min applications of different concentrations of hAmylin and Aβ1–42. *, p < 0.05 compared with control (histograms on far left labeled 0). d, shown are histograms depicting cAMP increases in response to hAmylin, Aβ1–42, and rAmylin but not after exposure to human calcitonin gene-related peptide and human adrenomedullin (hAM; other members of the CTR family of peptides) or Aβ42–1 (inactive reverse sequence Aβ) (concentration (conc.) for all the peptides is 0.5 μm, n = 4). e, shown are changes in cAMP after exposure of AMY3-HEK293 cells to a full range and concentrations of different peptides derived from the calcitonin gene-related peptide family. The range of EC50 values for Aβ1–42, hAmylin, and rAmylin are 7.7 (6.3–9.6), 2.4 (1.7–3.6), and 6.9 (5.0–3.6) nm, respectively. Data were plotted and nonlinear regression fitted with four parameters using Prism software; data are from six wells at each concentration of the three peptides. sCal8–32, salmon calcitonin 8–32.
AMY3 Activation with Aβ1–42 and hAmylin Increases Cytosolic Ca2+
Confocal microscopy was used to investigate whether signaling pathways in AMY3 activation include the important intracellular second messenger Ca2+ (26). Under control conditions, fluorescence intensity in cells loaded with the fluorescent Ca2+ dye Fluo-8L-AM did not show notable spontaneous fluctuations of cytosolic Ca2+ (Fig. 3a). Bath application of hAmylin (0.1–2 μm) for 30 s produced a major Ca2+increase within <1 min after entry of the peptide within the imaging chamber. These Ca2+increases displayed a sharp peak, indicating that return to base line already started at the end of the application period of the peptide or within <30 s after start of return to control superfusate. Recovery to base line was achieved typically within <2 min after return to control perfusing solution (Fig. 3b). Also Aβ1–42 (0.1–2 μm) increased cytosolic Ca2+ in a fashion very similar to that observed for hAmylin (Fig. 3c). In contrast, Ca2+ did not rise in response to hAmylin (0.5 μm, 30 s) following superfusion of cells with AC253 (2 μm) for 30 s prior to application of the agent, whereas AC253 alone (1–10 μm) also did not change Ca2+ base line (Fig. 3, e and f). Similarly, the Ca2+ increase due to Aβ1–42 (0.5 μm, 30 s) was abolished by preincubation of AC253 (2 μm) (Fig. 3g). Co-application of Aβ1–42 (0.25 μm) with hAmylin (0.25 μm) elevated Ca2+ levels to a similar extent as when each drug was applied alone, and this response to a combined application of the two peptides also was abolished by 2 μm AC253 (Fig. 3, d and h). Bar graphs in Fig. 3i show quantification of these data. Fig. 3j and the accompanying videos (supplemental data) show time-lapsed recordings of Ca2+ signals from the same AMY3-HEK293 cell in response to hAmylin, Aβ1–42, hAmylin+Aβ1–42, AC253, AC253+hAmylin+Aβ1–42, and recovery. In wild type (non-transfected) HEK293 cells, Aβ1–42 or hAmylin did not induce increases in cytosolic Ca2+ (data not shown). Increases in cytosolic Ca2+ levels after AMY3 activation with hAmylin and Aβ1–42 mainly depend on extracellular calcium. In the presence of calcium-free superperfusate, hAmylin and Aβ1–42 only produced small and delayed cytosolic Ca2+ increases (~20% of peak increases of cytosolic Ca2+ under normal calcium concentration, Fig. 4).
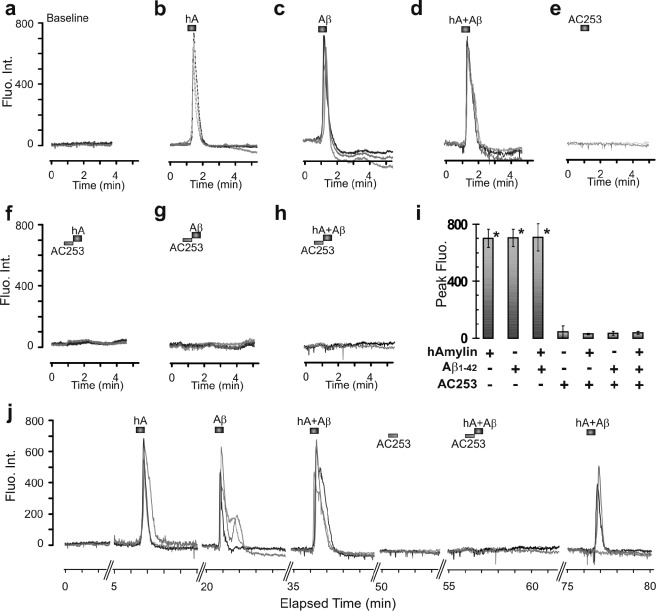
Aβ1–42 and hAmylin increase fluorometrically measured Ca2+ upon AMY3 activation. Shown are sample traces showing Fluo-8 fluorescence intensity (Fluo. Int.), indicated in arbitrary units, from three AMY3-HEK293 cells. a, base-line Ca2+, as indicated by a low intensity of Fluo-8 fluorescence, was stable in control superfusate. b, sharp increase in Ca2+ level within 1 min of bath-applied hAmylin (0.5 μm, 30 s), which returns to base-line level within 2 min after perfusion with control solution. c and d, similar Ca2+ rises were seen upon application of Aβ1–42 (0.5 μm, 30 s) and co-application of hAmylin and Aβ1–42 (0.25 μm, 30 s). e, application of the amylin receptor antagonist AC253 (2 μm) did not affect Ca2+ base line but prevented Ca2+ increases in response to hAmylin (hA; f), Aβ1–42 (g), or combined application of the agents (h). i, summary of Ca2+ effects (*, p < 0.05, n = 27 cells in four culture wells from different experiments) compared with base-line Fluo-8 fluorescence (fluo.) for the different treatment groups. j, shows Ca2+ changes with elapsed time in the same set of AMY3-HEK293 cells treated with 30-s bath applications of hAmylin (0.5 μm), Aβ1–42 (0.5 μm), or combined application of the agents (0.25 μm each) applied individually and then in the presence of amylin receptor antagonist AC253 (2 μm).
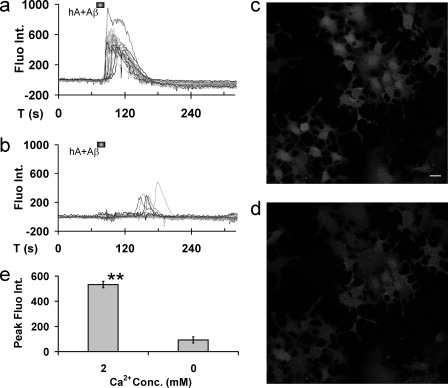
Effects of extracellular Ca2+ concentration (conc.) on cytosolic Ca2+ changes uponAMY3 activation. a and b, sample traces showing changes in Fluo-8 fluorescence intensity (Fluo. Int.), indicated in arbitrary units, from AMY3-HEK293 cells after 30 s bath application of combined hAmylin (hA) and Aβ1–42 (0.25 μm each) in normal calcium superfusate (a; 2 mm Ca2+) and application of hAmylin and Aβ1–42 (0.25 μm each, 30 s) in superperfusate that is calcium-free (b). c and d, imaging of peak increase in Ca2+ following exposure to hAmylin and Aβ1–42 in superfusate containing either normal calcium level (c) or that is calcium-free (d). e, comparison of cytosolic Ca2+ changes after application of hAmylin and Aβ1–42 under normal and zero calcium superfusate. (**, p < 0.01, n = 24 cells). Scale bar for c and d, 20 μm.
Signaling Pathways Involved in Aβ1–42 Activation of AMY3
In addition to their effects on cAMP and Ca2+, we found here that Aβ1–42 and hAmylin also increase phosphorylation of the type II subunit of cAMP-dependent protein kinase A (PKA R2) (Fig. 5a), activate mitogen-activated protein kinase (ERK1/2) (Fig. 5b), increase cellular levels of the transcription factor cFos (Fig. 5c), and increase phosphorylation of Akt (protein kinase B (pAkt)) (Fig. 5d). All of these effects were blocked by AC253 (Fig. 5, a–d) and not mimicked by Aβ42–1 (data not shown). In another series of experiments, phosphorylation of protein kinase C was not observed to change with exposure to either Aβ1–42 or hAmylin (data not shown).
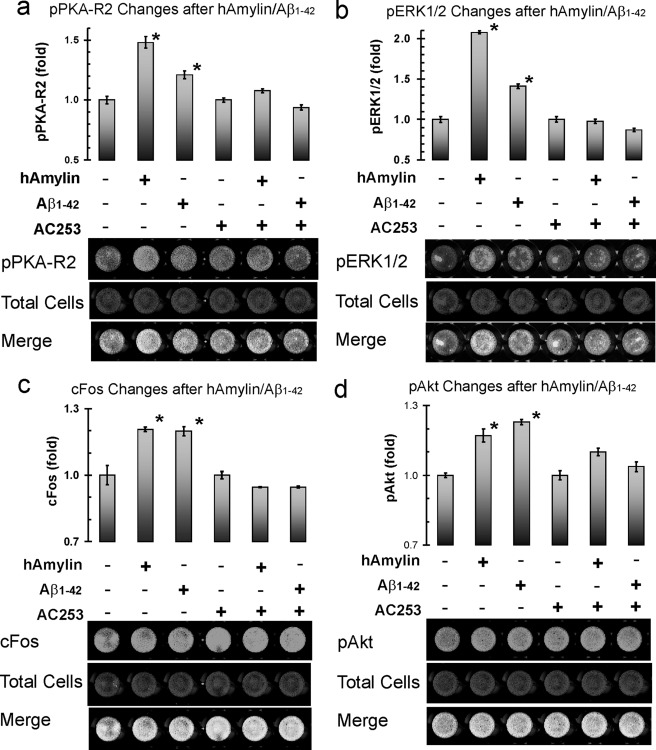
Aβ1–42 and hAmylin activate AMY3 and trigger multiple signaling pathways. Using in-cell Western blot, 15-min applications of hAmylin (0.5 μm), Aβ1–42 (0.5 μm), or both hAmylin and Aβ1–42 stimulate phosphorylation of the type II subunit of cAMP-dependent protein kinase A (PKA R2), which is blocked by AC253. b–d show activation of mitogen-activated protein kinase (ERK1/2), cellular transcription factor cFos, and phosphorylated Akt following application of hAmylin and Aβ1–42 individually or in combination and in the presence of AC253. (n = 4; *, p < 0.05 compared with control group). *, p < 0.05 compared to 0 time point.
In a further set of experiments, we elucidated that phosphorylation of ERK1/2 or PKA depends on the duration of exposure to hAmylin or Aβ1–42. The phosphoERK1/2 peak is reached ~10 min after start of application and returns to base-line level within 0.5 h (or slightly more or less) after exposure to either hAmylin (0.2 μm) or Aβ1–42 (0.5 μm) (Fig. 6a). The phospho-PKA R2 also reaches a maximum level at ~10 min, but the phosphorylated form of this protein lasts longer and returns to base-line level at 2 h (or slightly more or less) for Aβ and hAmylin (Fig. 6b).
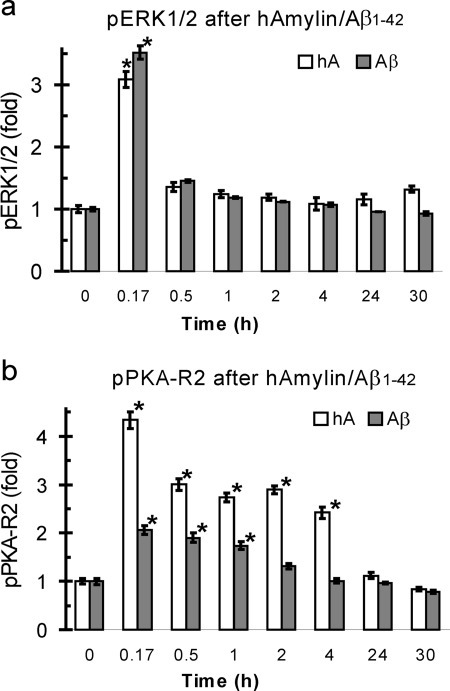
AMY3-related signaling depends on hAmylin and Aβ1–42 application time. a, after exposure to either hAmylin (hA; 0.2 μm) or Aβ1–42 (0.5 μm), phosphoERK1/2 levels peak within 10 min and return to base-line level after 0.5~1 h. b, maximum phosphoPKA R2 increase is also reached within ~10 min, but the phosphorylation lasts longer and returns to base line only after 4–24 h. * p < 0.05, compared to 0 time point.
Aβ1–42 Activation of AMY3 Triggers Cell Death at Higher Concentrations and Longer Exposure Times
Our previous observations that Αβ1–42 and hAmylin induce apoptotic cell death in cultured neurons suggested that these effects may require AMY3 activation (12, 13). This hypothesis is supported by our present findings using an MTT assay that 48 h incubation with either Aβ1–42 (2–20 μm) or hAmylin (0.2–2 μm) causes cell death of AMY3-HEK293 cells in a concentration-dependent manner (Fig. 7a). Next, we confirmed that hAmylin and Aβ1–42 induced cell death is dependent on AMY3 expression. In cells expressing other amylin receptor subtypes (AMY1 or AMY2, supplemental Fig. 2) or single components of AMY3 (CTR or RAMP3), hAmylin, and Aβ1–42 did not induce significant cell death (Fig. 7b). The cell death observed when AMY3-HEK cells were exposed to hAmylin or Aβ1–42 occurred after 24 h (Fig. 7c). Furthermore, cell death induced from hAmylin and Aβ1–42 is attenuated significantly by pretreatment with AC253 (Fig. 7d). Interference with downstream mediators of AMY3 activation using KH7 (adenylate cyclase inhibitor) or FR180204 (an ERK1/2 inhibitor) also protected AMY3 cells from hAmylin or Aβ1–42 cytotoxicity (Fig. 7d).
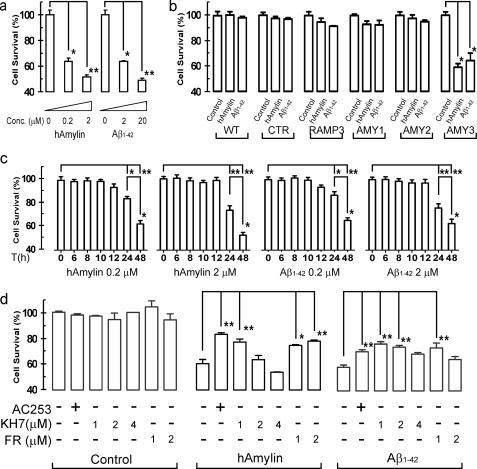
Aβ1–42 and hAmylin activation of AMY3 triggers cell death in a concentration- and time dependent manner. a, using an MTT assay, hAmylin and Aβ1–42 induced cell death in a concentration (conc.)-dependent manner (n = 4 for each treatment group). b, unlike AMY3-HEK cells, hAmylin and Aβ1–42 (1 μm 48 h) did not induce significant cell death in control HEK-gfp cells, cells expressing single AMY3 receptor components (CTR or RAMP3), or other amylin receptor subtypes (AMY1 or AMY2) (n = 8 for each). c shows cell death occurred after 24 h when AMY3-HEK cells were exposed to either hAmylin or Aβ1–42 (0.2 and 2 μm). d shows cell survival after 48 h exposure to hAmylin or Aβ1–42 (1 μm) and following preincubation with AC253 (2.5 μm), KH7 (1, 2, and 4 μm), or FR180204 (FR; 1 and 2 μm) for 12 h, (n = 8 for each treatment group). *, p < 0.05; **, p < 0.01, one-way analysis of variance followed by Tukey's test.
DISCUSSION
Our data demonstrate that both Aβ1–42 and hAmylin act as agonists at the AMY3 subtype that has been expressed here for the first time using HEK293 cells. Amylin receptors are heterodimerized by CTR and one of three RAMPs, thus generating multiple amylin receptor subtypes, AMY1–3 (Fig. 1a) (15). There are several CTR isoforms in the human (27). In this study, hCTRa was used for AMY3 receptor construction, which is insert-negative and modulates cell cycle progression (28). The importance of receptor splice variation in AMY physiology remains to be elucidated. These amylin receptor subtypes are pharmacologically distinct and demonstrate different binding affinities to members of the calcitonin peptide family, which includes CGRP, adrenomedullin, and amylin (15). However, due to the lack of selective pharmacological tools, significant complexity of this system and lack of specific RAMP antibodies, it has been difficult to confidently assign specific amylin functions to one of these receptor subtypes. Data from functional bioassays, including binding studies (16, 29, 30), demonstrate that AMY3, which is a heterodimeric complex of CTR and RAMP3, has a high affinity for amylin. Amylin receptor components (CTR and RAMPs) are reported to be distributed widely in the central nervous system with pronounced expression within spinal cord, brain stem, cortex, hypothalamus, and hippocampus (31, 32). However, data on distribution of specific subtypes of RAMPs within the CNS is lacking. Moreover, at present, there is no information on the functional effects of co-localization of CTR with RAMP3 to generate AMY3. Herein, we provide evidence that the AMY3 subtype is indeed the specific target receptor for direct actions of Aβ (and hAmylin) at the level of the cellular membrane.
For the cAMP production assay, the mean EC50 for hAmylin (2.4 nm) in our AMY3 cell line is close to a previous reported value for rAmylin (18). We have identified that AMY3 activation results in Gαs-mediated adenylate cyclase activation, with a subsequent increase in cAMP and activation of PKA. This occurred in a manner similar to that reported for the CGRP receptor, which is also a member of the same family of CTR (33). PKA is a multiunit protein kinase that mediates signal transduction of GPCRs following their activation by adenyl cyclase-mediated cAMP formation and is involved in a wide range of cellular processes. PKA R2 is one of the regulatory isoforms of the enzyme, which is predominantly expressed in adipose tissue and brain (34). Nearly all PKA activity in adipose tissue and 50% of PKA activity in the striatum, hypothalamus, and cortex is attributed to the subunit. Disruption of PKA R2 affects physiological mechanisms known to be associated with healthy aging in mammals, which include increased lifespan and decreased incidence and severity of a number of age-related diseases in PKA R2 null mice. In that context, our data further indicate that PKA R2 is secondarily activated after Aβ or hAmylin stimulation of AMY3 and that such an effect may contribute to the long term deleterious neuronal actions of Aβ or amylin as indicated by the present findings of increased cell death of AMY3-HEK293 cells exposed to these peptides.
The increases in cytosolic Ca2+ observed here following hAmylin or Aβ1–42 application could also occur via Gαq activation. Gαq proteins activate phospholipase C, which cleaves phosphatidylinositol-4,5-bisphosphate into diacyl-glycerol and inositol trisphosphate, leading to mobilization of Ca2+ from cellular stores (35). Ca2+ represents a ubiquitous intracellular second messenger with enormous versatility (26). The versatility of Ca2+ as a signaling molecule is based on its binding kinetics, varying amplitude, spatiotemporal distribution, and ability to cross-talk with multiple other signaling cascades within the GPCR-activated pathways, including ERK and Akt. The Akt serine/threonine kinase (also called protein kinase B) has emerged as a critical signaling molecule within eukaryotic cells and regulates diverse aspects of neuronal cell function protein translation and cell size, axonal outgrowth, suppression of apoptosis, and synaptic plasticity. Akt activation could result from activation of phosphatidylinositol 3-kinase (PI3K) or Gαq activation.
Inhibition of adenylyl cyclase at a lower concentrations of KH7 (1–2 μm) can protect AMY3 cells from hAmylin and Aβ1–42 damage. However, at higher concentrations (4 μm), KH7 did not demonstrate a protective effect, which could be related to interruption of normal cellular function at such concentrations. Altering activity of adenyl cyclase results in changes in cAMP second messenger levels, which in turn affects PKA and protein phosphatase A activity. Protein phosphatase A is inhibited by increased PKA activity, thus maintaining Akt in an activated state (36). Both hAmylin and Aβ1–42 activate Akt, which indicates that AMY3 may play also an important role in controlling cell fate. Most likely, changes in Akt activity that we observed are secondary to alterations in cAMP and PKA that result from AMY3 activation. The rapid Ca2+ increase associated with AMY3 activation could also contribute to Akt activation.
ERK1/2 is a member of the mitogen-activated protein kinase family that is centrally involved in many processes during the lifetime of a cell. This kinase has been not only associated with proliferation, differentiation, and protection against apoptosis but also has been linked to cell death (37). A selective ERK1/2 inhibitor, FR180204, can protect AMY3 against hAmylin or Aβ1–42 toxicity, but this protective effect does not appear to be concentration dependent. The magnitude and the duration of ERK1/2 activity may determine its role in regulating different aspects of cellular function. Following AMY3 activation, temporal changes in ERK1/2 phosphorylation followed alterations in cAMP and PKA activity. At early stages or with short term activation, ERK1/2 is associated with cell proliferation, regulation of cellular function, and increases in the transcription factor, cFos. However, after longer periods of activation, ERK1/2 appears to trigger cell death pathways, an observation that seems consistent with our finding of phosphorylation of this kinase and the resultant cell death as shown by our MTT assay data.
In conclusion, we provide for the first time evidence that Aβ1–42 directly activates AMY3 and triggers several intracellular signaling pathways, including cytosolic cAMP and Ca2+ rises. AMY3 likely regulates cellular functions by changing activity of PKA, ERK1/2, and Akt. The sustained activation of AMY3 triggers phosphorylation of ERK1/2 resulting in cell death. Putative uncontrolled elevations of cytosolic Ca2+ as a result of prolonged AMY3 activation may also perturb homeostasis of the endoplasmic reticulum, produce mitochondrial dysregulation and engagement of caspases that contribute to apoptosis. The possible pathophysiological mechanisms whereby Aβ1–42 activates AMY3 and triggers multiple signaling pathways are illustrated in Fig. 8. Our data suggest the AMY3 is receptor target for the actions of human amylin and Aβ and may play an important role in pathogenesis of conditions, where these amyloidogenic proteins have been implicated, namely type 2 diabetes mellitus and Alzheimer disease. Thus, it may be possible, for example, to develop novel therapies for Alzheimer disease by altering AMY3 function or its downstream signaling pathways through the design of highly selective antagonists for this isoform of amylin receptor family.
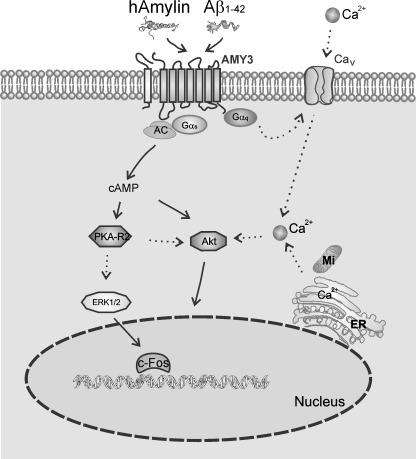
Aβ1–42-activated cellular signaling pathways and AMY3 role in AD. AMY3 is a multimeric complex formed by CTR and RAMP3 (see also Fig. 1a). Direct activation of AMY3 with hAmylin and Aβ1–42 results in Gαs-mediated adenylate cyclase (AC) stimulation, with subsequent increase in cellular cAMP, stimulation of PKA R2, downstream activation of ERK1/2, and an increase transcription factor cFos expression. The observed cytosolic Ca2+ rise could be due to Gαq activation. Akt is also activated followed cAMP and PKA activation. The cytosolic Ca2+ changes could also contribute to Akt activation. Long term AMY3 activation could trigger an ERK1/2 pathway that may cause Ca2+ imbalance and perturb homeostasis of the endoplasmic reticulum (ER), leading to cell death. MI, mitochondria.
Acknowledgments
We thank The Pulmonary Research Group and Chris Laurent (University of Alberta) for access to ICW instrumentation and technical assistance with experiments utilizing this technique. We thank Dr. Khem Jhamandas for useful comments and suggestions on the manuscript.
*This work was supported by Canadian Institutes of Health Research Grant CIHR MOP 93601 (to J. H. J.), the Canada Foundation of Innovation, and a scientist award from the Alberta-Heritage Foundation for Medical Research (to K. B.).
 This article contains supplemental Figs. 1 and 2 and Videos 1–7.
2The abbreviations used are:
- hAmylin
- human amylin
- AMY3
- amylin receptor-3
- rAmylin
- rat amylin
- CGRP
- calcitonin gene-related peptide
- CTR
- calcitonin receptor
- GPCR
- G protein-coupled receptor
- MTT
- Thazoalyl blue tetrazolium bromide
- PKA R2
- type II subunit of cyclic AMP-dependent protein kinase A
- PKA
- protein kinase A
- RAMP
- receptor activity modifying protein.
REFERENCES
Articles from The Journal of Biological Chemistry are provided here courtesy of American Society for Biochemistry and Molecular Biology
Full text links
Read article at publisher's site: https://doi.org/10.1074/jbc.m111.331181
Read article for free, from open access legal sources, via Unpaywall:
http://www.jbc.org/content/287/22/18820.full.pdf
Citations & impact
Impact metrics
Citations of article over time
Alternative metrics
Article citations
Neurotoxic β-amyloid oligomers cause mitochondrial dysfunction-the trigger for PANoptosis in neurons.
Front Aging Neurosci, 16:1400544, 14 May 2024
Cited by: 1 article | PMID: 38808033 | PMCID: PMC11130508
Review Free full text in Europe PMC
Tat-CIAPIN1 Prevents Pancreatic β-Cell Death in hIAPP-Induced RINm5F Cells and T2DM Animal Model.
Int J Mol Sci, 24(13):10478, 22 Jun 2023
Cited by: 1 article | PMID: 37445656 | PMCID: PMC10342139
Biological Mechanism-based Neurology and Psychiatry: A BACE1/2 and Downstream Pathway Model.
Curr Neuropharmacol, 21(1):31-53, 01 Jan 2023
Cited by: 2 articles | PMID: 34852743 | PMCID: PMC10193755
Review Free full text in Europe PMC
Cinnamaldehyde Regulates Insulin and Caspase-3 Signaling Pathways in the Sporadic Alzheimer's Disease Model: Involvement of Hippocampal Function via IRS-1, Akt, and GSK-3β Phosphorylation.
J Mol Neurosci, 72(11):2273-2291, 10 Oct 2022
Cited by: 4 articles | PMID: 36210429
Amylin and Secretases in the Pathology and Treatment of Alzheimer's Disease.
Biomolecules, 12(7):996, 17 Jul 2022
Cited by: 3 articles | PMID: 35883551 | PMCID: PMC9312829
Review Free full text in Europe PMC
Go to all (66) article citations
Data
Similar Articles
To arrive at the top five similar articles we use a word-weighted algorithm to compare words from the Title and Abstract of each citation.
Role of microglial amylin receptors in mediating beta amyloid (Aβ)-induced inflammation.
J Neuroinflammation, 14(1):199, 06 Oct 2017
Cited by: 26 articles | PMID: 28985759 | PMCID: PMC5639602
Activity of pramlintide, rat and human amylin but not Aβ1-42 at human amylin receptors.
Endocrinology, 155(1):21-26, 20 Dec 2013
Cited by: 36 articles | PMID: 24169554
Role of amylin and its receptors in neurodegeneration.
Curr Protein Pept Sci, 14(4):338-345, 01 Jun 2013
Cited by: 2 articles | PMID: 23745698
Review
β-Amyloid protein (Aβ) and human amylin regulation of apoptotic genes occurs through the amylin receptor.
Apoptosis, 17(1):37-47, 01 Jan 2012
Cited by: 29 articles | PMID: 21947943
Funding
Funders who supported this work.
Canadian Institutes of Health Research (1)
Grant ID: MOP 93601


