Abstract
Free full text

The mutant p53‐ID4 complex controls VEGFA isoforms by recruiting lncRNA MALAT1
Abstract
The abundant, nuclear‐retained, metastasis‐associated lung adenocarcinoma transcript 1 (MALAT1) has been associated with a poorly differentiated and aggressive phenotype of mammary carcinomas. This long non‐coding RNA (lncRNA) localizes to nuclear speckles, where it interacts with a subset of splicing factors and modulates their activity. In this study, we demonstrate that oncogenic splicing factor SRSF1 bridges MALAT1 to mutant p53 and ID4 proteins in breast cancer cells. Mutant p53 and ID4 delocalize MALAT1 from nuclear speckles and favor its association with chromatin. This enables aberrant recruitment of MALAT1 on VEGFA pre‐mRNA and modulation of VEGFA isoforms expression. Interestingly, VEGFA‐dependent expression signatures associate with ID4 expression specifically in basal‐like breast cancers carrying TP53 mutations. Our results highlight a key role for MALAT1 in control of VEGFA isoforms expression in breast cancer cells expressing gain‐of‐function mutant p53 and ID4 proteins.
Introduction
The eukaryotic genome harbors a large number of non‐coding RNAs, which include small and long non‐coding RNAs (lncRNAs). The nuclear‐retained Metastasis‐Associated Lung Adenocarcinoma Transcript 1 (MALAT1), also known as Nuclear‐Enriched Abundant Transcript 2 (NEAT2), is one of the most abundant and highly conserved lncRNAs and is overexpressed in several cancers; its elevated expression has been associated with hyperproliferation, metastasis, and poor prognosis 1, 2, 3, 4, 5. 3′‐end processing of MALAT1 has been shown to yield a tRNA‐like cytoplasmic RNA 6, 7. MALAT1 localizes to nuclear speckles, a subnuclear domain suggested to coordinate RNA polymerase II transcription, pre‐mRNA splicing, and mRNA export 8, 9, 10, 11. MALAT1 interacts with several pre‐mRNA splicing factors 12, 13, 14 including serine–arginine dipeptide‐rich SR‐family splicing factors such as SRSF1 (also known as ASF/SF2), SC35 (SRSF2), and SRSF3. This lncRNA has been shown to induce the expression of cell cycle genes and to control alternative splicing of pre‐mRNAs by modulating the intranuclear distribution of SR splicing factors 15, 16. Interestingly, knockdown of MALAT1 has no impact on the formation, size, and number of nuclear speckles, whereas it does result in a decreased nuclear speckle association of several pre‐mRNA splicing factors, including SRSF1 10, 17, 18.
SRSF1, a prototype member of the SR protein family mostly recruited to exonic splicing enhancers (ESEs), is a multifunctional RNA‐binding protein with roles in pre‐mRNA constitutive and alternative splicing, mRNA export, and mRNA translation; it was identified as an oncogene due to its transforming capacity in vitro and in vivo 19, 20, 21, 22, 23. Activity of SRSF1 is crucial for alternative splicing control of the terminal exon of the VEGFA gene, a major determinant in tumor neoangiogenesis 24. Two families of VEGFA isoforms are indeed generated by alternate splice‐site selection in the gene's terminal exon, exon 8. Proximal splice‐site selection (PSS) in exon 8 results in pro‐angiogenic VEGFAxxx isoforms (xxx is the number of amino acids), whereas distal splice‐site selection (DSS) results in anti‐angiogenic VEGFAxxxb isoforms 25, 26, 27, 28, 29. SRSF1 has been shown to favor PSS selection in exon 8 during VEGFA pre‐mRNA splicing 26. The anti‐angiogenic VEGFAxxxb isoform is downregulated in several epithelial cancer types and in other pathologies associated with abnormal neovascularization 30, 31, 32. VEGFA165b inhibits VEGFR2 signaling by inducing differential phosphorylation, and it can be used to block angiogenesis in in vivo models of tumorigenesis. Recombinant human VEGFA165b (rhVEGFA165b) treatment in vivo also has a growth‐inhibitory effect in nude mice xenograft models of various tumors 33, 34, 35, 36. VEGFA165 and VEGFA121 are among the most abundant pro‐angiogenic VEGFA isoforms in cancer cells and have been very recently shown to exert opposite effects on the growth and invasion of tumor cells in vivo 37.
We previously characterized a molecular network whereby gain‐of‐function mutant p53 (mtp53) proteins are responsible for induction of the ID4 protein in breast cancer 38. Mtp53 proteins are peculiarly characterized by a prolonged half‐life compared with that of the wt‐p53 protein, and many mtp53 proteins show the inability to recognize wt‐p53 DNA‐binding sites. Many of these mtp53 proteins presenting high levels of expression in cancer cells have been also demonstrated to have various oncogenic properties 39, 40, 41; many mtp53 proteins have indeed been shown to present gain‐of‐function (GOF) activity, positively contributing to tumorigenesis in vivo and conferring increased aggressiveness phenotype to cell lines in vitro 42.
ID4 protein expression is enriched in breast cancer tissues exhibiting p53 overexpression (indicating the presence of a TP53 gene mutation). The net biological output of the transcriptional activation of the ID4 gene by mutant p53 is the increase in the angiogenic potential of mutant p53‐carrying tumor cells. Despite the absence of an RNA‐binding domain in its protein sequence, ID4 protein has been shown to interact, probably indirectly, with the mRNAs of pro‐angiogenic factors and to increase their stability and rate of translation 38, 43. Accordingly, high ID4 protein expression is associated with high microvessel density in breast cancer 38. Several studies have shown that high ID4 mRNA and protein expressions are associated with the highly aggressive basal‐like subtype of breast cancer (BLBC), characterized by a substantially high incidence of TP53 gene mutations (nearly 80%), expression of basal cytokeratins, and absence of estrogen, progesterone, and ERBB2 receptors 44, 45, 46, 47. High ID4 expression in BLBC has been related to poor disease‐free and overall survival 47, 48. A recent study showed that ID4 is a key regulator of mammary stem cell self‐renewal and marks a subset of BLBC with a putative mammary basal cell origin 48.
The present study aimed to identify mediators of ID4‐associated pro‐angiogenic activity in breast cancer. We report the identification of a quaternary ribonucleoprotein (RNP) complex comprising the MALAT1 lncRNA and the SRSF1 oncogenic splicing factor, as well as mutant p53 and ID4 proteins. This RNP complex is recruited on VEGFA pre‐mRNA, where it inhibits the synthesis of anti‐angiogenic VEGFAxxxb isoforms. Accordingly, the depletion of MALAT1 or of any of the protein components of this RNP complex leads to a reduction in the angiogenic potential of breast cancer cells. Moreover, High ID4 expression is associated with an enriched VEGFA‐activity expression signature specifically in mutant p53‐carrying basal‐like breast cancer.
Results
Splicing factor SRSF1 stabilizes the binding of ID4 and mutant p53 proteins to lncRNA MALAT1 in breast cancer cells
We previously showed that mutant p53 proteins induce ID4 expression in breast cancer cells. ID4 protein is able to bind to the mRNAs encoding pro‐angiogenic cytokines and favors their translation, resulting in enhanced neoangiogenesis 38, 43.
To identify additional mediators of angiogenesis controlled by ID4, we performed a RIP‐chip analysis (Ribonucleoprotein ImmunoPrecipitation followed by microarray analysis) in MDA‐MB‐468 breast cancer cells, which led to the identification of a panel of RNAs bound by ID4 (Appendix Tables S1 and S2). Interestingly, among ID4‐targeted RNAs, we identified MALAT1, a long non‐coding RNA (lncRNA) that has been reported to modulate activity of serine/arginine‐rich (SR) proteins in the nucleus. SR proteins and heterogeneous nuclear ribonucleoproteins (hnRNPs) are the major classes of splicing factors that select splice sites for recognition by the spliceosome through binding to intronic or exonic splice elements. The expression of specific isoforms of VEGFA, a major player in tumor angiogenesis, depends on the SR‐family protein SRSF1, whose activity is in turn controlled by MALAT1; for this reason, we explored the possibility that ID4 controls VEGFA expression by modulating MALAT1 and SRSF1 activities.
Using native lysates from different breast cancer cell lines, we confirmed by RIP assays that ID4 binds to MALAT1 (Fig (Fig1A1A and B, and Appendix Fig S1A). Interaction between ID4 protein and MALAT1 lncRNA was also confirmed by RIP assay in MDA‐MB‐468 cells overexpressing HA‐tagged ID4 protein (Appendix Fig S1B). Interestingly, we observed that also the mutant p53 (mtp53) proteins p53R175H (endogenously expressed in SKBR3 cells) and p53R273H (endogenously expressed in MDA‐MB‐468 and OVCAR‐3 cells) are able to bind to this lncRNA (Figs (Figs1C1C and EV1A). Combined immunofluorescence for p53 and RNA FISH for MALAT1 showed colocalization of mtp53 protein and MALAT1 in MDA‐MB‐468 and SKBR3 cells (Figs (Figs1D1D and E, and EV1B).
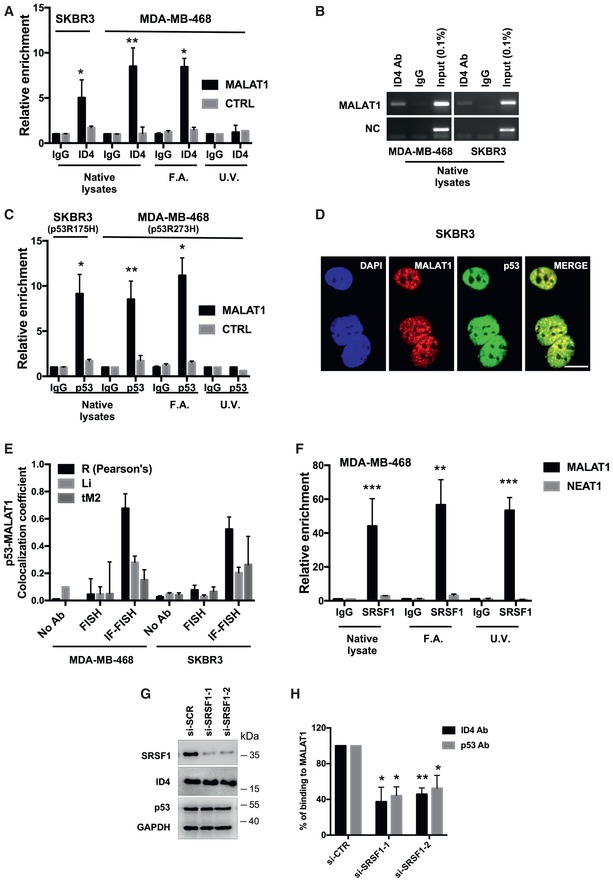
- A–C RIP (Ribonucleoprotein ImmunoPrecipitation) assays performed in SKBR3 and MDA‐MB‐468 breast cancer cells using antibodies directed to ID4 or p53. IgG was used as negative control. Native lysates or lysates from cells crosslinked with formaldehyde (F.A.) or UV light were employed. RT–qPCR of MALAT1 RNA and control mRNAs (GAPDH, RPL19) is shown. Relative enrichment represents enrichment of each transcript in ID4‐IP or p53‐IP over control IgG‐IP sample.
- D Fluorescence high‐resolution images of fixed cells, labeled with DAPI (cell nuclei), Alexa Fluor 488 (p53 protein), and Quasar 570 (MALAT1 RNA). Merged images of Alexa Fluor 488 and Quasar 570 signals are shown. Scale bars, 10 μm.
- E Pearson's correlation coefficient R, Manders correlation coefficient M2 (tM2), and Li intensity correlation quotient ICQ (Li) were considered to estimate colocalization between p53 protein and MALAT1 RNA from combined immunofluorescence–RNA FISH assays in the indicated cell lines.
- F RIP assays performed in MDA‐MB‐468 cells using an antibody directed to SRSF1 (A96, Santa Cruz). MALAT1 and NEAT1 (negative control) RNA abundance was evaluated by RT–qPCR.
- G, H RIP assays of ID4 and p53 performed in MDA‐MB‐468 cells depleted or not of SRSF1 expression using two siRNAs. SRSF1, ID4, p53 proteins, and MALAT1 RNA levels following siRNA transfection are shown in (G).
Data information: Data are presented as mean ± SEM. *P ≤ 0.05, **P ≤ 0.005, ***P ≤ 0.0005 (two‐tailed Student's t‐test). Results from at least three biological replicates are shown.Source data are available online for this figure.
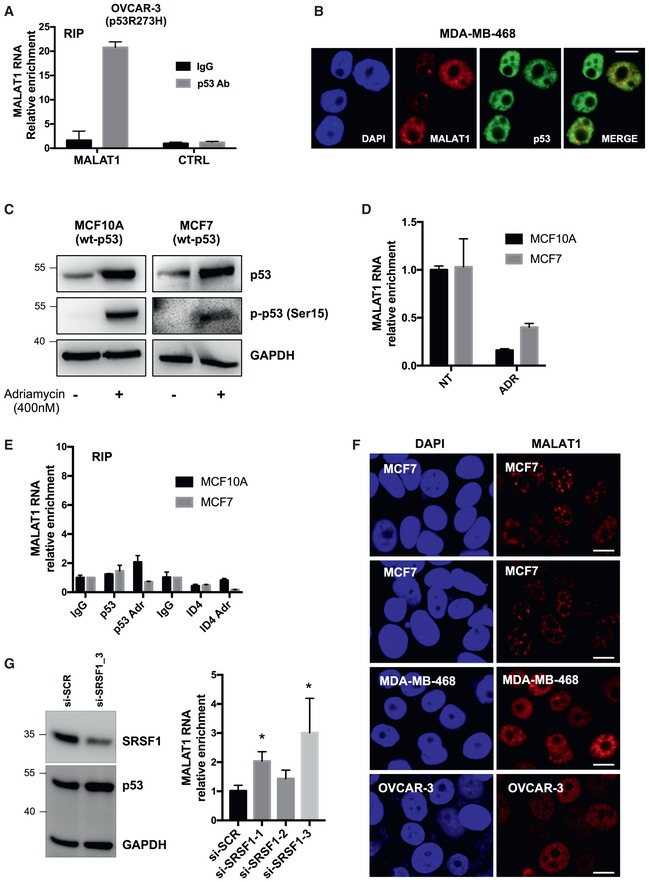
RIP assays performed in OVCAR‐3 cells using an antibody directed to p53. Relative enrichment is calculated as folds over IgG sample, normalized on RPL19 mRNA level. Data are presented as mean ± SEM. Results from three biological replicates are shown.
Fluorescence high‐resolution images of fixed cells, labeled with DAPI (cell nuclei), Alexa Fluor 488 (p53 protein), and Quasar 570 (MALAT1 RNA). Merged images of Alexa Fluor 488 and Quasar 570 signals are shown. Scale bars, 10 μm.
Western blot analysis of wt‐p53 and its phosphorylated form p‐p53‐Ser15 in the indicated cell lines with or without 8 h treatment with 400 nM adriamycin.
RT–qPCR analysis of MALAT1 RNA level in MCF10A and MCF7 cells treated or not with adriamycin (ADR) as in (A). Data are presented as mean ± SEM. Results from three biological replicates are shown.
RIP assays performed in MCF10A and MCF7 cells treated or not with adriamycin as in (A) were performed using antibodies directed to p53 and ID4 proteins. Relative enrichment is calculated as folds over IgG sample, normalized on RPL19 mRNA level. Data are presented as mean ± SEM. Results from three biological replicates are shown.
Fluorescence high‐resolution images of the indicated fixed cell lines, labeled with DAPI (cell nuclei) and Quasar 570 (MALAT1 RNA). Scale bars, 10 μm.
MALAT1 RNA abundance was evaluated by RT–qPCR in MDA‐MB‐468 cells depleted of SRSF1 using three different si‐RNAs and normalized over GAPDH mRNA. Data are presented as mean ± SEM. Results from three biological replicates are shown. *P ≤ 0.05 (two‐tailed Student's t‐test). Western blot on the left shows SRSF1 protein levels after si‐SRSF1‐3 transfection, while SRSF1‐1 and SRSF1‐2 are shown in Fig Fig11G.
Source data are available online for this figure.
On the contrary, immunoprecipitation of endogenous wild‐type p53 in MCF7 breast cancer and in breast‐derived MCF10A cells, in which wt‐p53 was stabilized or not by a DNA‐damaging agent, evidenced no binding to MALAT1 (Fig EV1C–E). Of note, also ID4 protein did not bind to MALAT1 in these wt‐p53 cell contexts (Fig EV1E). Interestingly, staining of MALAT1 RNA by FISH assay evidenced different patterns of intranuclear localization in MCF7 and MDA‐MB‐468 cells, with MCF7 cells showing MALAT1 mainly localized in speckles and MDA‐MB‐468 showing also a diffused localization of MALAT1, beyond the speckles (Fig EV1F).
We decided to investigate whether ID4 and mtp53 bind to MALAT1 directly or other RNA‐binding proteins mediate their binding to MALAT1. To this end, we performed RIP experiments using lysates from cells crosslinked with formaldehyde, which leads to protein:protein and protein:RNA covalent links, or with UV light, which links covalently interacting protein:RNA avoiding protein:protein crosslinks. As shown in Fig Fig1A1A and C, ID4 and p53 proteins bind to MALAT1 only in cells crosslinked with formaldehyde, indicating these as indirect interactions.
One of the best‐characterized MALAT1‐dependent factors is the oncogenic splicing factor SRSF1, which has been shown to be upregulated in breast cancer and to promote transformation of mammary cells 19, 20. To explore whether SRSF1 is responsible for the binding of ID4 and mutant p53 proteins to MALAT1, we first performed RIP experiments in MDA‐MB‐468 cells to determine whether SRSF1 protein actually interacts with MALAT1 in our experimental setting. SRSF1 has been demonstrated to interact directly with MALAT1 13. Consistent with these published data 10, 13, we observed a strong enrichment specifically for MALAT1 lncRNA, and not for NEAT1 lncRNA (not interacting with SRSF1 in previous reports 10), among the RNAs immunoprecipitated with anti‐SRSF1 antibody compared to IgG negative control, in native lysates as well as in lysates from cells crosslinked with formaldehyde and UV light (Fig (Fig11F).
Of note, depletion of SRSF1 expression (Figs (Figs1G1G and EV1G) in MDA‐MB‐468 cells significantly decreased the binding of ID4 and mutant p53 proteins to MALAT1, as assessed by RIP assay (Fig (Fig11H).
Mutant p53 and ID4 interact with SRSF1 in a MALAT1‐dependent manner
We next explored whether ID4 and mutant p53 proteins interact with splicing factor SRSF1. Using a proximity ligation assay (PLA), we first assessed that both ID4 and mutant p53 interact with SRSF1 in MDA‐MB‐468 and SKBR3 cells (Fig (Fig2A2A and B, si‐SCR; Fig EV2A). An interaction between ID4 and mutant p53 was also detected (Fig (Fig2C,2C, si‐SCR; Fig EV2A). Importantly, depletion of MALAT1 (Fig (Fig2D2D and E) by RNA interference significantly reduced the number of ID4‐SRSF1 and mutant p53‐SRSF1 interactions (Figs (Figs2A2A and B, and EV2A–C), indicating that these are RNA‐dependent interactions.
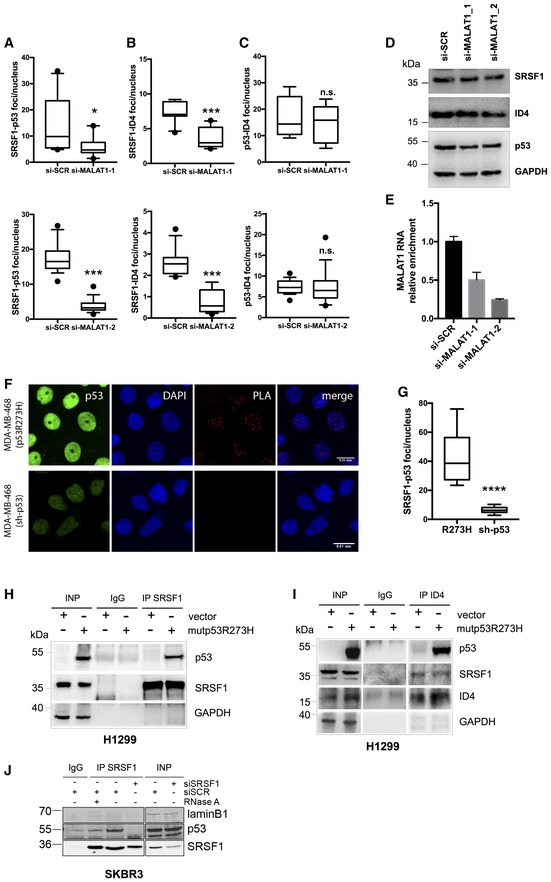
- A–C Proximity ligation assays (PLAs) of SRSF1‐mutant p53 (A), SRSF1‐ID4 (B), and mutant p53‐ID4 (C) interactions in MDA‐MB‐468 cells depleted (si‐MALAT1) or not (si‐SCR) of MALAT1 RNA expression using two different siRNAs. Box plots represent the number of interactions detected per nucleus.
- D, E Western blot (D) and RT–qPCR (E) analysis of MDA‐MB‐468 cells depleted of MALAT1 RNA expression using two different siRNAs.
- F, G PLA of SRSF1‐p53 interaction in parental MDA‐MB‐468 cells (indicated as R273H) as well as in cells stably depleted of endogenous mutant p53R273H expression (indicated as sh‐p53). Immunofluorescence (F) represents p53 staining, DAPI (cell nuclei), PLA signals (SRSF1‐p53 interactions), and merged signals DAPI/PLA. Box plot (G) represents the number of SRSF1‐p53 interactions detected per nucleus. Scale bars, 0.01 mm.
- H, I H1299 cells transfected with mutant p53R273H vector or an empty vector as control were used to evaluate SRSF1‐p53 interaction (H) by immunoprecipitation of SRSF1 (and IgG as control) followed by Western blot of p53, ID4‐p53R273H (I), and ID4‐SRSF1 (I) interactions by immunoprecipitation of ID4 followed by Western blot of p53 and SRSF1, respectively.
- J SRSF1‐p53 interaction evaluated in SKBR3 cell lysate, treated or not with RNase A, by immunoprecipitation of SRSF1 (and IgG as control) followed by Western blot of p53.
Data information: *P ≤ 0.05, ***P ≤ 0.001, ****P ≤ 0.0001 (two‐tailed Student's t‐test). n.s: not significant. Results from at least three biological replicates are shown. (A–C, G) The horizontal line represents the median, the box represents the inter‐quartile range and 10–90th percentile interval is shown in whiskers. The black circles represent outliers. (E) Data are presented as mean ± SEM. Source data are available online for this figure.
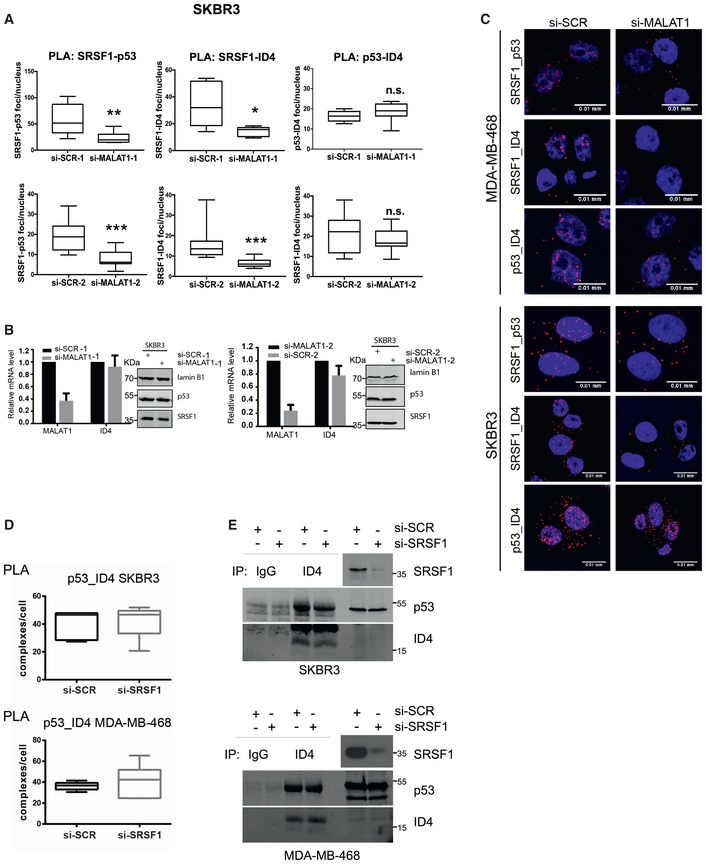
- A, B
PLA assays showing interactions SRSF1‐p53, SRSF1‐ID4, and p53‐ID4 in SKBR3 cells depleted or not of MALAT1 RNA expression using two different siRNAs (A). MALAT1 and ID4 level after MALAT1 interference was evaluated by RT–qPCR (B, graphs); p53 and SRSF1 protein level after MALAT1 interference was evaluated by Western blot (B, panels). In (A) the horizontal line represents the median, the box represents the inter‐quartile range and 10–90th percentile interval is shown in whiskers. *P ≤ 0.05, **P ≤ 0.01, ***P ≤ 0.001 (two‐tailed Student's t‐test). Data in (B) are presented as mean ± SEM. Results from three biological replicates are shown.
- C
Representative images of PLA experiments are shown in Figs Figs2C–E2C–E and EV2A. Merged signals of DAPI and PLA are shown in the indicated cells. Scale bars, 0.01 mm.
- D
PLA assays to evaluate the interaction between p53 and ID4 proteins, performed in the indicated control and SRSF1‐depleted cell lines. Results from three biological replicates are shown. The horizontal line represents the median, the box represents the inter‐quartile range and 10–90th percentile interval is shown in whiskers.
- E
Interaction between p53 and ID4 proteins was evaluated by immunoprecipitation of ID4 followed by Western blot of p53 in the indicated cells, depleted or not of SRSF1 expression.
Source data are available online for this figure.
In contrast, the mutant p53‐ID4 interaction was not affected by MALAT1 interference (Figs (Figs2C2C and EV2A–C) or by SRSF1 interference (Fig EV2D and E).
As a control for the specificity of the mutant p53‐SRSF1 interaction, we analyzed this complex by PLA assay in parental MDA‐MB‐468, as well as in the same cell strain with stable depletion of endogenous mutant p53 expression (sh‐p53). Analysis of p53 levels in these stable cell lines is shown in Appendix Fig S1C. As shown in Fig Fig2F2F and G, the mutant p53‐SRSF1 interaction was strongly reduced upon mutant p53 depletion (sh‐p53).
The interaction between mutant p53 and SRSF1 proteins was also detected in Co‐ImmunoPrecipitation (Co‐IP) experiments using p53‐null H1299 cells transfected with a mutant p53R273H expression vector or an empty vector as negative control (Fig (Fig2H).2H). Immunoprecipitation of ID4 protein followed by Western blot of p53 and SRSF1 in the same cells showed the existence of ID4‐p53R273H and ID4‐SRSF1 complexes (Fig (Fig2I).2I). Co‐IP experiments in SKBR3 cells evidenced the mutant p53R175H‐SRSF1 complex, which was impaired when lysate was treated with RNase A or when cells were depleted of SRSF1 expression (Fig (Fig22J).
Mutant p53 and ID4 stabilize binding of SRSF1 to MALAT1
We next raised the question of whether mutant p53 and ID4 expression influences the binding of SRSF1 to MALAT1. To this end, MDA‐MB‐468 cells were transfected with si‐RNAs directed to p53 or ID4 mRNAs (Fig (Fig3A3A and B), and cell extracts were used to immunoprecipitate SRSF1. Importantly, mutant p53 or ID4 depletion reduced SRSF1 binding to MALAT1 (Fig (Fig3C).3C). It has been reported that MALAT1 RNA contains several SRSF1‐binding sites that are distributed along the whole sequence of the transcript 10, 13. RIP assays for SRSF1, performed in cells subjected to crosslinking and sonication, followed by analysis of enrichments on 14 regions spanning the whole MALAT1 RNA, evidenced a major site of enrichment in the 5′ half of MALAT1 (Fig (Fig3D).3D). Additional regions significantly enriched were also identified along MALAT1 RNA. Depletion of ID4 caused reduction in SRSF1 binding to MALAT1 in all the enriched regions (Fig (Fig3D),3D), while its interaction with other well‐established target pre‐mRNAs was not significantly affected (Fig EV3A). Interestingly, ID4 depletion also impaired binding of SRSF1 protein to mutant p53, as assessed by PLA assay (Figs (Figs3E3E and EV3B).
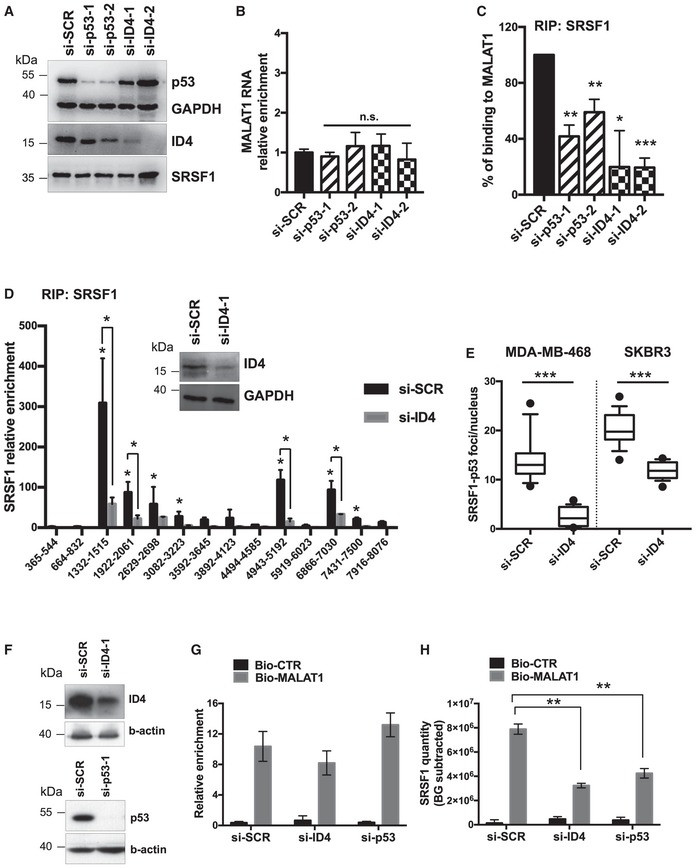
- A, B
p53, ID4, SRSF1 proteins, and MALAT1 RNA levels evaluated by Western blot (A) and RT–qPCR (B) analyses in MDA‐MB‐468 cells depleted or not of p53R273H or ID4 expression using two different siRNAs for each factor.
- C
RIP assays performed in MDA‐MB‐468 cells, depleted or not of ID4 or mutant p53R273H expression, using an antibody directed to SRSF1 (A96, Santa Cruz). MALAT1 RNA abundance was evaluated by RT–qPCR and normalized over GAPDH mRNA.
- D
RIP assay performed in control and ID4‐depleted MDA‐MB‐468 cells crosslinked with formaldehyde using an antibody directed to SRSF1 (A96, Santa Cruz). Recruitment of SRSF1 along MALAT1 RNA was evaluated by using 14 couples of primers covering the whole MALAT1 RNA. Numbers indicate the nucleotide positions on MALAT1 RNA of the couples of primers used.
- E
PLA assay showing the number of interactions between SRFS1 and p53 protein per nucleus, in control and ID4‐depleted cells. The horizontal line represents the median, the box represents the inter‐quartile range and 10–90th percentile interval is shown in whiskers. The black circles represent outliers.
- F
Western blot showing ID4 and mutant p53 protein levels in MDA‐MB‐468 cells transfected with the indicated siRNAs and used for ChIRP assays.
- G, H
ChIRP assay showing the recovery of MALAT1 RNA (G) and its associated SRSF1 protein amount (H) by using a set of biotinylated oligonucleotides complementary to MALAT1 RNA sequence (Bio‐MALAT1), or a set of control oligonucleotides (Bio‐CTR), in lysates from control (si‐SCR), ID4‐depleted (si‐ID4), and mutant p53‐depleted (si‐p53) MDA‐MB‐468 cells. Enrichment for MALAT1 RNA was evaluated by RT–qPCR and normalized over GAPDH mRNA (G). Enrichment for SRSF1 protein was evaluated by dot‐blot analysis (H). Quantification was performed by densitometry on a UVITEC instrument, subtracting background signal, and is presented as folds of Bio‐MALAT1 signal over Bio‐CTR signal in si‐SCR sample.
Data information: Results from at least three biological replicates are shown. Data are presented as mean ± SEM. *P ≤ 0.05, **P ≤ 0.005 (two‐tailed Student's t‐test). Source data are available online for this figure.
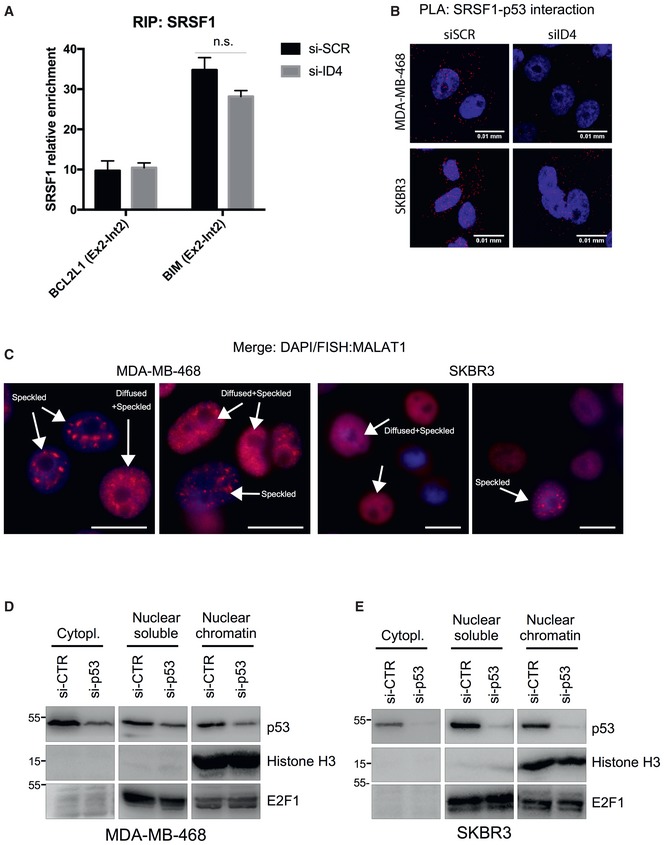
- A
RIP assay performed in control and ID4‐depleted MDA‐MB‐468 cells crosslinked with formaldehyde using an antibody directed to SRSF1 (A96, Santa Cruz). Results from three biological replicates are shown. Data are presented as mean ± SEM. Enrichment of SRSF1 protein on BCL2L1 and BIM pre‐mRNAs was evaluated using primers encompassing the junction between exon 2 and intron 2.
- B
Representative images of PLA assays are shown in Fig Fig3E3E analyzing the interaction between SRSF1 and mutant p53. Merged signals of DAPI and PLA are shown in the indicated cell lines. Scale bars, 0.01 mm.
- C
Representative images of MALAT1 staining obtained in RNA FISH analysis using fluorescence microscopy showing the presence of cells with “classical” speckled localization and cells showing a diffused staining in addition to the speckled localization of MALAT1. Scale bars, 10 μm.
- D, E
Western blot analysis of cell extracts derived by fractionation of lysates from MDA‐MB‐468 and SKBR3 cells, to obtain cytoplasmic, nuclear‐soluble, and chromatin‐associated nuclear fractions, performed using the indicated antibodies.
Source data are available online for this figure.
As reciprocal approach, we performed a ChIRP assay (Chromatin Isolation by RNA Purification) 49. Specifically, MALAT1‐associated proteins and RNAs were recovered by using a series of biotinylated oligonucleotides spanning the whole MALAT1 sequence, in control MDA‐MB‐468 cells (si‐SCR), as well as in ID4‐depleted (si‐ID4) and mutant p53‐depleted (si‐p53) cells (Fig (Fig3F).3F). Efficiency in MALAT1 RNA recovery was checked by RT–qPCR (Fig (Fig3G).3G). Interaction of MALAT1 with ID4 and p53 was analyzed by a dot‐blot assay, as Western blotting was not applicable due to irreversible crosslinking by glutaraldehyde used to fix the cells in this protocol 49. As shown in Fig Fig3H,3H, lower amounts of SRSF1 were found to be associated with MALAT1 RNA in cells depleted of ID4 or mutant p53 compared with control cells.
Mutant p53 and ID4 control intranuclear localization of MALAT1
It has been previously reported that MALAT1 controls alternative splicing by interacting with SR proteins and influencing the distribution of these and other splicing factors in nuclear speckle domains 10. Nuclear speckles do not represent major sites of transcription or splicing, but rather are considered sites from where splicing factors are recruited to active sites of transcription.
To analyze whether mutant p53 or ID4 expression influences the subcellular localization of MALAT1, we performed RNA FISH experiments in MDA‐MB‐468 and SKBR3 cells after mutant p53 or ID4 depletion. In both cell lines, we observed a mixed cell population, composed of cells showing speckled localization of MALAT1 and cells showing diffused plus speckled staining (representative images in Fig EV3C).
As shown in Fig Fig4A,4A, ID4 or mutant p53 depletion affected MALAT1 intranuclear localization in both cell lines, leading to a significant increase in the number of cells showing MALAT1 localized in speckles (Fig (Fig44A).
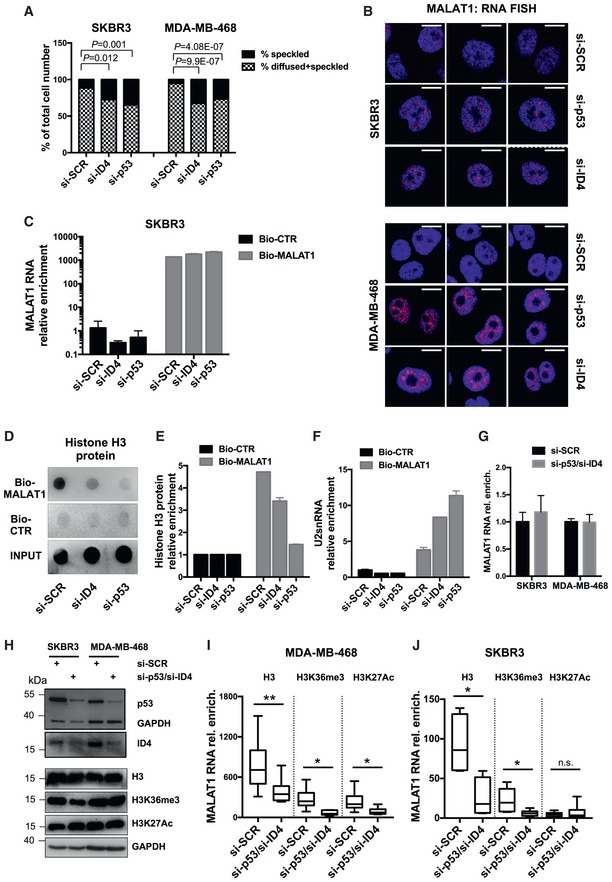
- A RNA FISH was performed in control (si‐SCR), mutant p53‐depleted (si‐p53), and ID4‐depleted (si‐ID4) SKBR3 and MDA‐MB‐468 cells using Stellaris™ fluorescent RNA probes (Biosearch Technologies, Inc.), spanning the whole MALAT1 lncRNA, and visualized at fluorescence microscope. Nuclei presenting speckled or diffused+speckled MALAT1 signal were counted, and the results are presented in graph (A). Differences in the intranuclear distribution of MALAT1 were evaluated by a two‐tailed Student's t‐test.
- B Images of cells presenting speckled localization of MALAT1 by RNA FISH analysis, as visualized by confocal microcopy. Merges of MALAT1 and DAPI signals are presented. Scale bars, 10 μm.
- C–F ChIRP assay showing the recovery of MALAT1 RNA (C) and its associated histone H3 protein (D,E) by using a set of biotinylated oligonucleotides complementary to MALAT1 RNA sequence (Bio‐MALAT1), or a set of control oligonucleotides (Bio‐CTR), in lysates from control (si‐SCR), ID4‐depleted (si‐ID4), and mutant p53‐depleted (si‐p53) SKBR3 cells. Enrichment for MALAT1 RNA was evaluated by RT–qPCR and normalized over GAPDH mRNA (C). Enrichment for histone H3 protein was evaluated by dot‐blot analysis (D, E). Quantification was performed by densitometry on a UVITEC instrument, subtracting background signal, and is presented as folds of Bio‐MALAT1 signals over Bio‐CTR signals (E). Binding of U2 snRNA to MALAT1 in ChIRP was evaluated by RT–qPCR analysis; U2 snRNA relative enrichment was obtained by normalization over 18S rRNA (F).
- G–J RIP assay was performed in the indicated cell lines, depleted or not of mutant p53 and ID4 expression (panels G, H), after crosslinking with formaldehyde, using antibodies directed to histone H3 and its modified forms H3K36me3 and H3K27Ac and IgG as negative control (I, J). Binding to MALAT1 RNA was evaluated by RT–qPCR using six couples of primers spanning MALAT1 sequence. Box plots represent the distribution of the enrichment values of the six considered regions. Enrichment for each region is calculated as fold over the IgG negative control and is normalized over RPL19 mRNA enrichment. The horizontal line represents the median, the box represents the inter‐quartile range and 10–90th percentile interval is shown in whiskers.
Data information: (C, E, F, G): Results from three biological replicates are shown. Data are presented as mean ± SEM. *P ≤ 0.05, **P ≤ 0.005 (paired two‐tailed Student's t‐test). Source data are available online for this figure.
By confocal microscopy analysis, we also noticed an increase in the size of MALAT1‐positive speckles in cells depleted of ID4 or mutant p53 (representative images in Fig Fig44B).
As a higher MALAT1 diffused localization occurs in cells expressing ID4 and mutant p53, we investigated whether ID4 and mutant p53 modulated the localization of MALAT1 on chromatin. To test this, we analyzed the association between MALAT1 and histone H3 protein. Histone H3 protein is indeed localized exclusively in the chromatin‐associated nuclear fraction in the breast cancer cell lines used in our study (Fig EV3D and E). Accordingly, MALAT1‐associated proteins were retrieved using biotinylated oligonucleotides complementary to MALAT1 lncRNA, and the presence of histone H3 was evaluated by a dot‐blot assay. As shown in Fig Fig4C,4C, similar amounts of MALAT1 lncRNA were isolated in control and in ID4‐depleted or mutant p53‐depleted cells. Of note, we observed that histone H3 protein was enriched in samples in which biotinylated oligonucleotides complementary to MALAT1 (Bio‐MALAT1) were used compared to samples using negative control oligonucleotides (Bio‐CTR) (Fig (Fig4D4D and E). Importantly, the amount of MALAT1‐associated histone H3 clearly decreased after ID4 or mutant p53 interference, suggesting that ID4 and mutant p53 favor the localization of MALAT1 to chromatin regions containing H3 (Fig (Fig4D4D and E). Accordingly, analysis of MALAT1‐associated RNAs by RT–qPCR showed that U2 snRNA, which was reported to be mostly localized in nuclear speckles, is enriched in Bio‐MALAT1 versus Bio‐CTR samples and that, importantly, its enrichment increases after depletion of ID4 or mutant p53 (Fig (Fig44F).
As reciprocal approach, in RIP assays, we immunoprecipitated histone H3 protein and evaluated recovery of MALAT1 RNA in control and mtp53‐/ID4‐depleted cells (Fig (Fig4G4G and H). As shown in Fig Fig4I4I and J, we observed a decrease in MALAT1 RNA recovery in cells depleted of mtp53/ID4 compared to control cells (si‐SCR). The same experiment was performed using antibodies directed to modified histone H3 forms, such as H3K36me3 (specifically enriched in exons and able to interact with SRSF1) 50, 51, 52 and H3K27Ac (generally associated with active transcription). H3K36me3 showed a behavior similar to H3, while H3K27Ac was decreased following mtp53/ID4 depletion only in MDA‐MB‐468 cells (Fig (Fig4I4I and J).
Altogether, these findings indicate that mutant p53 and ID4 proteins may enhance MALAT1 availability at sites of active transcription/splicing.
Mutant p53, ID4, SRSF1, and MALAT1 modulate VEGFA isoform expression in breast cancer cells
VEGFA is a major player in tumor angiogenesis and exists in multiple splicing isoforms, including the most abundant VEGFA165 and VEGFA121 (outlined in Fig Fig5A).5A). Moreover, VEGFA may be expressed in cells as pro‐ and anti‐angiogenic splicing variants. Anti‐angiogenic isoforms, named VEGFAxxxb, arise from an alternative 3′ splice site in exon 8 and differ from VEGFAxxx by six amino acids at the C‐terminus (Fig (Fig5A).5A). These alternative six amino acids radically change the functional properties of VEGFA. SRSF1 protein, interestingly, was reported to favor proximal splice‐site (PSS) selection during splicing of the VEGFA transcript, increasing the production of pro‐angiogenic isoforms 26.
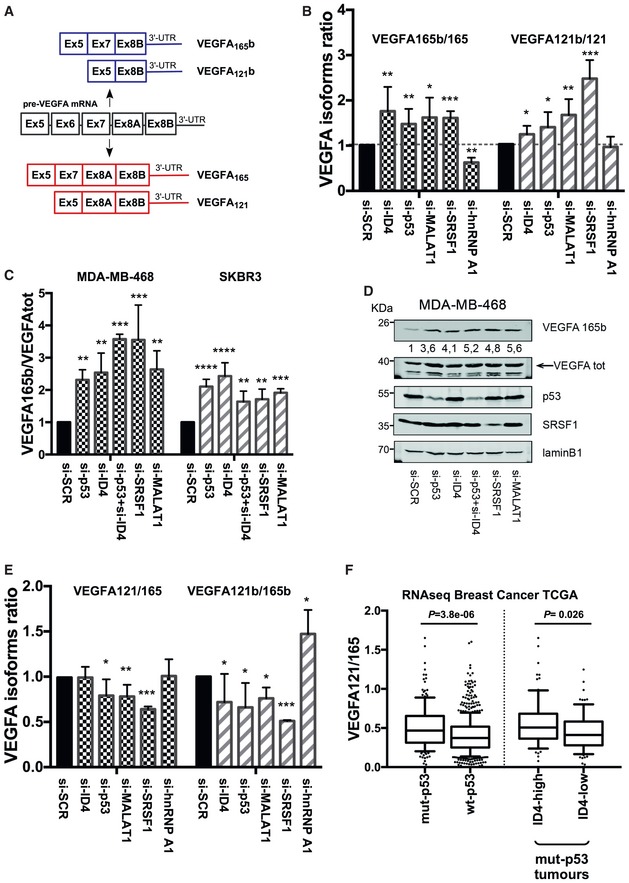
Schematic representation of the genomic organization of VEGFA gene exons 5‐8 and of the mRNAs obtained by their alternative splicing.
RT–qPCR analysis of transcripts encoding pro‐angiogenic (VEGFA165, VEGFA121) and anti‐angiogenic (VEGFA165b, VEGFA121b) VEGFA isoforms in MDA‐MB‐468 cells after interference of mutant p53, ID4, SRSF1, MALAT1, or hnRNP A1. Ratios of anti‐ versus pro‐angiogenic isoforms are shown.
Western blot analysis of total VEGFA and anti‐angiogenic VEGFA165b proteins. Ratios of VEGFA165b in MDA‐MB‐468 and SKBR3 cells depleted of p53, ID4, SRSF1, or MALAT1 over si‐SCR sample normalized to total VEGFA are shown.
A representative Western blot experiment of MDA‐MB‐468 cells. Numbers indicate ratio between VEGFA165b protein densitometry values in interfered cells (si‐p53, si‐ID4, si‐SRSF1, si‐MALAT1) over si‐SCR sample normalized to total VEGFA protein levels.
Ratio of the expression levels evaluated by RT–qPCR of isoform VEGFA121 over VEGFA165 in MDA‐MB‐468 cells after interference of mutant p53, ID4, SRSF1, MALAT1, or hnRNP A1.
Ratio of the expression levels of isoform VEGFA121 over VEGFA165 obtained by analysis of RNA‐seq data from breast cancer samples (TCGA study). The horizontal line represents the median, the box represents the inter‐quartile range and 10–90th percentile interval is shown in whiskers. P‐value was calculated by Wilcoxon signed‐rank test.
Data information: Data are presented as mean ± SEM. *P ≤ 0.05, **P ≤ 0.005, ***P ≤ 0.0005, ****P ≤ 0.00005 (Student's t‐test). Results from at least three biological replicates are shown. Source data are available online for this figure.
We explored whether the identified ribonucleoprotein (RNP) complex affects the abundance of VEGFA isoforms. As VEGFA165 and VEGFA121 are the most abundantly expressed isoforms in cancer cells, we analyzed by RT–qPCR the expression of their pro‐ (VEGFA165 and VEGFA121) and anti‐ (VEGFA165b and VEGFA121b) angiogenic forms in control MDA‐MB‐468 cells and in cells depleted of ID4, mutant p53, MALAT1, or SRSF1. We first evaluated the mRNA ratio between anti‐ and pro‐angiogenic VEGFA isoforms. As shown in Fig Fig5B,5B, the depletion of each component of the RNP complex led to increased 165b/165 and 121b/121 ratios. Depletion of hnRNP A1 (a known negative regulator of SRSF1) shows opposite effect on 165b/165 ratio, compared to si‐SRSF1 (Figs (Figs5B5B and EV4A).
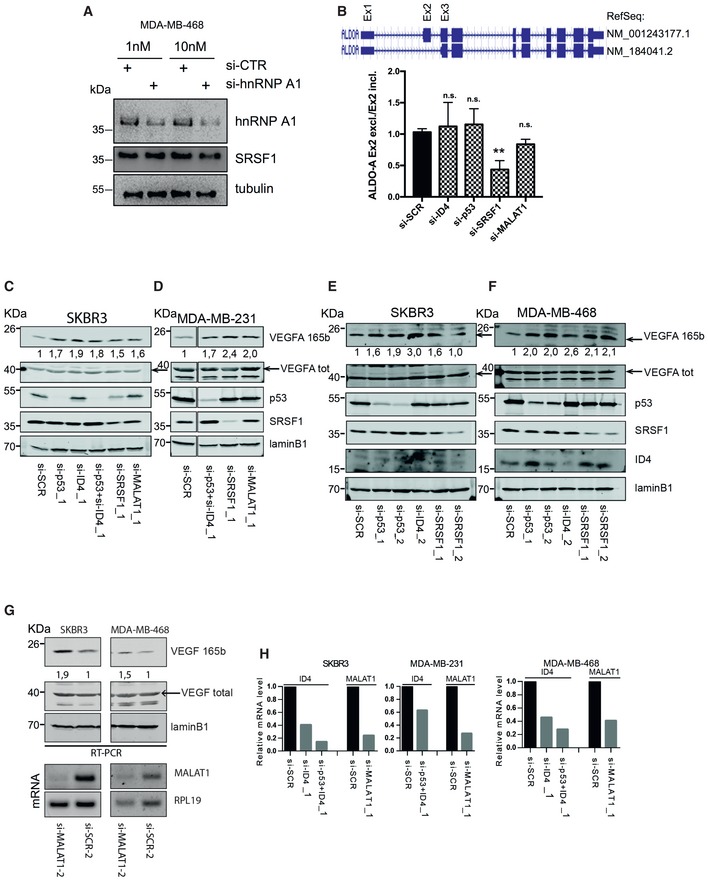
- A Western blot analysis of MDA‐MB‐468 cells interfered or not for hnRNP A1 expression using two different concentrations of siRNAs.
- B RT–qPCR analysis of two isoforms of aldolase A mRNA (ALDOA) differing for the inclusion/exclusion of exon 2. Ratio of exon 2 excluding isoform versus exon 2 including isoform is presented. Results from three biological replicates are shown. Data are presented as mean ± SEM. **P ≤ 0.005 (two‐tailed Student's t‐test).
- C–H Representative Western blot experiments of SKBR3 (C, E, G), MDA‐MB‐231 (D), and MDA‐MB‐468 (F, G) cells transfected with the indicated siRNAs to p53, ID4, SRSF1, or MALAT1. Numbers indicate ratio between VEGFA165b protein densitometry values in interfered cells (si‐p53, si‐ID4, si‐SRSF1, si‐MALAT1) over si‐SCR sample normalized to total VEGFA protein levels. MALAT1 and ID4 depletion was assessed by RT–qPCR (H). Different siRNAs were used for each factor.
Source data are available online for this figure.
We next analyzed VEGFA protein expression by using antibodies specifically recognizing VEGFA165b or total VEGFA. According to RT–qPCR results, we observed that selective depletion of mutant p53, ID4, SRSF1, or MALAT1 expression in MDA‐MB‐468 and SKBR3 cells led to increased VEGFA165b protein level (Fig (Fig5C5C and D). Increase in VEGFA165b protein level was also confirmed by using additional siRNAs for mutant p53, ID4, SRSF1, and MALAT1 depletion in MDA‐MB‐468, SKBR3, and MDA‐MB‐231 cells (Fig EV4C–G).
We also evaluated the ratio between isoforms VEGFA121 and VEGFA165. As shown in Fig Fig5E,5E, a decreased 121/165 ratio was observed in cells depleted of mutant p53, MALAT1, or SRSF1, and a decreased 121b/165b ratio was present in all the analyzed siRNA conditions, suggesting that this complex might favor the shorter VEGFA121 and VEGFA121b expression. An effect opposite to that of si‐SRSF1 on 121b/165b ratio was observed upon depletion of hnRNP A1 (Fig (Fig5E).5E). As a control, we analyzed the effect of the depletion of ID4, mutant p53, MALAT1, or SRSF1 on the production of two isoforms of the housekeeping gene aldolase A (ALDOA), differing for the inclusion/exclusion of an exon (Fig EV4B), and we observed no significant modulation upon interference of all components, except SRSF1, whose depletion led to the reduction in the analyzed isoforms ratio (Fig EV4B).
We next evaluated the expression levels of the various VEGFA isoforms in the RNA‐seq dataset from the breast cancer TCGA study. This dataset allowed only the analysis of VEGFA121 and VEGFA165 expression, as VEGFAxxxb isoform detection is at low levels in this dataset. By comparing tumors with missense mutations in the TP53 gene with wt‐p53‐carrying tumors, we observed that, despite VEGFA165 being the predominant isoform in both groups, the ratio of 121/165 was significantly higher in the group with missense TP53 mutations (Fig (Fig5F).5F). A higher 121/165 ratio was also detected in ID4‐high compared with ID4‐low tumors in the group with missense TP53 mutations.
Mutant p53 and ID4 favor interaction of MALAT1 with VEGFA precursor mRNA
To evaluate whether the identified RNP complex directly participates in control of VEGFA isoform expression, we analyzed whether its mutant p53 component is recruited to VEGFA genomic regions.
Though no longer able to bind the consensus sequences of wt‐p53, the mutant p53 proteins have been shown extensively to control their targets by tying their genomic regions to interaction with other DNA‐binding proteins 41.
Chromatin immunoprecipitation (ChIP) analysis detected mutant p53 protein on the two analyzed genomic regions of the VEGFA gene in MDA‐MB‐468 cells (Fig (Fig6A6A and B), but no significant enrichment was found on a negative control region (NC). The highest mutant p53 enrichment was detected on the boundary between intron 7 and exon 8 (Fig (Fig6A6A and B) of VEGFA gene. Analysis of mutant p53 binding to VEGFA pre‐mRNA through RIP performed under crosslinking conditions evidenced a significant enrichment for mutant p53 at the boundary between intron 7 and exon 8 (Fig (Fig6C),6C), indicating that mutant p53 is in the right place to influence recruitment of splicing factors to the transcription complex as it transcribes the DNA.
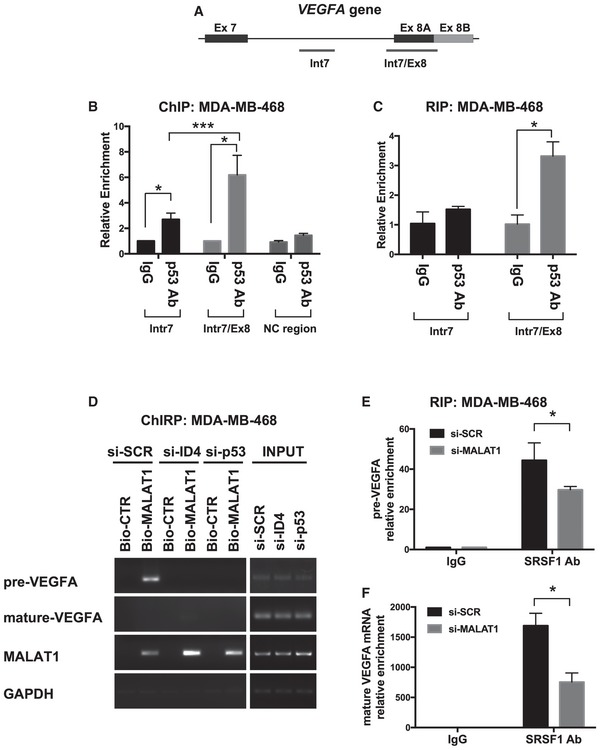
- A, B
Recruitment of mutant p53R273H protein on VEGFA genomic regions evaluated by chromatin immunoprecipitation (ChIP) in MDA‐MB‐468 cells. qPCR was performed using primers amplifying the regions indicated in panel (A) and a negative control region (NC = intronic region of cyclin B1 gene) previously reported 62.
- C
Recruitment of mutant p53R273H protein on VEGFA precursor RNA evaluated by RIP in MDA‐MB‐468 cells crosslinked with formaldehyde. qPCR was performed using primers amplifying the regions indicated in panel (A).
- D
ChIRP assay was performed to recover MALAT1 lncRNA and its associated RNAs by using a set of biotinylated oligonucleotides complementary to MALAT1 RNA sequence (Bio‐MALAT1), or a set of control oligonucleotides (Bio‐CTR), in lysates from control (si‐SCR), ID4‐depleted (si‐ID4), and mutant p53‐depleted (si‐p53) MDA‐MB‐468 cells. Enrichment for the indicated transcripts was evaluated by RT–PCR. Mature VEGFA mRNA was analyzed using primers recognizing all isoforms (reported in Appendix Table S5).
- E, F
RT–qPCR analysis of VEGFA precursor (E) and mature (F) RNAs performed on RIP experiments from control (si‐SCR) and MALAT1‐depleted (si‐MALAT1) MDA‐MB‐468 cells immunoprecipitated using an antibody directed to SRSF1. Mature VEGFA mRNA was analyzed using primers recognizing all isoforms (reported in Appendix Table S5).
Data information: *P < 0.05; ***P < 0.0005 (by Student's t‐test). Results from three biological replicates are shown. Data are presented as mean ± SEM. Source data are available online for this figure.
We next evaluated whether the MALAT1 lncRNA interacts with VEGFA pre‐mRNA. MALAT1 has been shown to interact with target pre‐mRNAs preferentially in intronic regions 53; interestingly, bioinformatics analysis predicted the existence of four RNA:RNA interacting regions between VEGFA intron 7 and MALAT1 (detailed in Appendix Fig S2A). Recovery of MALAT1‐bound RNAs by ChIRP assay revealed that it interacted with VEGFA pre‐mRNA in MDA‐MB‐468 (Fig (Fig6D,6D, si‐SCR) and SKBR3 (Appendix Fig S2B) cells. Of note, depletion of ID4 or mutant p53 impaired MALAT1‐pre‐VEGFA interaction (Fig (Fig6D6D and Appendix Fig S2B).
SRSF1 has previously been shown to control VEGFA pre‐mRNA splicing by binding to a short sequence upstream of the proximal splice site of exon 8 24; RIP analysis in control and MALAT1‐depleted MDA‐MB‐468 cells showed that SRSF1 recruitment on VEGFA pre‐mRNA was decreased by 40% in the absence of MALAT1 (Fig (Fig6E6E and Appendix Fig S2C). Binding of SRSF1 to mature VEGFA mRNA was also impaired by 60% (Fig (Fig6F)6F) after MALAT1 depletion. Altogether, these results indicate that mutant p53 and ID4 proteins enable interaction of MALAT1 with VEGFA pre‐mRNA, finally stabilizing binding of SRSF1 to this precursor.
Mutant p53, ID4, SRSF1, and MALAT1 expression in breast cancer cells favors angiogenesis through repression of VEGFA165b
As the balance between the pro‐ and anti‐angiogenic isoforms of VEGFA is a major determinant of tumor angiogenesis, we evaluated whether depletion of the various components of the ribonucleoprotein complex that we found to repress VEGFAxxxb impacted the angiogenic potential of breast cancer cells.
To verify that VEGFAxxxb isoforms have inhibitory activity on angiogenesis in breast cancer cells, similarly to that reported for other experimental systems 35, 36, we tested the activity of VEGFA165 and VEGFA165b in a tube formation assay. Serum‐free media with or without recombinant VEGFA were used as controls (Fig (Fig7A).7A). As shown in Fig Fig7A7A and Appendix Fig S3A and B, conditioned medium (CM) from SKBR3 cells transfected with an expression vector for VEGFA165 caused a significant increase in the number of meshes formed by HUVEC‐derived EA.hy926 endothelial cells, compared to control CM (CTR). In contrast, CM from SKBR3 cells transfected with the expression vector for VEGFA165b did not affect basal angiogenic potential, but was able to efficiently abrogate the angiogenic gain conferred by CM from VEGFA165‐expressing cells (VEGFA165+VEGFA165b). Because we had observed that VEGFA165b exerts an inhibitory activity on the angiogenic potential of breast cancer cells, we expected that the depletion of mutant p53 or ID4, as well as the depletion of SRSF1 or MALAT1, leading to VEGFAxxxb upregulation, would result in a reduced angiogenic potential of breast cancer cells. To test this hypothesis, we performed tube formation assays involving the growth of endothelial cells in the presence of CM either from control SKBR3 cells (si‐SCR) or cells depleted of mutant p53, ID4, SRSF1, or MALAT1. As shown in Fig Fig7B7B and Appendix Fig S3B, all four interference conditions significantly reduced the angiogenic potential of SKBR3 cells, as assessed by counting the number of meshes formed by endothelial cells. To check whether this reduced angiogenic potential was VEGFA dependent, we tested CM from siRNA‐transfected SKBR3 cells, supplemented with recombinant VEGFA protein (rhVEGFA). rhVEGFA did not affect tube formation in control si‐SCR condition but led to partial recovery of angiogenic potential in the various interference conditions (Fig (Fig7C).7C). Of note, a complete recovery of tube formation potential was observed when VEGFA165b blocking antibody was also added to the CM (Fig (Fig7C7C and Appendix Fig S3C), indicating the existence of an inhibitory activity by VEGFA165b in CM from siRNA‐treated cells.
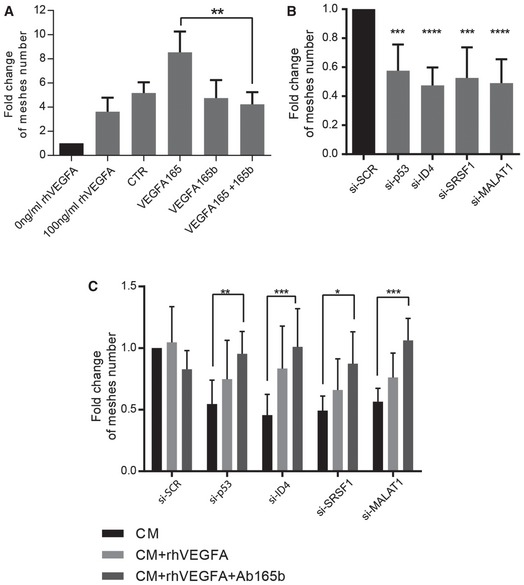
Angiogenic tube formation assays performed by growing EA.hy926 endothelial cells in the presence of serum‐free medium with (100 ng/ml) or without (0 ng/ml) recombinant VEGFA (rhVEGFA), or conditioned medium (CM) from SKBR3 cells transfected with an empty vector (CTR), an expression vector for VEGFA165 (VEGFA165) or an expression vector for VEGFA165b (VEGFA165b). The endothelial cells were also tested with a mixture of CM from VEGFA165‐ and VEGFA165b‐overexpressing SKBR3 cells.
Angiogenic tube formation assays performed by growing EA.hy926 endothelial cells in the presence of CM from SKBR3 cells transfected with control siRNAs (si‐SCR) or si‐RNAs directed to ID4 (si‐ID4), mutant p53 (si‐p53), SRSF1 (si‐SRSF1), or MALAT1 (si‐MALAT1).
Angiogenic tube formation assays performed by growing EA.hy926 endothelial cells in the presence of conditioned medium (CM) from SKBR3 cells interfered as in (A) or plus recombinant VEGFA165 protein (rhVEGFA) alone or in combination with a blocking antibody recognizing VEGFA165b protein (Ab165b).
Data information: Data in (A, B) are presented as mean ± SD. **P ≤ 0.01, ***P ≤ 0.001, ****P ≤ 0.0001 (one‐way ANOVA). Data in (C) are presented as mean ± SD. *P ≤ 0.05, **P ≤ 0.01, ***P ≤ 0.001 (two‐way ANOVA). Meshes formed by EA.hy926 cells were counted from at least three biological replicates, each including three technical replicates.
VEGFA signature expression is enriched in basal‐like breast cancers showing mutant p53 and high ID4 levels
We next aimed to explore whether mutant p53 and ID4 expression is relevant for VEGFA signaling control in human breast cancer. As VEGFAxxxb isoforms inhibit VEGFA‐dependent signal transduction 33, we expected that VEGFA signaling would be strongly activated in cancer cells expressing high levels of ID4 and carrying a mutant p53 protein.
To test VEGFA signaling activity, we first created a VEGFA signature by selecting genes that have been reported and validated in the literature to be directly activated by the VEGFA‐dependent signaling pathway (16‐gene VEGFA signature, indicated as “16‐VEGFA”, Appendix Table S3). We then evaluated the expression of the 16‐VEGFA signature using a collection of gene expression data from basal‐like breast cancers (BLBC) of the METABRIC cohort. BLBC is characterized by the highest incidence of TP53 gene mutations among all breast cancer subtypes, with 80% of patients carrying TP53 mutations (half of which are missense mutations) 54. Of note, High ID4 expression is inversely related to survival specifically in this breast cancer subtype 47, 48.
We then evaluated the expression of the 16‐VEGFA signature, as well as of other VEGFA signatures from the MSigDB database (http://software.broadinstitute.org/gsea/msigdb/), in relation to ID4 expression levels, performing gene‐set enrichment analysis (GSEA) on tumors with different TP53 status. As shown in Fig Fig8A8A and B, the 16‐VEGFA and two additional signatures were significantly enriched in high‐ID4‐ versus low‐ID4‐expressing tumors specifically in the mutant p53 group. No significant correlation was evidenced in the wt‐p53 group or in tumors presenting TP53 deletion (ko‐p53) (Fig (Fig8A).8A). As SRSF1 is predominantly controlled by post‐translational modifications and MALAT1 by intranuclear localization, we could not consider their expression levels for GSEA analysis.
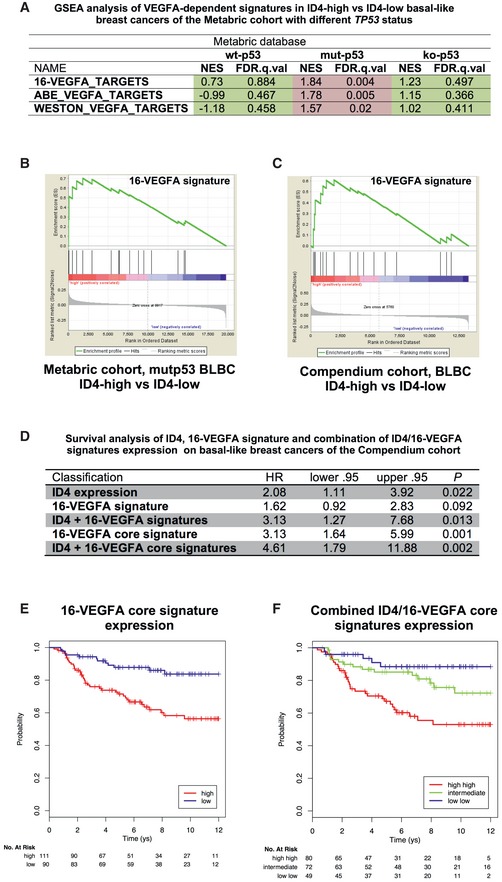
- A Gene‐set enrichment analysis (GSEA) of VEGFA‐dependent signatures in ID4‐high versus ID4‐low basal‐like breast cancers of the METABRIC cohort with different TP53 status. NES, normalized enrichment score; FDR, false discovery rate.
- B Enrichment plot obtained through GSEA of the 16‐VEGFA signature in ID4‐high versus ID4‐low basal‐like breast cancer samples with mutated TP53 gene.
- C Enrichment plot obtained through GSEA of 16‐VEGFA signature in high‐ID4 versus low‐ID4 basal‐like breast cancer samples from the Breast Cancer Compendium Cohort. The black vertical bars indicate the positions of single components of the VEGFA‐activity signature in the samples. The green line shows the cumulative score of the enrichment of the examined 16‐VEGFA signature. A positive enrichment score indicates positive correlation between the 16‐VEGFA signature and ID4 mRNA expression.
- D–F Survival and Kaplan–Meier analyses performed on 201 basal‐like breast cancer patients from the Breast Cancer Compendium Cohort showing the predictive value on overall survival of the expression level of ID4 mRNA, VEGFA signatures, and their combinations. Tumors were divided into high‐ or low‐ID4 expression categories based on the median of ID4 expression in the series.
The 16‐VEGFA signature was also tested comparing high‐ID4‐ versus low‐ID4‐expressing tumors in a second cohort of BLBCs (the Breast Cancer Compendium Cohort, Appendix Table S4 55). 16‐VEGFA signature was significantly enriched in high‐ID4 tumors (FDR = 0.024), with a subset of particularly enriched genes, which constitute the so‐called core (MMP1, COX‐2, DSCR1, EGR1, FLT1, ESM1, CD55).
As both ID4 and VEGFA have been reported to impact survival in breast cancer, we evaluated whether ID4 and VEGFA signature cooperate in survival prediction in BLBC. As expected, ID4 as well as VEGFA signature and VEGFA “core” signature associate with survival in the Breast Cancer Compendium Cohort (Figs (Figs8D8D and E, and EV5A and B). Combination of information about expression levels of ID4 and VEGFA signature evidenced that tumors with high‐ID4/high‐VEGFA signature are associated with a significantly lower survival compared to low‐ID4/low‐VEGFA signature (HR = 3.13, 95% CI (1.27–7.68), log‐rank test P = 0.0085) (Figs (Figs8D8D and EV5C). The remaining combinations (high‐ID4/low‐VEGFA signature, low‐ID4/high‐VEGFA signature) showed an intermediate behavior. A similar but more significant result was obtained considering the combination of ID4 and the VEGFA “core” signature (HR = 4.61, 95% CI (1.79–11.88), log‐rank test P = 0.0004) (Fig (Fig88F).
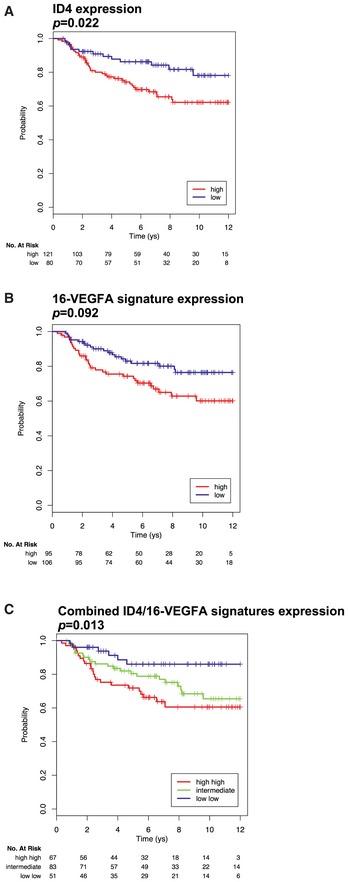
- A–C Kaplan–Meier analyses representing the correlation between the expression of ID4 mRNA (A), 16‐VEGFA signature (B), or their combination (C), and overall survival in 201 basal‐like breast cancer patients from the Breast Cancer Compendium Cohort. Tumors were divided into high‐ or low‐ID4 expression categories based on the median of ID4 expression in the series.
Altogether, these data indicate that high expression of ID4 correlates with strongly activated VEGFA signaling specifically in tumors carrying missense TP53 mutation. Moreover, the combination of ID4 and VEGFA signature expressions robustly predicts the clinical outcome of these tumors.
Discussion
In this study, we demonstrated that mutant p53 and ID4 proteins are able to form a complex with the splicing factor SRSF1 in the presence of MALAT1 lncRNA in breast cancer cells. The expression of all these components is required for the formation of this ribonucleoprotein complex. It is possible that additional proteins participate to the formation of these complexes and this will be clarified by further studies including in vitro assays to evaluate direct protein:protein interactions.
The expression of mutant p53 and ID4 was related to the delocalization of MALAT1 from nuclear speckles. This suggests that the protein complex ID4‐mutant p53‐SRSF1 may cover the MALAT1 speckle localization sequence and thereby relocate it out of speckles. Alternatively, it is also possible that mutant p53 and ID4 control the expression of proteins required for the localization of MALAT1 to speckles, for example, RNPS1, SRm160, and IBP160 11, although the direct interaction between the three proteins and MALAT1 argues against this being required.
Our results also indicate that mutant p53 and ID4 expression directs MALAT1 to chromatin regions that contain histone H3. It is possible that this makes MALAT1 more available at sites of active transcription/splicing on the chromatin. We indeed found a higher level of interaction of MALAT1 with histone H3 (exclusively localized in chromatin) and a lower level of interaction of MALAT1 with U2 snRNA (typically localized in nuclear speckles) in cells expressing mutant p53 and ID4, compared to cells depleted of mutant p53 or ID4.
SRSF1 activity is modulated by phosphorylation events 23, 56. Specifically, hypophosphorylated SRSF1 is enriched in the cytoplasmic compartment where it favors translation of its target mRNAs. The SRPK splicing factor kinases are responsible for SRSF1 phosphorylation in the cytoplasm, leading to its nuclear translocation and accumulation in nuclear speckles. There, a family of Cdc2‐like nuclear kinases (Clk kinases), as well as SRPKs, act on already‐phosphorylated SRSF1, leading to its hyperphosphorylation, which causes its release from speckles to areas where the splicing reaction takes place 23. Further investigation will enable the deciphering of whether the binding of mutant p53 and ID4 to SRSF1 is responsible for the modulation of phosphorylation events, thus influencing the interaction between SRSF1 and MALAT1.
SRSF1 has been reported to promote PSS selection in terminal exon choice during splicing of the VEGFA mRNA, thus favoring the production of pro‐angiogenic isoforms at the expense of anti‐angiogenic isoforms. Accordingly, we observed that ID4 and mutant p53 proteins, which promote stabilization of the binding of SRSF1 to MALAT1, inhibit the production of anti‐angiogenic VEGFAxxxb isoforms and increase the VEGFA 121/165 isoform ratio. Repression of VEGFAxxxb has been previously shown in various malignancies including melanoma, and renal and colorectal carcinoma. However, the molecular mechanism governing the switch from the anti‐angiogenic VEGFA isoforms, which are predominant in non‐transformed cells, to the pro‐angiogenic ones, which are the most expressed in cancer cells, has yet to be exhaustively deciphered. We show here that in breast cancer cells, a mechanism promoting the repression of VEGFAxxxb forms relies on the formation of the quaternary complex containing SRSF1 and MALAT1, previously characterized to interact, and the ID4 and mutant p53 proteins, these being ultimately required for the formation of a stable RNP complex. The depletion of individual components of the RNP complex is sufficient to release the expression of VEGFAxxxb isoforms and to reduce the angiogenic potential of breast cancer cells. Interestingly, MALAT1 has been recently shown to promote angiogenesis driven by neuroblastoma cells through its ability to modulate FGF2 expression 57.
VEGFAxxxb isoform expression has been related to the inhibition of VEGFR2 signaling. Accordingly, we observed enrichment for VEGFA signature expression in breast tumors characterized by the presence of a missense mutation in TP53 gene and High ID4 expression. Further investigation, focused on the examination of phosphorylation status of SRSF1 and intranuclear localization of MALAT1, in breast cancer sections, will allow the analysis of their association with TP53 status, ID4, VEGFA signature expression, and survival.
In aggregate, our findings discover a novel mechanistic layer through which gain–of‐function mutant p53 proteins enhance angiogenesis. Thus, the disassembling of the ribonucleoprotein complex comprising mutant p53/ID4/SRSF1/MALAT1 might hold therapeutic premise for mutant p53 breast cancers.
Materials and Methods
Cell lines, siRNA and plasmid transfections, and retroviral infections
All cell lines were grown at 37°C, 5% CO2, in medium containing 10% fetal bovine serum (FBS) and penicillin/streptomycin. SKBR3 (ATCC) cells were grown in McCoy's 5A medium, MDA‐MB‐468 (ATCC) in DMEM F12 medium, MDA‐MB‐231 (ATCC), MCF7 (ATCC), and H1299 (ATCC) in RPMI medium, HEK T293 cells in DMEM AQ medium. OVCAR‐3 (ATCC) cells were grown in RPMI medium with 20% fetal bovine serum (FBS) plus 0.01 mg/ml bovine insulin and penicillin/streptomycin. Stable cell lines SKBR3 and MDA‐MB‐468 (sh‐p53 and wt‐p53) were obtained by lentiviral transduction. The system is composed of a vector containing both shRNA targeting endogenous mutant p53 and a sequence encoding wild‐type p53. The sequence coding for wt‐p53 possesses silent mutations in a region recognized by shRNA. shRNA‐binding site: GAC TCC AGT GGT AAT CTA C (shRNA sequence); modified p53 sequence: GAC TCG AGC GGC AAC CTC C. Substituted nucleotides are underlined.
For si‐RNA transfection, the GenMute siRNA&DNA (SignaGen) transfection reagent or RNAiMax (Thermo Fisher) was used following the manufacturer's instructions. List of siRNAs used in the study is enclosed in Appendix Table S5.
Western blot
For the Western blot analysis, cells were lysed in RIPA buffer. The protein concentration was measured using a BCA protein assay kit (Thermo Scientific). The lysate was mixed with 4× Laemmli buffer. Total protein extracts were resolved on polyacrylamide gel and then transferred onto nitrocellulose membrane. The following primary antibodies were used: DO‐1 and CM‐1 (anti‐p53, kind gift from B. Vojtesek), A96 (anti‐SRSF1, Santa Cruz), H70 and B‐5 (anti‐ID4, Santa Cruz), M106 (anti‐ID4, CalBioreagents), ab46154 (anti‐VEGFA, Abcam), ab14994 (anti‐VEGFA165b, Abcam), ab16047 (anti‐laminB1, Abcam), E2F1 (Santa Cruz), and H3 and modified H3 forms (Abcam). For detection, two types of secondary antibodies were used: antibodies fused with HRP for chemiluminescence detection, and goat anti‐mouse‐800 and goat anti‐rabbit‐680 LicorOdyssey antibodies for detection with an infrared scanner.
RNA fluorescence in situ hybridization (FISH)
To study the subcellular localization of MALAT1, fluorescence in situ hybridization was performed using a mixture of 48 fluorescent (Quasar® 570) Stellaris™ RNA probes (Biosearch Technologies, Inc.) distributed evenly along the MALAT1 RNA. Cells were fixed with 3.7% formaldehyde in PBS and permeabilized with 70% ethanol for at least 24 h. Then, the manufacturer's protocol was followed. Staining was visualized with a fluorescence microscope, and patterns of MALAT1 distribution (speckled or diffused plus speckled) were counted manually using ImageJ software. Microscope image evaluation was performed independently and in blinded manner by two investigators.
Combined immunofluorescence–RNA FISH
Cells were fixed using 3% paraformaldehyde (PFA) for 10 min at RT, permeabilized with 0.25% v/v Triton X‐100 in PBS for 8 min, blocked 20 min in PBS/1% w/v BSA, and incubated with primary anti‐p53 1:250 (FL393, Santa Cruz). Secondary antibody (Alexa Fluor 488, 1:500) was incubated for 40 min. Cells were post‐fixed using 3% PFA for 10 min at RT and subjected to RNA FISH as described above. Fluorescence high‐resolution images of fixed cells, labeled with DAPI (cell nuclei), Alexa Fluor 488 (p53 protein), and Quasar 570 (MALAT1 RNA), were acquired through an inverted Olympus IX83 microscope (Olympus Europe, Hamburg, Germany), equipped with an UPLSAPO 60× water immersion objective (NA 1.2) with a confocal aperture of 600 microns, for a theoretical optical resolution of 210 nm (horizontal) and 3.8 microns (vertical). The PMT voltages were adjusted such that no pixels were saturated in the image. Colocalization analysis between green and red channels was completed following a well‐established protocol. Per each field of view, the DAPI channel was used to identify ROIs selecting the nuclei portion of the image. Each ROI, then, was analyzed to determine relevant statistical parameters (Pearson's correlation coefficient R 58, Manders colocalization coefficients M1 and M2 59, and Li intensity correlation quotient ICQ 60) by an automatic threshold procedure 61. The average results from all the ROIs for each sample are reported in Fig Fig11E.
Proximity ligation assay and immunofluorescence
To study protein–protein interactions in a quantitative manner, the Duolink® proximity ligation assay (PLA) was used (Sigma‐Aldrich). Cells cultured on a cover glass were fixed in 3.7% formaldehyde in PBS, permeabilized for 10 min with 0.25% Triton X‐100 in PBS, and blocked for 30 min with Duolink blocking buffer. Further, the manufacturer protocol was followed. The nuclei were stained with DAPI. ImageJ software was used to count the positive signals. The samples for immunofluorescence were prepared in the same way as for PLA. Microscope image evaluation was performed independently and in blinded manner by two investigators.
RNA isolation and RT–qPCR
The RNA was isolated with TRIzol (Sigma), and its concentration was measured using a NanoDrop 2000 (NanoDrop Technologies, Wilmington, DE, USA). Reverse transcription was performed with SuperScript II or MMLV‐RT (Invitrogen). qPCR was carried out on ABI PRISM 7500 Fast Sequence Detection System (Applied Biosystems, Carlsbad, CA, USA). Primers used for PCR analyses are listed in Appendix Table S5. The expression values of mRNAs were calculated by standard curve method and normalized over the indicated housekeeping control genes. P‐values were calculated with two‐tailed Student's t‐test. Statistically significant results were referred with a P‐value < 0.05.
Co‐immunoprecipitation
The cells were lysed in buffer composed of 50 mM HEPES pH 7.4, 160 mM NaCl, 10 mM MgCl2, 5 mM KCl, 2 mM EDTA pH 8.0, 1 mM DTT, 0,5% Triton X‐100, and protease and phosphatase inhibitors. 1 mg of total protein lysate was used for immunoprecipitation with Dynabeads® (Invitrogen). After immunoprecipitation, the beads were boiled with Laemmli buffer supplemented with 1 mM DTT. The immunoprecipitated proteins were analyzed by Western blot.
RNA immunoprecipitation (RIP) on native lysates and RIP‐chip
The Dynabeads® (Invitrogen) were preincubated with antibodies specific to the target protein for 24 h at 4°C in NT2 buffer (50 mM Tris–HCl pH 7.4, 150 mM NaCl, 1 mM MgCl2, 0.05% NP‐40). The following antibodies were used: DO1 (Santa Cruz) and Ab7 (Calbiochem) for p53 IP; H70 (Santa Cruz) and ab49261 (Abcam) for ID4 IP; sc‐33652 SF2/ASF (96) (Santa Cruz) for SRSF1 IP. To obtain native lysates, cells were trypsinized, pelleted, and lysed in PLB buffer (10 mM HEPES pH 7.0, 100 mM KCl, 5 mM MgCl2, 0.5% NP‐40, 25 mM EDTA pH 8.0, 1 mM DTT, 100 U/ml RNaseOUT, and protease and phosphatase inhibitors). For every sample, antibody‐coated beads were suspended in 850 μl of NET buffer (850 μl NT2 supplemented with 10 μl of 100 mM DTT, 30 μl of 0.5 M EDTA, and 5 μl of RNaseOUT). 1 mg of total protein lysate in 100 μl PLB was added to the beads and incubated for 1 h at room temperature. After immunoprecipitation, beads were washed four times with 1 ml of ice‐cold NT2 buffer and then resuspended in 100 μl of NET buffer plus 100 μl of proteinase K buffer (200 mM Tris–HCl pH 7.5, 20 mM EDTA pH 8.0, and 100 mM NaCl, 2% SDS). Samples were incubated with 30 μg of proteinase K for 30 min at 55°C. RNA was isolated from the supernatant with TRIzol (Sigma) according to the manufacturer's protocol. The obtained cDNA was further analyzed by real‐time PCR. Enrichments were normalized over GAPDH and/or RPL19 expression.
RNA obtained from RIP experiments was subjected to gene expression profiling using the Affymetrix platform (Human Gene 1.0 ST arrays) according to the manufacturer's instructions. Scanned image files (.CEL) were processed, normalized (RMA‐Sketch Quantile), and log2‐transformed using Affymetrix Expression Console. Transcripts with an expression value lower than 6 were filtered out and not considered for further analyses. Transcripts significantly enriched in samples immunoprecipitated in the presence of anti‐ID4 antibodies (H‐70 from Santa Cruz and ab49261 from Abcam) as compared to IgG negative controls were selected using the supervised comparison analysis of the Analyzer software 62. Specifically, transcripts enriched more than 2.5‐fold with both antibodies, when compared to IgG negative control, were used for subsequent analysis.
RNA immunoprecipitation (RIP) on lysates from crosslinked cells
Cells were crosslinked with 254‐nm UV light 800 mJ/cm2 (using 10‐cm dish with 2.5 ml PBS) or with formaldehyde (F.A.) solution (50 mM HEPES‐KOH pH 7.5, 100 mM NaCl, 1 mM EDTA, 0.5 mM EGTA, 11% formaldehyde, ddH2O) 1% final concentration, 10 min, RT. Nuclei were isolated and resuspended in lysis buffer (Tris–HCl pH 7.5 50 mM, EDTA 1 mM, SDS 0.5%, DTT 1 mM), using 200 μl for each planned IP sample, and sonicated to obtain a smear not higher than 500 bp. Lysate was treated with DNase (DNAfree, Ambion) and diluted with 400 μl of correction buffer (NP‐40, 0.625%, DOC, 0.312%, MgCl2, 5.6 mM, Tris–HCl pH 7.5, 47.5 mM, NaCl, 187.5 mM, glycerol, 12.5%, DTT 1 mM). IP was carried out overnight at +4°C. For histone H3 IP, the following ChIP‐grade antibodies from Abcam were employed: ab1791 (H3); ab4729 (H3K27Ac); ab9050 (H3K36me3). IP washing and proteinase K digestion were carried out as above, crosslinking was reversed by incubation at 70°C for 30 min, and RNA was recovered by TRIzol extraction.
ChIRP
ChIRP was performed as described 49. 20 million cells were used for each condition. The oligonucleotides used for MALAT1 immunoprecipitation are listed in Appendix Table S5. Biotinylated oligonucleotides were recovered using Dynabeads® MyOne™ Streptavidin C1 (Invitrogen). After the washing steps, 60% of the recovered material was used for protein purification, 20% for RNA purification, and 20% for DNA purification. Proteins abundance was evaluated by dot‐blot analysis. Specifically, half of volume of the recovered proteins was loaded in the wells of a Bio‐Dot apparatus (Bio‐Rad), then transferred to the nitrocellulose membrane, and used for blotting using antibodies directed against SRSF1 (A96, Santa Cruz) or histone H3 (Abcam).
Chromatin immunoprecipitation (ChIP)
Formaldehyde crosslinking and chromatin immunoprecipitation were performed as previously described 38. The chromatin solution was immunoprecipitated with sheep anti‐p53 serum (Ab7, Calbiochem), anti‐p53 (Santa Cruz, sc‐6243), or IgG as negative control. Cyclin B1 first intron was amplified as negative control region as described 63. P‐values were calculated with two‐tailed t‐test. Statistically significant results were referred with P‐value < 0.05.
Tube formation assay
To perform the tube formation assay, we used the EA.hy926 cell line, a hybridoma of HUVEC, and A549 cell lines. EA hy926 cells were infected with a lentiviral vector constitutively expressing tdTomato fluorescent protein. Before the experiment, 80% confluent cells were starved for 24 h in serum‐free medium (SFM). Experiments were performed on 96‐well μ‐slides for angiogenesis (Ibidi) coated with 10 μl/well Growth Factor Reduced Matrigel (BD). After Matrigel gelation, 35 μl of conditioned medium (CM) was added. CM was obtained by cultivation of cancer cells for 48 h in a medium with 1% FBS. As a positive control, 100 ng/ml of recombinant human VEGFA165 (PeproTech) was used. Fresh medium with 1% FBS served as a negative control. Then, 35 μl of cells suspended in SFM was added to a final density of 11,000 cells/well. Cell suspension was supplemented with recombinant human VEGFA165 (PeproTech, rhVEGFA, 20 ng/ml) or anti‐VEGFA165b antibody (ab14994, Abcam, 25 nM) and rhVEGFA together. Pictures were taken after 8 h on a wide‐field fluorescence microscope. Image analysis was performed using the ImageJ plugin for angiogenic assays.
Collection and processing of breast cancer gene expression data
The breast cancer compendium was generated as described 55. Briefly, we started from a collection of 4,640 samples from 27 major datasets comprising microarray data of breast cancer samples annotated with histological tumor grade and clinical outcome. The PAM50 classifier for the identification of breast cancer molecular subtypes 64 encoded in the genefu R package 65 classified 751 breast cancer samples as basal, of which 201 presented follow‐up information.
The METABRIC dataset was downloaded from the European Genome‐Phenome Archive (EGA, http://www.ebi.ac.uk/ega/) under accession number EGAD00010000210 66. The dataset comprises microarray data and clinical annotations for 997 breast cancer samples, of which 118 were annotated as basal using PAM50. The status of TP53 was derived from Dataset EV1 of Silwal‐Pandit and colleagues 67 and merging molecular subtyping and TP53 status returned 35 “missense” mutant p53, 22 wt‐p53, and 30 ko‐p53 basal breast cancer samples.
VEGFA isoform level in breast cancer patients was analyzed using the RNA‐seq data of the TCGA Breast Invasive Carcinoma Dataset 54, 68 comprising 672 “missense” mutant p53 and 173 wt‐p53 samples. RNA‐seq data were downloaded from the Firehose Broad GDAC website (http://gdac.broadinstitute.org/) selecting signals normalized at isoform level.
Survival analysis
Basal tumors in breast cancer compendium were classified as “Low ID4 expression” or “High ID4 expression” by considering the expression of the 209291_at Affymetrix probeset representing ID4 and using the median expression value in the cohort as the threshold. To identify two groups of tumors with either high or low‐VEGFA signature, we used a classification rule based on the VEGFA signature score, calculated by summarizing the standardized expression levels of the genes in the signature into a combined score with zero mean. Tumors were classified as “VEGFA signature Low” if the combined score was negative and as “VEGFA signature High” if the combined score was positive. The same rule was applied with the VEGFA core signature. To evaluate the prognostic value of the signatures, we estimated the patients' survival probability using the Kaplan–Meier method. The Kaplan–Meier curves were compared using the log‐rank (Mantel–Cox) test, and P‐values were calculated according to the standard normal asymptotic distribution. Cox proportional hazards models were constructed to estimate the hazard ratios.
Over‐representation analysis
Gene‐set enrichment analysis (GSEA) was used to investigate whether High ID4 expression was associated with elevated activity of VEGFA signaling pathway. GSEA software (http://www.broadinstitute.org/gsea/index.jsp) was applied on log2 expression data of basal tumors classified as “High ID4 expression” or as “Low ID4 expression”. GSEA returned the VEGFA signature as upregulated in phenotype “High ID4 expression” (enrichment score ES > 0) and significantly enriched at FDR < 5% when using 1,000 permutations of gene sets.
Author contributions
GF, GB, AZ, MZ, and DOB designed research. MP, GF, SD, FG, EM, SDA, SDP, FF performed the experiments. SB and MF performed bioinformatics analyses. GF and MP wrote the manuscript.
Supporting information
Appendix
Expanded View Figures PDF
Source Data for Expanded View and Appendix
Review Process File
Source Data for Figure 1
Source Data for Figure 2
Source Data for Figure 3
Source Data for Figure 4
Source Data for Figure 5
Source Data for Figure 6
Acknowledgements
We thank M. Olszewski and M. Wawrzyniak for the preliminary experiments with the tube formation assay. We are indebted to P. Czerwinska and M. Klimczak who provided the modified SKBR3 and MDA‐MB‐468 cell lines and to K. Zabłocki for EA.hy926 cell line. We thank Prof. Eytan Domany, Dr. A. Zeisel, and Dr. A. Yitzhaky for the use of the “Analyzer” software. This work was supported by Italian Ministry of Health grant (GR‐2011‐02348567) and AIRC (MFAG10728) to GF; MIUR Epigen (13/05/R/42) and AIRC (IG14455) to GB; a MAESTRO NZ1/00089 grant from the National Science Centre of Poland to MP, AZ, and MZ; The Foundation for Polish Science within the International PhD Project “Studies of nucleic acids and proteins—from basic to applied research” (co‐financed from the European Union—Regional Development Fund) and FishMed Project (supported by the European Commission under FP7 GA No 316125) to MP; AIRC Special Program Molecular Clinical Oncology “5 per mille” and MIUR EPIGEN—Italian Flagship Project Epigenomics to S.B.
Contributor Information
Giovanni Blandino, Email: [email protected].
Giulia Fontemaggi, Email: [email protected].
References
Articles from EMBO Reports are provided here courtesy of Nature Publishing Group
Full text links
Read article at publisher's site: https://doi.org/10.15252/embr.201643370
Read article for free, from open access legal sources, via Unpaywall:
https://onlinelibrary.wiley.com/doi/pdfdirect/10.15252/embr.201643370
Citations & impact
Impact metrics
Citations of article over time
Alternative metrics
Article citations
Polo-like kinase 2 targeting as novel strategy to sensitize mutant p53-expressing tumor cells to anticancer treatments.
J Mol Med (Berl), 31 Oct 2024
Cited by: 0 articles | PMID: 39480521
Roles of lncRNAs related to the p53 network in breast cancer progression.
Front Oncol, 14:1453807, 16 Oct 2024
Cited by: 0 articles | PMID: 39479021 | PMCID: PMC11521785
Review Free full text in Europe PMC
LncRNA CARMN m6A demethylation by ALKBH5 inhibits mutant p53-driven tumour progression through miR-5683/FGF2.
Clin Transl Med, 14(7):e1777, 01 Jul 2024
Cited by: 2 articles | PMID: 39039912 | PMCID: PMC11263751
The lncRNAMALAT1-WTAP axis: a novel layer of EMT regulation in hypoxic triple-negative breast cancer.
Cell Death Discov, 10(1):276, 11 Jun 2024
Cited by: 0 articles | PMID: 38862471 | PMCID: PMC11166650
SR proteins in cancer: function, regulation, and small inhibitor.
Cell Mol Biol Lett, 29(1):78, 22 May 2024
Cited by: 1 article | PMID: 38778254 | PMCID: PMC11110342
Review Free full text in Europe PMC
Go to all (67) article citations
Data
Data behind the article
This data has been text mined from the article, or deposited into data resources.
BioStudies: supplemental material and supporting data
European Genome-Phenome Archive
- (1 citation) European Genome-Phenome Archive - EGAD00010000210
Similar Articles
To arrive at the top five similar articles we use a word-weighted algorithm to compare words from the Title and Abstract of each citation.
The execution of the transcriptional axis mutant p53, E2F1 and ID4 promotes tumor neo-angiogenesis.
Nat Struct Mol Biol, 16(10):1086-1093, 27 Sep 2009
Cited by: 131 articles | PMID: 19783986
MALAT1-dependent hsa_circ_0076611 regulates translation rate in triple-negative breast cancer.
Commun Biol, 5(1):598, 16 Jun 2022
Cited by: 13 articles | PMID: 35710947 | PMCID: PMC9203778
Expression of ID4 protein in breast cancer cells induces reprogramming of tumour-associated macrophages.
Breast Cancer Res, 20(1):59, 19 Jun 2018
Cited by: 30 articles | PMID: 29921315 | PMCID: PMC6009061
Diagnostic, prognostic, and therapeutic significance of long non-coding RNA MALAT1 in cancer.
Biochim Biophys Acta Rev Cancer, 1875(2):188502, 08 Jan 2021
Cited by: 145 articles | PMID: 33428963
Review
Funding
Funders who supported this work.
Associazione Italiana per la Ricerca sul Cancro (3)
Grant ID: MFAG10728
Grant ID: 5x1000
Grant ID: IG14455
Fundacja na rzecz Nauki Polskiej
Ministero della Salute (1)
Grant ID: GR‐2011‐02348567
Ministero dell’Istruzione, dell’Università e della Ricerca (1)
Grant ID: Epigen flagship project 13/05/R/42
Narodowe Centrum Nauki (1)
Grant ID: MAESTRO NZ1/00089
 3
and
3
and 


