Abstract
Purpose
The purpose of this study was to investigate the hyperpolarized ketone body 13 C-acetoacetate (AcAc) and its conversion to 13 C-β-hydroxybutyrate (βOHB) in vivo, catalyzed by β-hydroxybutyrate dehydrogenase (BDH), as a novel direct marker of mitochondrial redox state.Methods
[1,3-13 C2 ]AcAc was synthesized by hydrolysis of the ethyl ester, and hyperpolarized via dissolution DNP. Cold storage under basic conditions resulted in sufficient chemical stability for use in hyperpolarized (HP) MRI studies. Polarizations and relaxation times of HP [1,3-13 C2 ]AcAc were measured in a clinical 3T MRI scanner, and 8 rats were scanned by dynamic HP 13 C MR spectroscopy of a slab through the kidneys. Four rats were scanned after acute treatment with high dose metformin (125 mg/kg, intravenous), which is known to modulate mitochondrial redox via inhibition of mitochondrial complex I. An additional metformin-treated rat was scanned by abdominal 2D CSI (8 mm × 8 mm).Results
Polarizations of 7 ± 1% and 7 ± 3%, and T1 relaxation times of 58 ± 5 s and 52 ± 3 s, were attained at the C1 and C3 positions, respectively. Rapid conversion of HP AcAc to βOHB was detected in rat kidney in vivo, via the C1 label. The product HP βOHB was resolved from closely resonating acetate. Conversion to βOHB was also detected via 2D CSI, in both kidney as well as liver regions. Metformin treatment resulted in a significant increase (40%, P = 0.01) of conversion of HP AcAc to βOHB.Conclusion
Rapid conversion of HP AcAc to βOHB was observed in rat kidney in vivo and is a promising new non-invasive marker of mitochondrial redox state. Magn Reson Med 79:1862-1869, 2018. © 2017 International Society for Magnetic Resonance in Medicine.Free full text

Direct assessment of renal mitochondrial redox state using hyperpolarized 13C-acetoacetate
Abstract
Purpose
The purpose of this study was to investigate the hyperpolarized ketone body 13C-acetoacetate (AcAc) and its conversion to 13C-β-hydroxybutyrate (βOHB) in vivo, catalyzed by β-hydroxybutyrate dehydrogenase (BDH), as a novel direct marker of mitochondrial redox state.
Methods
[1,3-13C2]AcAc was synthesized by hydrolysis of the ethyl ester, and hyperpolarized via dissolution DNP. Cold storage under basic conditions resulted in sufficient chemical stability for use in HP MRI studies. Polarizations and relaxation times of hyperpolarized (HP) [1,3-13C2]AcAc were measured in a clinical 3T MRI scanner, and eight rats were scanned by dynamic HP 13C MR spectroscopy of a slab through the kidneys. Four rats were scanned after acute treatment with high dose metformin (125mg/kg, intravenous), which is known to modulate mitochondrial redox via inhibition of mitochondrial complex I. An additional metformin-treated rat was scanned by abdominal 2D CSI (8mm × 8mm).
Results
Polarizations of 7±1% and 7±3%, and T1 relaxation times of 58±5s and 52±3s, were attained at the C1 and C3 positions, respectively. Rapid conversion of HP AcAc to βOHB was detected in rat kidney in vivo, via the C1 label. The product HP βOHB was resolved from closely resonating acetate. Conversion to βOHB was also detected via 2D CSI, in both kidney as well as liver regions. Metformin treatment resulted in a significant increase (40%, p=0.01) of conversion of HP AcAc to βOHB.
Conclusion
Rapid conversion of HP AcAc to βOHB was observed in rat kidney in vivo, and is a promising new non-invasive marker of mitochondrial redox state.
Introduction
Mitochondria function as the main cellular powerhouse of eukaryotic organisms. Many studies have emphasized the role of mitochondrial dysfunction in the pathogenesis of a wide variety of diseases. Kidney and liver tissues are among the richest in mitochondrial density, supporting their high energy requirements. Recent studies have implicated mitochondrial dysfunction as a fundamental driver for disease progression in important metabolic diseases of the kidneys and liver associated with obesity and type 2 diabetes, including diabetic nephropathy (DN) (1) and non-alcoholic steatohepatitis (NASH) (2), which are increasing in prevalence in the United States and worldwide. Improved noninvasive monitoring of disease progression and response to targeted treatment of these conditions is an unmet clinical need.
Despite the fundamental role of mitochondria in normal cellular function and their involvement in the pathophysiology of numerous diseases, there exist very few non-invasive diagnostic methods for direct assessment of mitochondrial status. Hyperpolarized (HP) 13C MRI is a new medical imaging modality that facilitates direct, non-invasive detection of localized metabolic activity of several biomolecules, most notably [1-13C]pyruvate (3). HP 13C MRI is enabled by enhancement of nuclear magnetic polarization by up to five orders of magnitude via the process of dissolution dynamic nuclear polarization (dDNP) (4). Conversion of HP [1-13C]pyruvate to [1-13C]lactate largely reflects the relative pool sizes of lactate and pyruvate (5,6), which are dependent on cytoplasmic redox conditions. HP [1-13C]pyruvate has also been used to directly assess the activity of pyruvate dehydrogenase (PDH), a mitochondrial enzyme. Specifically, mitochondrial decarboxylation of HP [1-13C]pyruvate to [13C]bicarbonate via PDH has been reported in multiple studies in a variety of intact tissues (7), including human brain (8) and myocardium (9). However, in many tissues outside the brain such as liver and kidney, fatty acids and not glucose are the principal fuel of oxidation and the quantitative significance of anaplerosis of pyruvate exceeds its oxidation, suggesting that alternate HP probes may be better suited for assessing mitochondrial status in these tissues.
The ketone bodies acetoacetate (AcAc) and β-hydroxybutyrate (βOHB) are exported by the liver in starvation or insulin deficiency, when its capacity to export glucose is exhausted. Ketone bodies serve as a universal oxidative fuel (Figure 1A), formed from excess acetyl-CoA units derived mainly from β-oxidation of fatty acids. The rapid equilibrium between acetoacetate (AcAc) and β-hydroxybutyrate (βOHB) (Figure 1B), catalyzed by the mitochondrial enzyme β-hydroxybutyrate dehydrogenase (BDH), reflects the redox state of the mitochondrial nicotinamide adenine dinucleotide (NAD) system (10). In this way, the mitochondrial BDH system is largely analogous to the cytoplasmic lactate dehydrogenase (LDH) system involving pyruvate and lactate (which are analogous to AcAc and βOHB, respectively). Notably, the inner mitochondrial membrane is impermeable to NAD(H), and redox state as reflected by this pair of equilibria is compartmentalized between cytoplasm and mitochondria. While complex shuttle mechanisms (e.g. malate-aspartate shuttle) facilitate transfer of reducing power between cellular compartments, the redox state of the two compartments is known to be different and can move independently in pathologic conditions such as insulin deficiency (10). This suggests the importance of compartment-specific interrogation of redox state.
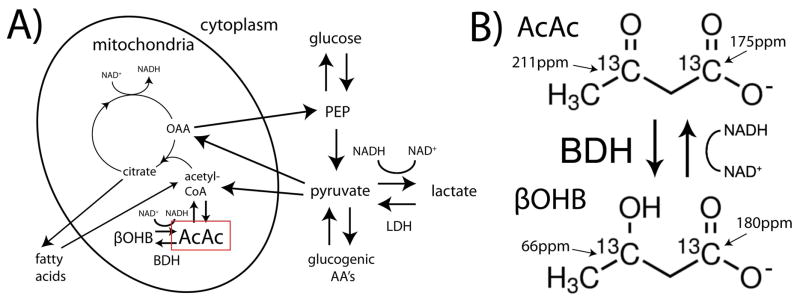
Simplified depiction of the metabolic pathways for ketone bodies acetoacetate (AcAc) and β-hydroxybutyrate (βOHB) as compared with pyruvate and lactate (A), showing the compartmentalization of their respective NAD-dependent biochemical equilibria to the mitochondria and cytoplasm, respectively. Mitochondrial equilibrium between [1,3-13C2]AcAc and [1,3-13C2]βOHB, catalyzed by β-hydroxybutyrate dehydrogenase (BDH), with 13C chemical shifts (B). PEP= phosphoenolpyruvate, OAA= oxaloacetate, AA’s= amino acids, NAD= nicotinamide adenine dinucleotide (hydride).
AcAc meets several key criteria for an ideal HP 13C MRI probe of mitochondrial redox state. AcAc is well tolerated as an endogenous oxidative substrate, rapidly taken up by cells and mitochondria, and rapidly metabolized by a highly active mitochondrial enzyme system to a product (βOHB) with distinct 13C chemical shifts from the substrate at both C1 and C3 positions. Unlike βOHB, both the C1 and C3 carbons of AcAc have long 13C T1 relaxation times due to absence of directly bonded protons. Furthermore, similar to the situation with pyruvate, the reduced form (βOHB) is much more abundant in vivo, allowing the opportunity for isotopic exchange flux into a larger endogenous pool. A potential limitation of AcAc as an imaging probe is chemical instability, since the carboxyl group in AcAc is a good leaving group and thus the compound is prone to spontaneous decarboxylation over time, yielding acetone and CO2. Labeled AcAc is not available commercially, and is typically synthesized just prior to use for research. Multiple preliminary results on direct hyperpolarization of HP 13C ketone bodies have been presented in abstract form (11–14), but there are no prior published reports, and no detected HP metabolic conversion in the abdomen. One prior study investigated hyperpolarization of the ethyl ester of AcAc ([1,3-13C2]ethyl acetoacetate), showing conversion to [1,3-13C2]acetoacetate in vivo via carboxyl esterase activity, as a marker of liver cancer (15). In this study, we investigated the potential for using HP [1,3-13C2]AcAc (synthesized from the ethyl ester, prior to polarization via DNP) to directly probe mitochondrial redox state in rat kidney via detected conversion to [1,3-13C2]βOHB in vivo.
Methods
Preparation of hyperpolarized [1,3-13C2]acetoacetate
The sodium salt of [1,3-13C2]AcAc was synthesized by base catalyzed hydrolysis of the ethyl ester followed by drying, similar to previously described procedures (16). Briefly, one and a half equivalents aqueous NaOH were added to [1,3-13C2]ethyl acetoacetate (Cambridge Isotopes, Tewksbury, MA). This mixture was refrigerated at 2°C for a period of 16 hours, then dried for 30 hours. 13C NMR spectra of the product mixture (obtained in a test run of the synthesis using unlabeled starting material) were acquired on a 11.7T spectrometer (Varian/Agilent) to verify formation of desired product (Figure 2), and compared to reference spectra. Based on addition of a known quantity of [13C]urea to this mixture, we estimate ~20% yield of AcAc. The chemical shift between the C1 resonances of AcAc and βOHB was also measured at 11.7T by spiking a sample of the AcAc preparation with a quantity of unlabeled βOHB (Supporting Fig. S1). The described synthetic procedure was found to also yield significant acetate product, which is prominent in the HP spectra due to the long T1 of its C1 carbon. Proceeding with the preparation for DNP, DMSO was next added (20% vol/vol) to facilitate low temperature glassing, which was verified visually. Finally, 15mM trityl radical OX063 (Oxford Instruments, Tubney Woods, UK) was added to the solution to facilitate DNP. Solution containing ~1M [1,3-13C2]AcAc was stored at −80°C and pH was not adjusted, exploiting the much greater stability of the anion as compared with the acid (17). Samples prepared and stored in this manner exhibited sufficient chemical stability for use in HP 13C MRI studies.
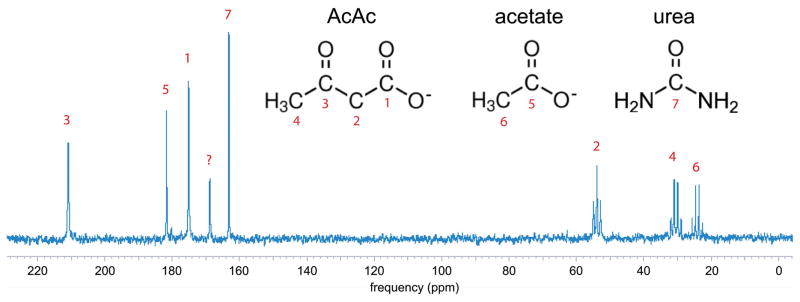
13C NMR spectrum of product sodium acetoacetate material (unlabeled precursor) acquired at 11.7T (no 1H decoupling), with peak assignments. A small quantity of [13C]urea was added to the sample for concentration reference. The peak at 170ppm could not be definitively assigned but is most likely due to carbonate formed via decarboxylation of AcAc.
Hyperpolarization
For each experiment, 80μL of the solution containing ~1M [1,3-13C2]AcAc was polarized via DNP in a commercial Hypersense polarizer (Oxford Instruments) operating at 3.35T and 1.3K. The polarized sample was dissolved in a superheated solution of 4.4mL phosphate buffer and mixed with a small quantity of aqueous HCl (20μL 1M HCl), yielding a HP liquid sample of concentration ~20mM and pH 8–9. Notably, we experienced significant loss of 13C polarization on dissolution at even slightly acidic pH, probably due to the accelerated rate of chemical decomposition (17) and/or an unknown pH-dependence of relaxation.
MRI experiments
A sample of HP [1,3-13C2]AcAc was first tested for polarizations and T1’s at the labeled positions. After dissolution, the sample was drawn into a syringe and transferred to a clinical 3T scanner (GE Healthcare, Waukesha, WI) and placed into a dual-tuned 13C/1H volume insert coil. For estimating polarization and T1’s, a dynamic series of non-localized spectra with 5° 250μs hard pulse excitation was acquired every 3s for a total of 48 excitations (144s total). Thermal polarization was estimated using the same sequence but with 90° excitation and repetition time of 10s for 192 excitations (1920s total, after doping sample with 1% Gd-DTPA v/v). Following standard methods, polarization enhancement was estimated by dividing the HP signal on the first excitation by the averaged thermal signal, with proper scaling to obtain the approximate percent polarization.
Next, a series of eight Sprague Dawley rats were scanned using the same hardware. All studies were conducted in accordance with a protocol approved by the Institutional Animal Care and Use Committee (IACUC). Each rat was injected with 2.2mL ~20mM HP [1,3-13C2]AcAc solution over 12s via lateral tail vein catheter, and dynamic slice-localized spectra from a 10-mm axial slab through the kidney was acquired every 3s over 30s, starting 20s after the start of injection. Excitation was by progressive flip angle (determined via a recursive relationship) in order to fully expend the HP magnetization over the course of the dynamic experiment (18), with adiabatic double spin echo focusing (19) (TE=120ms). Adiabatic double spin echo refocusing was used in order to obtain narrow magnitude spectra, as required in order to most easily resolve βOHB and acetate, in a B1-insensitive manner. The spectral bandwidth was 25kHz, with 2048 points acquired. Resonances corresponding to the C1 and/or C3 resonances of AcAc and βOHB were integrated on dynamic HP spectra, and plotted as a function of time. The kidney slice was localized based on balanced SSFP 1H imaging of the whole rat (0.6mm isotropic, 256 × 128 × 96, TE/TR=2.5/5.0ms, scan time= 5min, 12s). To assess the likelihood of renal filtration of circulating HP βOHB as a source of renal βOHB signal, blood levels of βOHB were measured just prior to, and one minute after, the start of injection of AcAc, by analyzing a tail vein blood sample using a consumer blood ketone meter (Nova Biomedical, Waltham, MA).
One additional Sprague Dawley rat was scanned using 2D CSI in order to assess the spatial biodistribution of the injected HP [1,3-13C2]AcAc, and the origin of the product βOHB signal with finer spatial resolution. This rat was pre-treated with metformin according to the protocol described below, since metformin treatment was found to increase the HP βOHB signal level. The 2D CSI acquisition details were just as above except that an 4.8 cm axial slab was repeatedly excited and phase encoded into a coronal 6 (S/I) x 6 (R/L) 2D CSI grid (8mm × 8mm resolution), with TR=250ms giving an acquisition time of 9s, with progressive flip angle applied in this case over the individual phase encoding steps. Combination of axial slice selection with coronal CSI encoding gives a coronal projection image that avoids phase wrap along the long S/I direction. Resulting CSI data were reconstructed and visualized in SIVIC (20).
Metformin treatment
Metformin, the first line medication for type 2 diabetes, is one of relatively few agents that can safely elicit a change in mitochondrial redox state in vivo via inhibition of mitochondrial complex I of the electron transport chain. Numerous studies have shown that metformin specifically inhibits complex I (21), especially at high doses (22), resulting in an increased mitochondrial NADH/NAD+ ratio. The hepatic mitochondrion is widely considered to be the primary site of metformin action, but metformin also distributes extensively to kidney via related organic cation transporters (OCT’s), especially when injected intravenously (23). To assess the sensitivity of HP βOHB production to changes in mitochondrial redox state, four of the eight rats were scanned using HP [1,3-13C2]AcAc 45 minutes after acute high dose treatment with metformin (125mg/kg, intravenous, dissolved in 1mL phosphate buffered saline).
Results
Polarization and T1
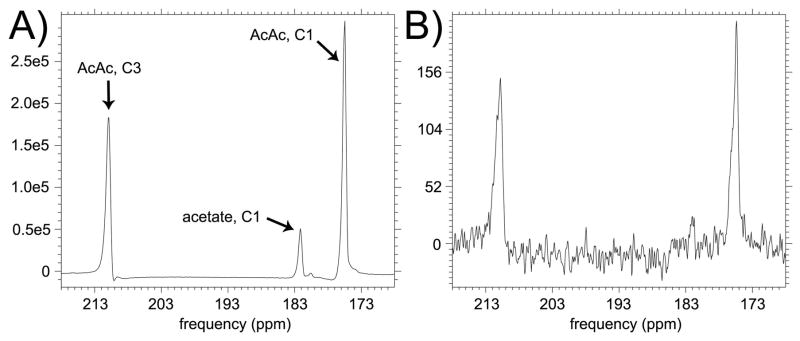
HP and thermal spectra from the [1,3-13C2]AcAc syringe experiment are shown in Figure 3. Fitting the 5° dynamic HP spectra to a decaying exponential (with a small correction for flip angle) yielded T1 relaxation times of 58±5s and 52±3s (based on 3 dissolutions) for the C1 and C3 positions, respectively. Based on comparison to the thermal signal obtained, estimated polarization was 7±1% at C1 and 7±3% at C3 (back-calculated to time of dissolution).
Dynamic slab-localized studies in normal rats
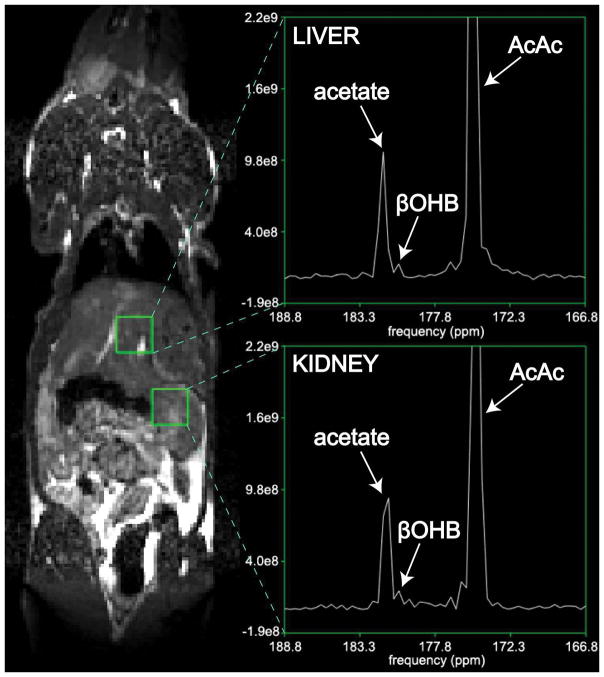
Rapid injection of HP [1,3-13C2]AcAc was well tolerated, and no effects on respiration or heart rate were noted. Rapid conversion of [1,3-13C2]AcAc to [1,3-13C2]βOHB was detected, via their C1 resonances. The detected product HP C1 resonance of βOHB (180.4ppm, referenced to C1 of AcAc at 175.0ppm) bordered closely on the C1 resonance of HP acetate (181.6ppm), and was not detected in HP solution experiments, indicating metabolic production in vivo. The in vivo chemical shift of 5.4ppm between AcAc and βOHB corresponded well to a chemical shift of 5.6ppm measured in vitro at 11.7T, within the limited spectral resolution of the in vivo acquisition (~0.2ppm), and in agreement with prior reports (14,24). Another very small nearby resonance corresponding to an unidentified impurity (179.7ppm) was detected in HP solution experiments (Figure 3) and detected in some in vivo spectra (Supporting Fig. S2). A summed dynamic spectrum from one of the rats is shown in Figure 4B.

Conversion of HP [1,3-13C2]AcAc to [1,3-13C2]βOHB in rat kidney in vivo, detected via the C1 label. Magnitude spectra are scaled to approximate SNR units. Conversion was found to be increased in a rat pre-treated with high-dose metformin (C), as compared to a normal rat (B). Position of a 10mm axial 13C kidney slice from one of the scans is shown on a coronal 1H anatomic image (A).
2D CSI to assess spatial bio-distribution
In the coronal 2D CSI metformin-treated rat data (Figure 5), HP [1,3-13C2]AcAc showed high biodistribution to kidney and liver regions. The largest signal was observed in the vicinity of a long blood vessel, which corresponds to the abdominal aorta. Conversion to βOHB was also observed in separate 8mm × 8mm voxels corresponding to both kidney as well as liver, although the SNR for detection of βOHB product was low in this more localized imaging experiment.
Effect of metformin treatment
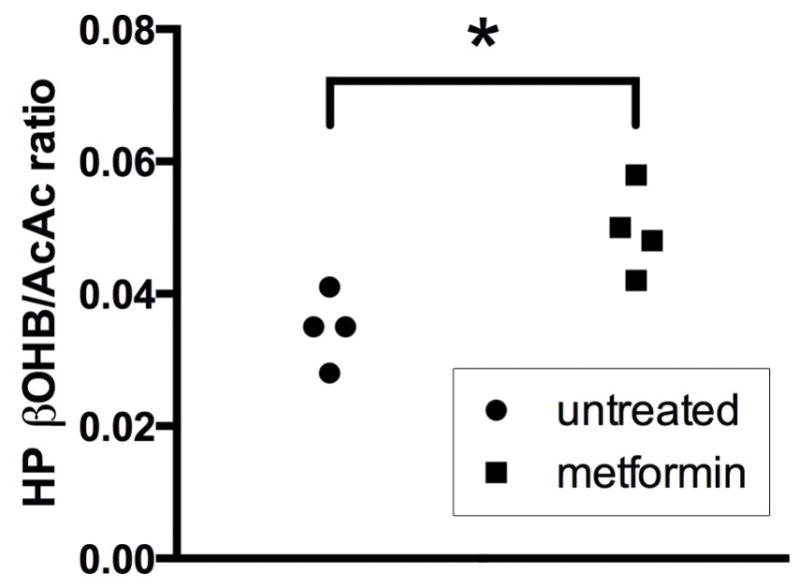
Acute high dose metformin treatment resulted in a significant increase (+40%, p=0.01, two-tailed unpaired t-test) in the production of HP βOHB from HP AcAc. For comparison, a summed dynamic spectrum from one of the metformin-treated rats is shown in Figure 4C. Summary data showing the overall effect of metformin treatment on βOHB/AcAc ratios measured in all rats is shown in Figure 6.
Blood ketone measurements
Injection of 2.2mL 20mM [1,3-13C2]AcAc caused only a slight 0.10±0.17mM elevation (p=0.18, using a paired two-tailed t-test) in βOHB levels detected in blood one minute after injection, in a group of seven rats with mean body mass of 284±19g. The raw measurements of blood βOHB levels before and one minute after AcAc injection are shown in Figure 7.
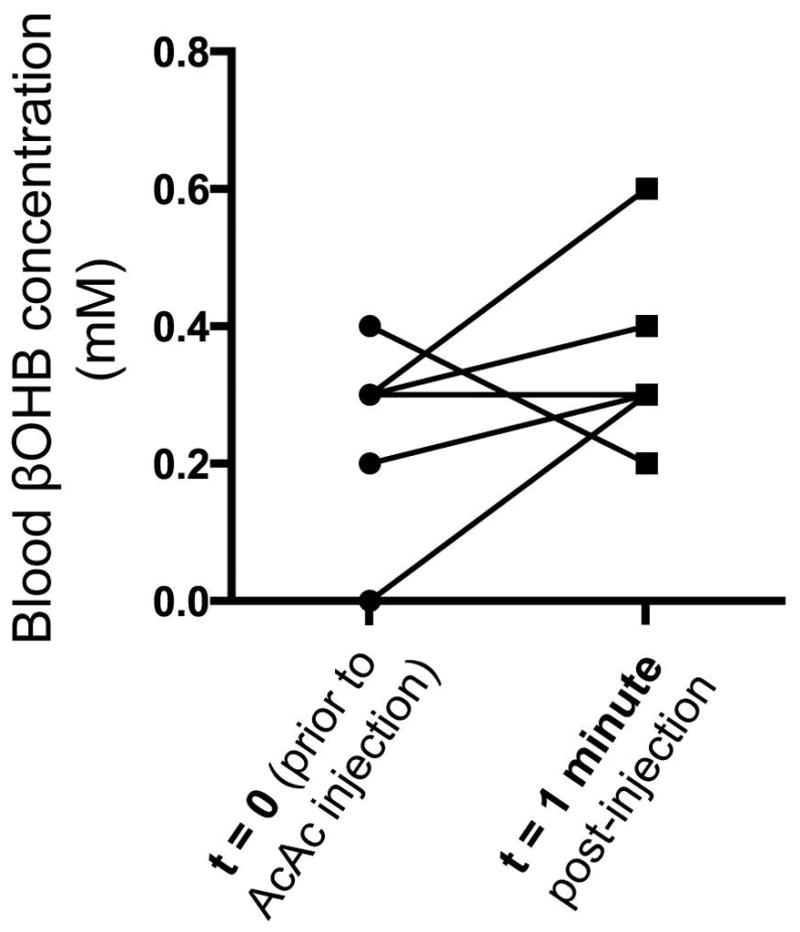
Effect of HP [1,3-13C2]AcAc injection on blood βOHB levels in seven rats, as measured using a blood ketone meter. βOHB levels were measured from a small sample of tail vein blood obtained just before, and one minute after, the start of HP injection. Lines connect the individual data pairs that correspond to each rat. Only six (as opposed to seven) lines are seen because one data pair result (0.3mM–>0.4mM) was observed twice.
Discussion
This study shows clear feasibility for directly hyperpolarizing [1,3-13C2]AcAc via dissolution DNP and use for in vivo investigations, with rapid conversion of injected HP [1,3-13C2]AcAc to [1,3-13C2]βOHB in rat kidney and liver. The rapid equilibrium between AcAc and βOHB catalyzed by the mitochondrial enzyme BDH reflects the redox state of the NAD(H) system, suggesting that HP [1,3-13C2]AcAc has great potential for direct assessment of mitochondrial redox state.
Conversion to βOHB was observed in rat kidney slabs and also observed in CSI voxels localized to kidney as well as liver. While liver is the normal source of ketones for export, we interpret the observed conversion in kidney as a result of renal BDH activity on the exogenous AcAc load. Although activity of BDH is highest in liver, high activity is also found in kidney, heart, and brain (25). HP AcAc could thus potentially be applied to monitor mitochondrial status in multiple tissues expressing this enzyme. However, high spectral resolution is needed to resolve βOHB and acetate, which is difficult to attain in some of these tissues (including liver) due to high physiologic motion.
The renal production of HP βOHB from AcAc was found to be significantly increased after high dose metformin treatment, consistent with metformin’s inhibition of mitochondrial complex I with increased mitochondrial NADH/NAD+ ratio and redox state. While it is widely agreed that high dose metformin inhibits complex I (21), the effect is dose-dependent (22) and the actual anti-hyperglycemic mechanism of metformin remains highly controversial (27). Two recent reports found that acute intravenous metformin treatment actually resulted in an equal or lower mitochondrial free NADH/NAD+ ratio in rat liver (28,29). However, one of these reports applied a much lower dose than used in our study (28), and both prior reports examined liver where the metformin distribution is lower following intravenous injection as compared with the typical oral route (23). Low dose metformin treatment can lower the mitochondrial NADH/NAD+ ratio via direct stimulation of adenosine monophosphate-activated protein kinase (AMPK) (22), potentially explaining these discordant findings. Indeed, a greatly increased hepatic mitochondrial NADH/NAD+ ratio in the liver was noted with chronic metformin treatment via the oral route which is expected to achieve higher dose of the drug in the liver (29).
While it is possible that some fraction of the observed renal HP βOHB signal could be extra-renal in origin (i.e. filtered from blood), it is not likely to comprise a large fraction. βOHB cannot be generated by erythrocytes. Renal accumulation of externally generated βOHB would require several steps including primary organ uptake, conversion, export, and renal filtration. Each injection consisted of 2.2mL 20mM AcAc, therefore estimated to raise the blood concentration of AcAc by ~2.4mM immediately after injection (since rat blood volume is commonly estimated as 64mL/kg body weight, and the mean rat weight was 284g, giving an estimated blood volume of 18.2mL). We measured a small (although not significant) increase in blood βOHB levels (0.1mM) one minute after injection. This potentially corresponds to a small exported fraction of the injected AcAc (0.1mM βOHB divided by the new 2.4mM AcAc in blood, or ~4%). Given the limited temporal window of the HP experiment, the accumulation of any exported βOHB in the kidney during that timeframe is likely a small fraction of this 4%. Therefore any exported βOHB is not expected to comprise a large fraction of the observed renal HP βOHB signal, which was on the order of a few percent of the HP AcAc signal. Furthermore, the observed HP βOHB signal in CSI voxels localized to the kidney and liver lends further support for the local conversion of AcAc to βOHB in both of these organs.
There is increasing recognition that redox state and reactive oxygen species (ROS) generation vary among subcellular compartments. Early work showed that the redox states of NAD(H) in liver cytoplasm and mitochondria differ by about two orders of magnitude, and do not necessarily move in parallel (10). More recently, it has been shown that generation of oxidative stress in the mitochondria precedes other compartments and contributes to cell death during cardiomyocyte (30,31), kidney (32), or liver ischemia (33). These findings underscore the importance of developing tools to evaluate compartmentalized redox state or ROS generation for better understanding of cell pathophysiology.
Other tools to study redox state and ROS formation include several small molecule fluorescent redox sensitive probes (34,35) as well as genetically encoded fluorescent protein based redox sensors (36,37). These probes, however, are mostly limited to cell studies and are not readily translatable to clinical imaging. 1H NMR methods have also been utilized to evaluate cellular redox state. For example, βOHB/AcAc ratios can be obtained from normalized 1H NMR spectra, and have been shown to be in excellent agreement with biochemical assay data (38). The advantages of HP 13C methods over 1H NMR methods for interrogation of redox state include rapid acquisition, the ability to monitor the metabolic conversion in real time, and the lack of background signal. HP 13C dehydroascorbate (DHA), an oxidized form of vitamin C, is another recently developed novel HP redox probe (39,40). Reduction of HP DHA to HP vitamin C has been shown to depend on cellular glutathione level (41) as well as the rate of NADPH production (42). HP 13C DHA, however, does not specifically interrogate mitochondrial redox state. HP AcAc therefore has the potential to provide important and complementary information on mitochondrial redox state.
Potential limitations of AcAc as an imaging probe include its low chemical stability. In this study, sufficient chemical stability for HP studies was achieved using cold storage under highly basic conditions. Another significant requirement is the narrow spectral linewidth that must be achieved in order to resolve HP [1-13C]βOHB from HP [1-13C]acetate in vivo, which is probably formed mainly via the described synthetic procedure, but can also be formed metabolically from HP AcAc. In this work this requirement was met by exciting a narrow 10mm slice, and using double spin echo refocusing (19). Conversion of the C3 resonance of AcAc to βOHB was not detected in any experiments, including initial experiments employing hard pulse excitation. This was probably due to the short expected T1 of the C3 carbon of βOHB due to the directly bonded proton. Moreover, spectral regions corresponding to the C3 carbons of both molecules were outside the refocusing range of the spin echo pulses used in this work. Also notably, for the slice localized experiments described in this work, the spectral regions corresponding to both C3 resonances were not spatially registered with the C1 resonances, due to significant chemical shift registration (on the order of several mm).
In this study, we did not measure the mitochondrial NADH/NAD+ level in the rat kidneys without and with metformin treatment to correlate to the HP 13C βOHB/AcAc data and to confirm the mitochondrial specificity of the HP 13C AcAc probe. However, multiple prior studies have used tissue βOHB/AcAc ratios as a means to assess mitochondrial NADH/NAD+ ratio and mitochondrial redox, including a recent study which evaluated hepatic mitochondrial redox via measurement of tissue βOHB/AcAc ratios following metformin treatment (28). This lends support to the mitochondrial specificity of HP 13C AcAc. Finally, one additional limitation of our studies was the modest level of polarization achieved (~7%). Further studies will aim to refine the chemical preparation and increase the concentration and purity of AcAc, potentially boosting the polarization level and enhancing the detection of βOHB for targeted evaluation of mitochondrial redox state.
Supplementary Material
Supp info
Supporting Figure S1. NMR spectrum (magnitude) of [1,3-13C2]acetoacetate sample preparation spiked with βOHB (natural abundance), acquired at 11.7T. The βOHB (C1) peak is observed at 180.6ppm, referenced to acetoacetate (C1) at 175ppm.
Supporting Figure S2. In vivo HP [1,3-13C2]acetoacetate kidney slab spectra acquired from a normal (untreated) Sprague Dawley rat, showing both metabolic product HP βOHB and an unidentified impurity, as described in text.
References
Full text links
Read article at publisher's site: https://doi.org/10.1002/mrm.27054
Read article for free, from open access legal sources, via Unpaywall:
https://europepmc.org/articles/pmc5815327?pdf=render
Citations & impact
Impact metrics
Article citations
Hyperpolarized 13C Magnetic Resonance Imaging as a Tool for Imaging Tissue Redox State, Oxidative Stress, Inflammation, and Cellular Metabolism.
Antioxid Redox Signal, 36(1-3):81-94, 17 Aug 2021
Cited by: 2 articles | PMID: 34218688 | PMCID: PMC8792501
Review Free full text in Europe PMC
Co-Polarized [1-13C]Pyruvate and [1,3-13C2]Acetoacetate Provide a Simultaneous View of Cytosolic and Mitochondrial Redox in a Single Experiment.
ACS Sens, 6(11):3967-3977, 11 Nov 2021
Cited by: 3 articles | PMID: 34761912 | PMCID: PMC8908480
Comparison of selective excitation and multi-echo chemical shift encoding for imaging of hyperpolarized [1-13C]pyruvate.
J Magn Reson, 325:106927, 03 Feb 2021
Cited by: 4 articles | PMID: 33607386 | PMCID: PMC8009829
Hyperpolarized Carbon (13C) MRI of the Kidneys: Basic Concept.
Methods Mol Biol, 2216:267-278, 01 Jan 2021
Cited by: 0 articles | PMID: 33476006
Books & documents Free full text in Europe PMC
Magnetic resonance spectroscopy for the study of cns malignancies.
Prog Nucl Magn Reson Spectrosc, 122:23-41, 02 Dec 2020
Cited by: 13 articles | PMID: 33632416 | PMCID: PMC7910526
Go to all (14) article citations
Data
Data behind the article
This data has been text mined from the article, or deposited into data resources.
BioStudies: supplemental material and supporting data
Similar Articles
To arrive at the top five similar articles we use a word-weighted algorithm to compare words from the Title and Abstract of each citation.
Metabolism of hyperpolarized 13 C-acetoacetate to β-hydroxybutyrate detects real-time mitochondrial redox state and dysfunction in heart tissue.
NMR Biomed, 32(6):e4091, 10 Apr 2019
Cited by: 9 articles | PMID: 30968985 | PMCID: PMC6525062
Co-Polarized [1-13C]Pyruvate and [1,3-13C2]Acetoacetate Provide a Simultaneous View of Cytosolic and Mitochondrial Redox in a Single Experiment.
ACS Sens, 6(11):3967-3977, 11 Nov 2021
Cited by: 3 articles | PMID: 34761912 | PMCID: PMC8908480
In vivo investigation of hyperpolarized [1,3-13C2]acetoacetate as a metabolic probe in normal brain and in glioma.
Sci Rep, 9(1):3402, 04 Mar 2019
Cited by: 6 articles | PMID: 30833594 | PMCID: PMC6399277
Hyperpolarized sodium 1-[13C]pyruvate
National Center for Biotechnology Information (US), Bethesda (MD), 22 Jul 2010
Cited by: 0 articles | PMID: 20641814
ReviewBooks & documents Free full text in Europe PMC
Funding
Funders who supported this work.
NCI NIH HHS (1)
Grant ID: R01 CA166766
NIBIB NIH HHS (1)
Grant ID: P41 EB013598
NIDDK NIH HHS (3)
Grant ID: K01 DK099451
Grant ID: R01 DK056695
Grant ID: R01 DK097357
National Institute of Biomedical Imaging and Bioengineering (1)
Grant ID: P41EB013598
National Institute of Diabetes and Digestive and Kidney Diseases (2)
Grant ID: R01DK097357
Grant ID: K01DK099451
