Abstract
Free full text

VSTM2A Over-expression is a Sensitive and Specific Biomarker for Mucinous Tubular and Spindle Cell Carcinoma (MTSCC) of the Kidney
Associated Data
Abstract
Our recent study revealed recurrent chromosomal losses and somatic mutations of genes in the Hippo pathway in mucinous tubular and spindle cell carcinoma (MTSCC). Here, we performed an integrative analysis of 907 renal cell carcinoma (RCC) samples (combined from The Cancer Genome Atlas and in-house studies) and the Knepper dataset of microdissected rat nephrons. We identified VSTM2A and IRX5 as novel cancer- and lineage-specific biomarkers in MTSCC. We then assessed their expression by RNA in situ hybridization (ISH) in 113 tumors, including 33 MTSCC, 40 type 1 papillary RCC (PRCC), 8 type 2 PRCC, 2 unclassified RCC, 15 clear cell RCC, and 15 chromophobe RCC. Sensitivity and specificity were calculated as the area under the receiver operating characteristics curve (AUC). All MTSCC tumors demonstrated moderate to high expression of VSTM2A (mean ISH score = 255). VSTM2A gene expression assessed by RNA sequencing (RNA-seq) strongly correlated with VSTM2A ISH score (r2 = 0.81, P = 0.00016). The majority of non-MTSCC tumors demonstrated negative or low expression of VSTM2A. IRX5, nominated as a lineage-specific biomarker, showed moderate to high expression in MTSCC tumors (mean ISH score = 140). IRX5 gene expression assessed by RNA-seq strongly correlated with IRX5 ISH score (r2 = 0.69, P = 0.00291). VSTM2A (AUC: 99.2%) demonstrated better diagnostic efficacy than IRX5 (AUC: 87.5%), and may thus serve as a potential diagnostic marker to distinguish tumors with overlapping histology. Furthermore, our results suggest MTSCC displays an overlapping phenotypic expression pattern with the loop of Henle region of normal nephrons.
INTRODUCTION
Recent large next-generation sequencing (NGS) datasets of renal cell carcinoma (RCC) provide opportunities to discover and characterize biomarkers, disease mechanisms, tumor phenotypes, and therapeutic targets.1–3 RCC subtypes are thought to arise from distinct cell types found in the nephron, and exhibit differences in clinicopathologic profile, clinical course, and response to therapy.4–6 Mucinous tubular and spindle cell carcinoma (MTSCC) is a relatively rare and recently characterized RCC subtype.7 Our previous multi-institutional cohort sequencing study found MTSCC to be molecularly distinct from other RCC subtypes and typified by characteristic chromosomal losses, recurrent somatic mutations in Hippo signaling pathway genes, and the absence of chromosome 7 or 17 gains;7, 8 our major findings have been independently confirmed by other groups.9, 10 MTSCC is a low-grade polymorphic renal epithelial neoplasm with mucinous tubular and spindle cell features.11, 12 More recently, Sadimin et al. suggested expanding the definition of MTSCC to include cases with higher nuclear grade.10 A minority of MTSCC may demonstrate significant morphologic and immunohistochemical overlap with papillary RCC (PRCC).11, 13, 14 When low-grade spindle cell foci are present in PRCC, there may be even greater morphologic similarity between these entities.13–15 At the immunohistochemical level, both MTSCC and PRCC may demonstrate labeling for cytokeratin 7 (CK7) and α-methylacyl-CoA-racemase (AMACR).14 Fluorescence in situ hybridization (FISH) technology has been demonstrated to be useful for detecting gain of chromosomes 7 and/or 17, which is believed to characterize a large majority of PRCC 16–18. In general, MTSCC has a more favorable prognosis than PRCC, but a rare subset of patients with MTSCC may develop metastases.7, 19, 20
To better understand the etiology and molecular subtypes of RCC, we sought to identify cancer- and lineage-specific biomarkers by performing an integrative analysis of RNA sequencing (RNA-seq) data from TCGA (The Cancer Genome Atlas) index samples, MCTP (Michigan Center for Translational Pathology) cohorts, and the Knepper dataset of microdissected rat nephrons.1–3, 8, 21 VSTM2A (V-set and transmembrane domain containing 2A) and IRX5 (Iroquois homeobox gene 5) were identified as cancer-specific and lineage-specific biomarkers in MTSCC, respectively. Herein, we interrogated these two novel candidate biomarkers by performing RNA in situ hybridization (ISH) on various RCC tissue sections. Our findings suggest that assessment of VSTM2A expression in clinical RCC samples may be a valuable tool in the differential diagnosis of MTSCC. Furthermore, IRX5 is a putative lineage-specific biomarker for the loop of Henle and its expression is largely retained in MTSCC.
MATERIALS AND METHODS
RCC Cohorts
Patient samples were procured from the University of Michigan Health System, Cleveland Clinic, Vanderbilt University, Emory University School of Medicine, University of Calgary, New York School of Medicine, EI Camino Hospital, Johns Hopkins Medical Institutions, and Memorial Sloan Kettering Cancer Center (Supplementary Table 1). This study was performed under Institutional Review Board-approved protocols (with waiver of informed consent). This RCC cohort consisted of 33 MTSCC, including 29 classic MTSCC, 4 high-grade MTSCC, 40 type 1 PRCC, 8 type 2 PRCC, 2 unclassified RCC, 15 clear cell RCC (CCRCC), and 15 chromophobe RCC (ChRCC), as detailed in Table 1 and Supplementary Table 1. Cases were re-reviewed by the study pathologists for further diagnostic confirmation.
Table 1.
Clinical Characteristics of the Study Cases
| Tumor type | Total patients (n) | Age (y) ** | Male/Female (ratio) | Tumor size (cm) ** | WHO/ISUP grade |
|---|---|---|---|---|---|
| MTSCC | 33 | 62 (21–78) 69 (53–82) | 0.53:1 0:1 | 4.2 (1.3–16.5) 4.7 (3–6.6) | Low grade (29) High grade (4) |
| Type 1 PRCC | 40 | 60 (41–87) | 4:1 | 3.6 (1.3–16.9) | Grade 2 (28) Grade 3 (11) Grade 4 (1) |
| Type 2 PRCC | 8 | 72 (58–80) | 7:1 | 3.6 (1.3–7.9) | Grade 3 (7) Grade 4 (1) |
| Unclassified RCC* | 2 | 62 | 1 | 10.2 | Grade 3 (2) |
| CCRCC | 15 | 63 (30–82) | 2.75:1 | 6.0 (2.2–12.5) | Grade 2 (3) Grade 3 (6) Grade 4 (6) |
| ChRCC | 15 | 61 (37–72) | 2:1 | 4.3 (2.3–11) | N/A |
Abbreviations: MTSCC, mucinous tubular and spindle cell carcinoma; PRCC, papillary renal cell carcinoma; CCRCC, clear cell renal cell carcinoma; ChRCC, chromophobe renal cell carcinoma; N/A, not available.
RNA-seq Analysis
To identify differentially expressed genes in MTSCC, we combined RNA-seq data from 17 MTSCC cases from our previously published study,8 4 TCGA cases (TCGA-B3–3926, TCGA-UN-AAZ9, TCGA-G7-A8LC and TCGA-F9-A7Q), and 141 normal kidney samples (Supplementary Table 2). Raw sequencing reads were aligned to the GRCh38 reference genome using STAR,22 and overlaps with Gencode v23 annotated protein-coding genes were counted using featureCounts23 in unstranded (TCGA) or strand-specific mode (MCTP). Non-expressed and lowly expressed genes, defined as having a median of < 2 reads per kilobase of transcript per million mapped reads (RPKM) in both MTSCC and normal, were removed prior to differential expression (DE) analysis. A scaling normalization scheme (TMM) was applied to all samples.24 Differential expression analyses were performed with limma25 on voom-transformed count data.26 Systematic differences between two data sources (in-house and TCGA) were adjusted for by including data source as a covariate in the statistical model. Differentially expressed genes were defined as genes with an absolute log2 fold-change > 1 and a Benjamini-Hochberg adjusted P-value of < 0.05.
To identify MTSCC-specific genes, we compared the MTSCC expression profile with three major RCC subtypes (CCRCC, PRCC and ChRCC) from TCGA and several rare subtypes, including translocation RCC, hereditary leiomyomatosis and renal cell cancer (HLRCC)-associated RCC, and mixed epithelial and stromal tumor of the kidney, which were collected from both previous and ongoing studies in our laboratory.27, 28 There were 907 tumor samples and 141 normal samples in total (Supplementary Table 2). The updated classification of TCGA RCC cases was used.29 Samples annotated as “mixed” and “P.CIMP-e” (papillary “CpG island methylator phenotype” enriched group) were excluded. All subtypes were fit to one linear model with limma.25 Differentially expressed genes of MTSCC versus other subtypes were then identified by fitting contrast models. Significant genes (BH adjusted P < 0.05) shared in all pairs of comparison and having > 2 times of the median expression of non-MTSCC subtypes, were selected as candidates of MTSCC biomarkers. Finally, candidates were ranked based on expression level and combined P-value (Fisher’s method) from differential expression analyses.
A cancer-specific biomarker was defined as a gene expressed in a given cancer subtype with very low or no expression in any nephron segment. A lineage-specific biomarker was defined as a gene expressed in both a given cancer subtype and certain nephron segments. To distinguish cancer- and lineage-specific biomarkers, a prior screening was conducted using expression levels (RPKM) from rat-dissected nephron RNA-seq data (GSE56743).21 Each identified MTSCC biomarker with low or no expression in nephron regions (< 2 RPKM) was considered as a cancer-specific candidate, while biomarkers that showed specific expression pattern in nephron regions were considered as putative lineage-specific candidates.
RNA in situ Hybridization
The RNAscope 2.5 HD BROWN Assay (Cat. no. 322300; Advanced Cell Diagnostics, Newark, CA) was performed according to the manufacturer’s instructions and used target probes for VSTM2A and IRX5 on whole tissue sections. VSTM2A RNA probes (Hs-VSTM2A, accession # NM_182546.3, nucleotides 102–1078) and IRX5 RNA probes (Hs-IRX5, accession # NM_005853.5, nucleotides 304–2061) are complementary to the target mRNA. Probes Hs-PPIB (human peptidylprolyl isomerase B) and DapB (bacterial dihydrodipicolinate reductase) were used as positive and negative controls, respectively. FFPE sections were baked at 60 °C for 1 hour. Tissues were first deparaffinized by immersing in xylene twice for 5 minutes each with periodic agitation. The slides were then immersed in 100% ethanol twice for 1 minute each with periodic agitation and then air-dried for 5 minutes. Following a series of pretreatment steps, the cells were permeabilized using Protease Plus to enable probes access to the RNA targets. Post hybridization (HybEZ Oven for 2 hours at 40 °C) slides were washed twice and processed for standard signal amplification steps. Chromogenic detection was performed using DAB, followed by counterstaining with 50% Gill’s Hematoxylin I (26801–01, Fisher Scientific, Rochester, NY).
All slides were examined for RNA ISH signals in tumor cells and background benign renal parenchyma cells by two study pathologists (L. Wang and R. Mehra). The RNA ISH signal was identified as brown, punctate dots, and the expression level was scored as follows: 0 = no staining or less than 1 dot per 10 cells, 1 = 1 to 3 dots per cell, 2 = 4 to 9 dots per cell (few or no dot clusters), 3 = 10 to 15 dots per cell (less than 10% in dot clusters), and 4 = greater than 15 dots per cell (more than 10% in dot clusters). As previously described, a cumulative RNA ISH product score was calculated for each evaluable tissue core as the sum of the individual products of the expression level (0–4) and percentage of cells [0–100; i.e., (A% × 0) + (B% × 1) + (C% × 2) + (D% × 3) + (E% × 4); total range = 0 to 400].30–32
Fluorescence in situ Hybridization (FISH)
Interphase FISH was performed in a manner similar to that previously described.28 Centromeric chromosome enumeration probes (CEP) were utilized for chromosome 7 (CEP7, Orange) and chromosome 17 (CEP17, Green) from Vysis (Downers Grove, IL, USA). Two known positive and negative controls were hybridized at the same time. Briefly, for each slide, 100 nuclei from tumor tissue were scored for probe signals under the fluorescence microscope with X1000 magnification. Trisomy of chromosomes 7 and/or 17 was considered as a characteristic genomic feature of PRCC.17, 18, 33
Statistical Analysis
All statistical analyses were performed using R, v3.3.3. The statistical significance between different groups was determined using Kruskal-Wallis tests. A Spearman’s rank correlation was used to correlate gene expression (RPKM) and RNA ISH product score. The area under the receiver operating characteristic (ROC) curve (AUC), which plots sensitivity against 1-specificity, was used to describe the diagnostic performance of the VSTM2A and IRX5 genes. Statistical significance was defined as a P-value < 0.05.
RESULTS
Nomination of Cancer- and Lineage-specific Biomarkers in MTSCC
First, to identify cancer-specific biomarkers, we used the MCTP MTSCC cohort (n = 17) and TCGA kidney cohorts, and performed an integrative analysis to identify gene expression differences between tumors (n = 907) and normal kidney tissue (n = 141). Overall, there were 1406 genes up-regulated and 2101 genes down-regulated by at least a two-fold change (P < 0.05). In order to exclude dysregulated genes shared with other RCC subtypes, pairwise comparisons with three major RCC subtypes and several rare subtypes were performed, and only genes with significant up-regulation were identified as MTSCC specific biomarkers (two-fold change, P < 0.05, Fig. 1A). In total, 238 MTSCC biomarkers were identified as up-regulated and ranked by expression levels and significance (Supplementary Table 3). VSTM2A was the top-ranked biomarker (ranked No. 1) (Fig. 1A) and was rarely expressed in other RCC subtypes and normal kidney tissue (Fig. 1B).
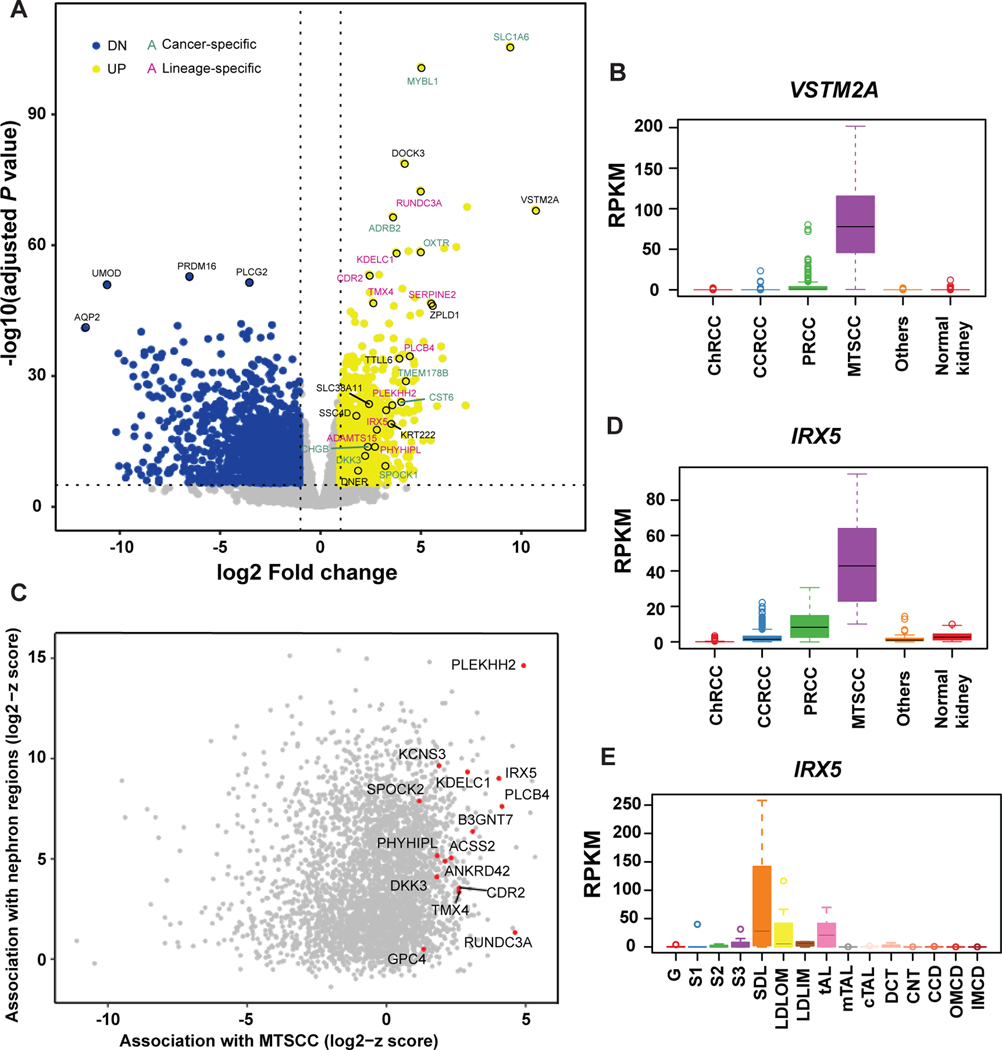
Nomination of cancer- and lineage-specific biomarkers for mucinous tubular and spindle cell carcinoma (MTSCC). (A) Volcano plot showing genes that are significantly dysregulated in MTSCC tumors versus normal kidney samples. Yellow dots: up-regulated genes; blue dots: down-regulated genes; green text: cancer-specific markers; pink text: lineage-specific markers; black text, markers of unknown function. VSTM2A and IRX5 were among the top-ranked biomarkers. (B) VSTM2A gene expression (RPKM) in MTSCC compared to other RCC subtypes and normal kidney tissue. (C) Scatter plot showing the association in gene expression profile between MTSCC and the microdissected rat nephron segments. Genes with high z-scores in both MTSCC and nephron segments were potential lineage-specific biomarkers. (D) IRX5 gene expression in MTSCC compared to other RCC subtypes and normal kidney tissue. (E) IRX5 gene expression (RPKM) across the rat nephron segments. G: Glomerulus; S1: S1 proximal tubule; S2: S2 proximal tubule; S3: S3 proximal tubule; SDL: Short Descending limb; LDLOM: Long Descending Limb, Outer Medulla; LDLIM: Long Descending Limb, Inner Medulla; tAL: Thin Ascending Limb; mTAL: Medullary Thick Ascending Limb; cTAL: Cortical Thick Ascending Limb; DCT: Distal Convoluted Tubule; CNT: Connecting Tubule; CCD: Cortical Collecting Duct; OMCD: Outer Medullary Collecting Duct; IMCD: Inner Medullar Collecting Duct.
Next, we identified lineage-specific biomarkers by including the rat nephron RNA-seq data in our analysis.21 For each gene shared between human and rat datasets, a robust z-score was separately calculated (median divided by the median absolute deviation) for MTSCC and each rat nephron segment. Genes with high z-scores in both MTSCC and nephron segments were considered as potential lineage-specific biomarkers (Fig. 1C). We noted that in addition to over-expression of IRX5 in MTSCC tumors (four-fold change and ranked No. 15, Supplementary Table 3, Fig. 1D), certain nephron segments, i.e. in the loop of Henle, also expressed this gene, thus qualifying it as a lineage-specific biomarker (Fig. 1E). To further examine the utility of VSTM2A and IRX5 in RCC, we confirmed their expression in 17 MTSCC cases by RNA ISH, for which the RNA-seq data were available (one case didn’t pass quality control, as described below). In addition, we further performed independent validation from 17 additional MTSCC cases, including four with higher nuclear grade, procured from our archive and outside collaborators (Supplementary Table 1).
Clinical Characteristics of the Cohort
The clinicopathologic characteristics of the RCC tumor cohort used in this study are summarized in Table 1. Twenty-nine MTSCC tumors exhibited classic morphologic features, including elongated tubules lined by low-grade cuboidal cells and/or cords of spindled cells in variably myxoid stroma. Four MTSCC tumors had high nuclear grade (WHO/ISUP nuclear grade 3). There was a female predilection in the MTSCC groups, which is consistent with the previous literature,9 and distinct from the male predominance observed in other RCC subtypes. The majority of type 1 PRCC showed a dominant papillary pattern; 14 PRCCs selected for this study demonstrated low-grade spindle cell foci.
VSTM2A is a Cancer-specific Marker for MTSCC
Upon querying the Genotype-Tissue Expression (GTEx; www.gtexportal.org) dataset for VSTM2A expression across normal human tissues, we noted its specific expression in normal brain tissue, which we then confirmed by RNA ISH (Supplementary Fig. S1A). We then performed VSTM2A RNA ISH on whole tissue sections from 117 different RCC tumor samples. Four cases with insufficient staining for the positive control (PPIB) were excluded from further analysis, leaving 113/117 (96.6%) samples for RNA ISH analyses. Representative photomicrographs of samples showing different RNA ISH intensities are illustrated in Supplementary Figs. S1B-F.
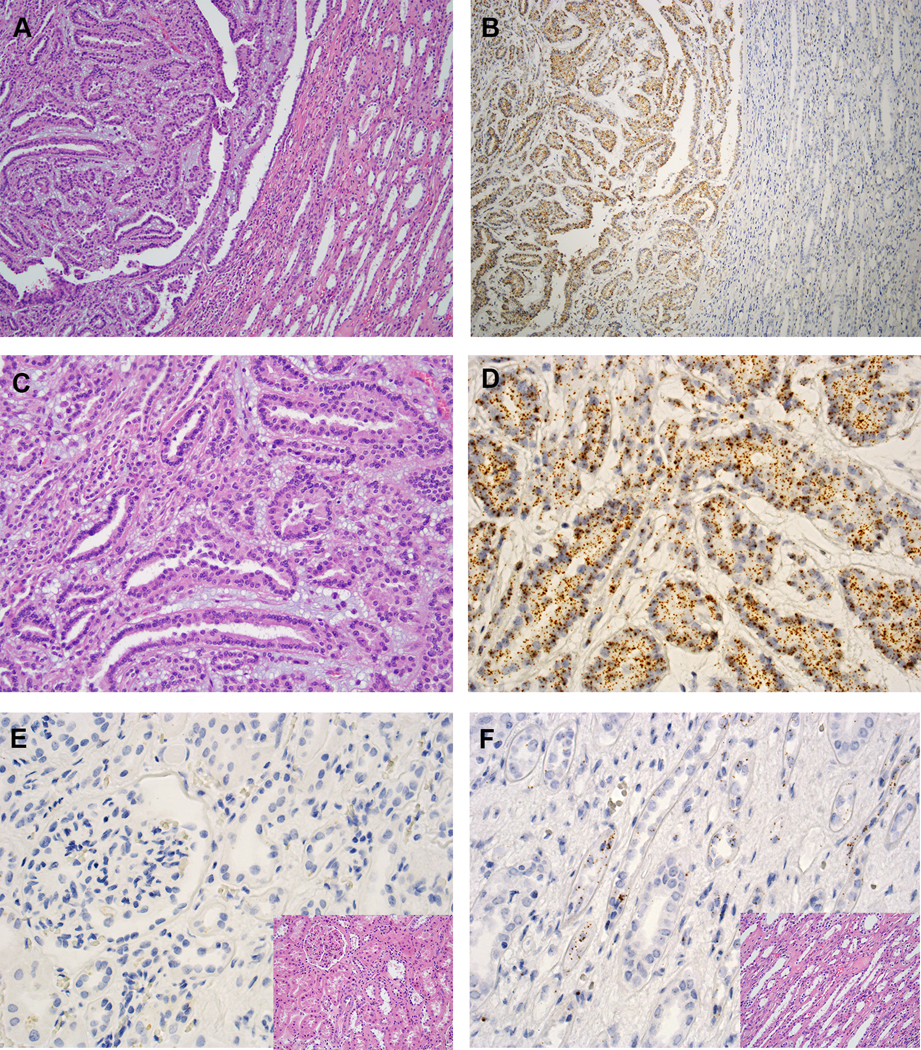
VSTM2A RNA ISH revealed brown, punctate signals (dots) mainly located in the cytoplasm of MTSCC tumor cells (Figs. 2A--D).D). In contrast, almost no dots were detected in renal cortical or medullary cells (Figs. 2E--F).F). All classic MTSCC tumors (n = 29) demonstrated homogeneous moderate to high expression of VSTM2A (mean ISH score = 265; range = 150 to 350) (Supplementary Fig. S2). The percentage of positive cells ranged from 80% to 100%. Four MTSCC tumors with high-grade features demonstrated moderate expression of VSTM2A (mean ISH score = 225; range = 180 to 255) (Supplementary Fig. S3A). The percentage of positive cells ranged from 80% to 90%. Tumor cells showed similar expression of VSTM2A in both the low- and high-grade areas of such tumors.
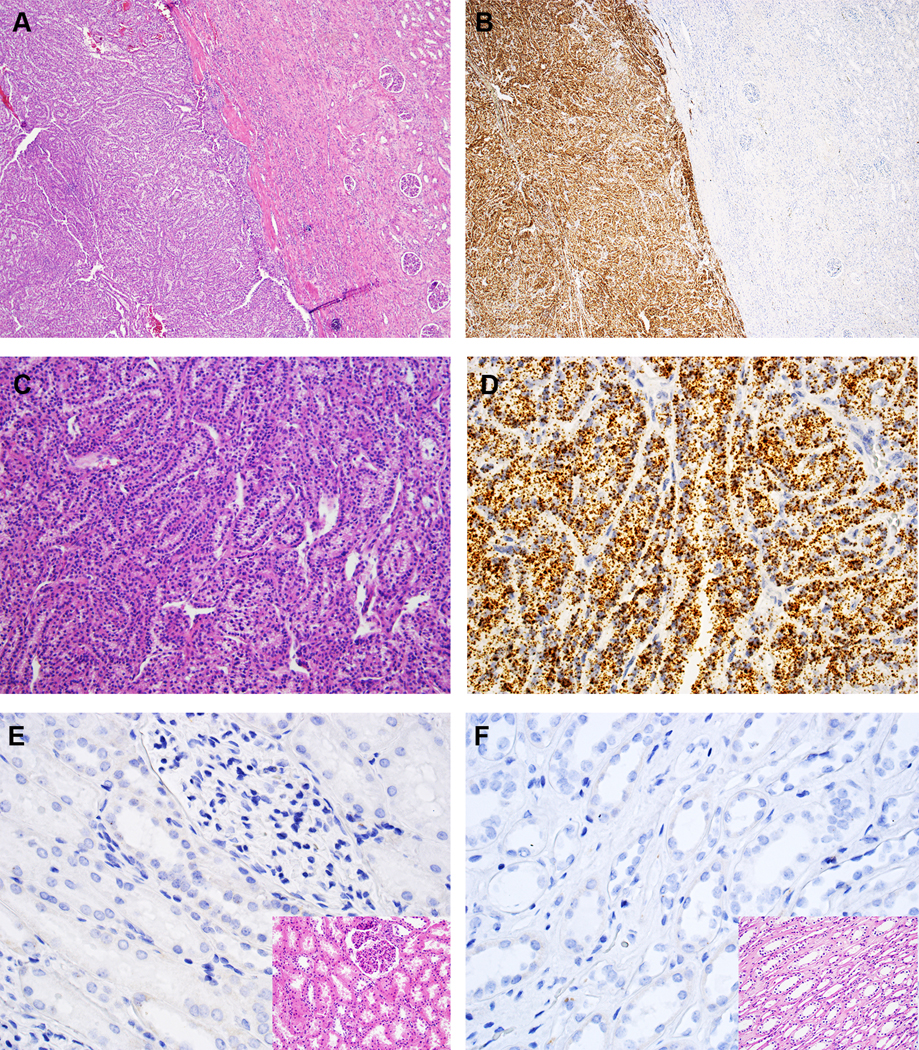
VSTM2A expression in MTSCC by RNA in situ hybridization (ISH). (A, C) Classic MTSCC with elongated tubules in a myxoid matrix (H&E, 40X and 200X, respectively). (B, D) VSTM2A expression in MTSCC by RNA ISH (40X and 200X, respectively), with brown, punctate dots and no background staining. (E, F) Negative expression of VSTM2A in renal cortex and medulla, respectively (400X); inset: H&E (400X).
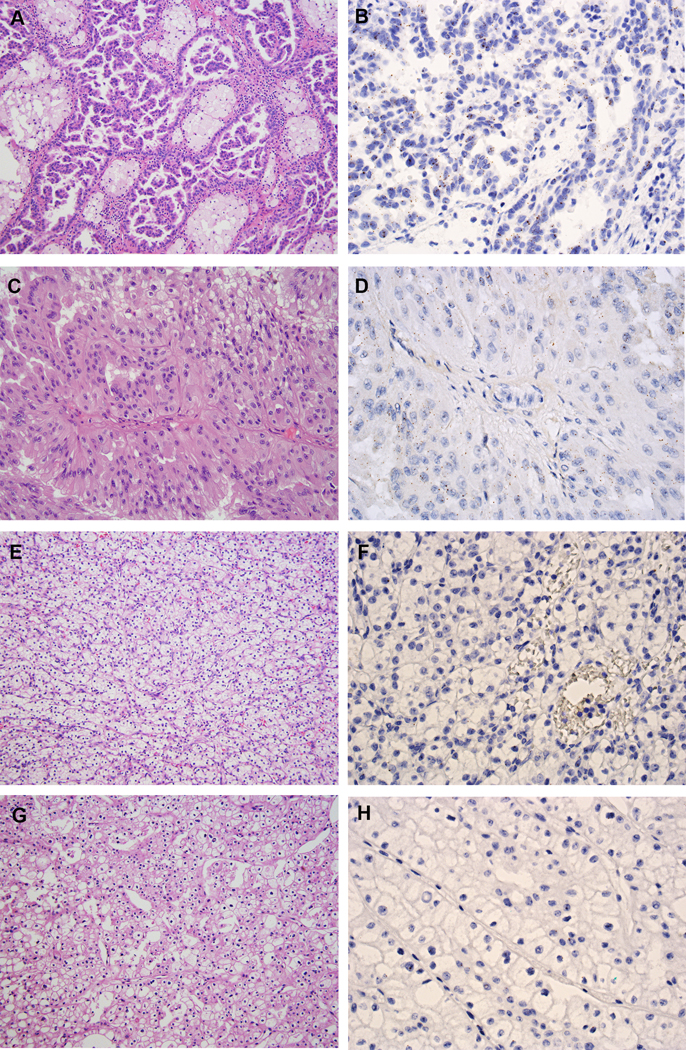
The majority of classic type 1 PRCC (n = 26) demonstrated negative or low expression of VSTM2A (mean ISH score = 30; range = 0 to 140) (Figs. 3A--B).B). The percentage of positive cells ranged from 0% to 80%. Ten of 14 PRCC tumors with low-grade spindle cell foci demonstrated negative or low expression of VSTM2A (mean ISH score = 20; range = 0 to 95, Supplementary Figs. 4A-D), and the remaining four cases demonstrated moderate expression of VSTM2A (mean ISH score = 177.5; range = 125 to 210). Tumor cells showed similar expression of VSTM2A in both the papillary and the spindled areas (Supplementary Figs. S4E-H). Presence of trisomy for chromosomes 7 and/or 17 by FISH (Supplementary Fig. S4G, inset) or SNP-array9 analyses further confirmed these cases as PRCC at the molecular level.
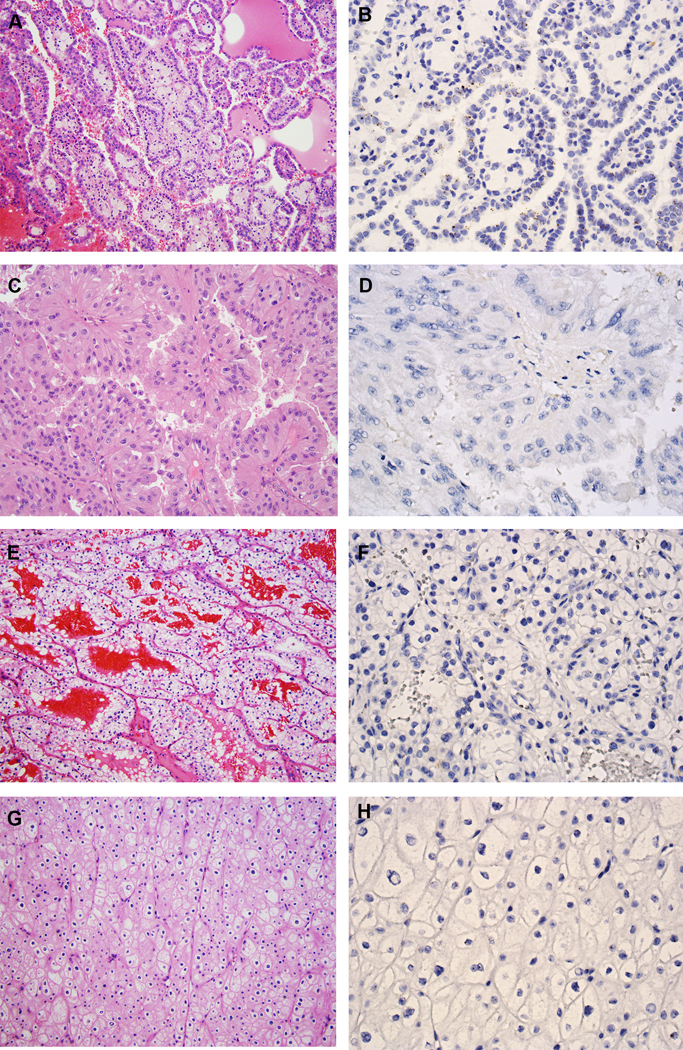
VSTM2A expression in other RCC subtypes. (A) Type 1 PRCC, is characterized by small cuboidal cells covering thin papillae with a single line of uniform nuclei and small nucleoli (H&E, 200X). (B) Type 1 PRCC exhibited low expression of VSTM2A by RNA ISH (400X). (C) Type 2 PRCC, characterized by pseudostratified columnar epithelium on papillary cores, with abundant and eosinophilic cytoplasm, large nuclei and prominent nucleoli (H&E, 200X). (D) Type 2 PRCC was negative for VSTM2A expression by RNA ISH (400X). (E) CCRCC is composed of tumor cells with a clear cytoplasm arranged in nests and pseudopapillary structures with a delicate vascular network (H&E, 200X). (F) CCRCC was negative for VSTM2A expression by RNA ISH (400X). (G) ChRCC is composed of large cells with defined cell membranes (H&E, 200X). (H) ChRCC was negative for VSTM2A expression by RNA ISH (400X).
Seven of eight type 2 PRCC tumors demonstrated low expression of VSTM2A (mean ISH score = 10; range = 0 to 60; Figs. 3C--D).D). One type 2 PRCC tumor demonstrated heterogeneous expression of VSTM2A (ISH score = 170). CCRCC (n = 15) and ChRCC tumors (n = 15) demonstrated negative or very low expression of VSTM2A (mean ISH score = 1; range = 0 to 20; Figs. 3E--HH).
Two RCC cases, with the respective ISH scores of 5 and 30, displayed MTSCC-like features with elongated tubules, solid sheets, or spindle cells, but the tumors demonstrated very low expression of VSTM2A (Supplementary Figs. S5A-D). These two cases lacked the characteristic chromosomal losses of MTSCC, but rather, showed recurrent loss of chromosomal 1p and gain of 1q (data not shown). These two RCC tumors were considered as “unclassified RCC” in our study.
There was a strong correlation between VSTM2A gene expression (RPKM) and RNA ISH product score (n = 16; Spearman’s correlation coefficient r2 = 0.81, P = 0.00016; Fig. 4A). VSTM2A expression was significantly higher in classic MTSCC tumors (n = 29) compared to other RCC subtypes (n = 80, P < 0.0001) and adjacent non-neoplastic renal tissues (n = 81, P < 0.0001, Fig. 4B). VSTM2A RNA ISH product scores for all 109 tumors (four high-grade MTSCC were analyzed separately, as described above) are illustrated in Fig. 4C.
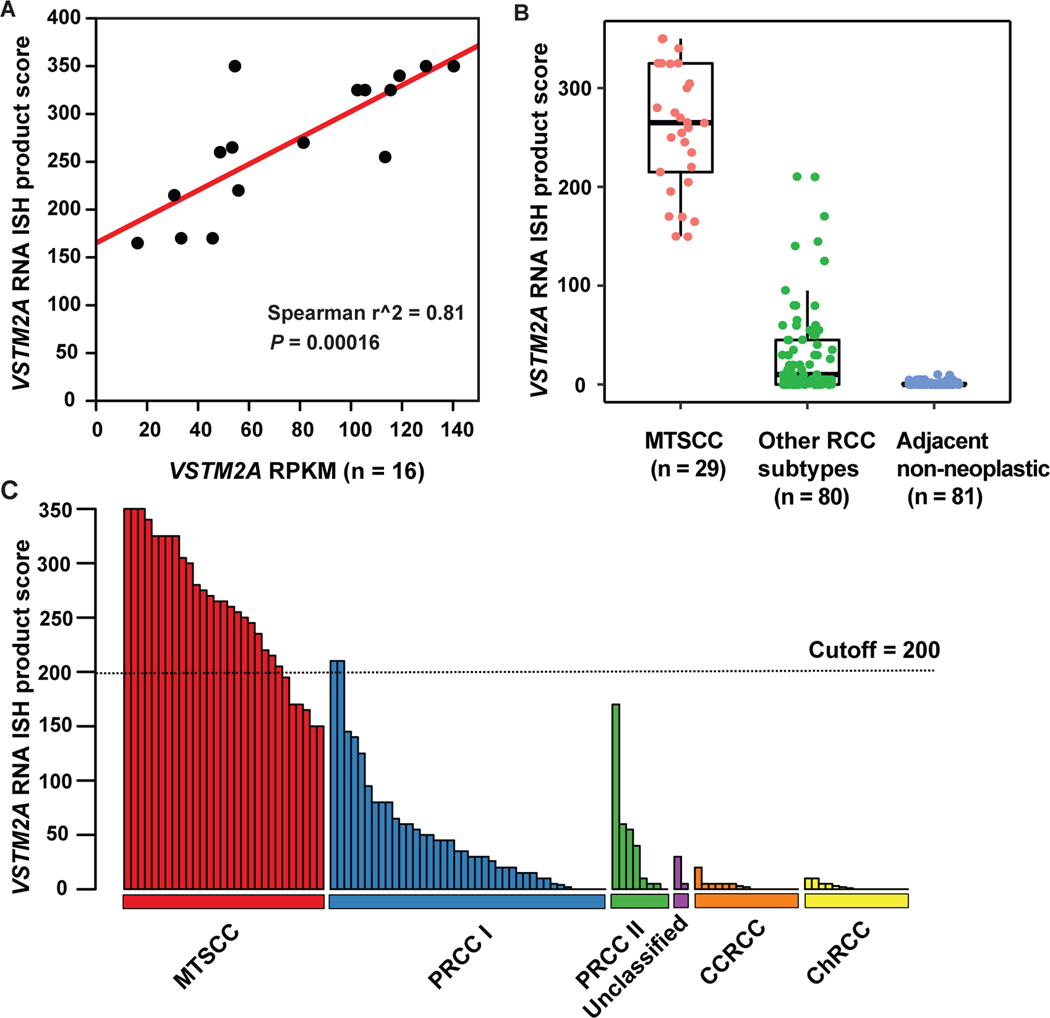
VSTM2A was highly expressed in MTSCC. (A) Correlation between VSTM2A gene expression (RPKM) and RNA ISH product score (n = 16, P = 0.00016). (B) VSTM2A expression was significantly higher in MTSCC (n = 29) compared to other RCC subtypes (n = 80, P < 0.0001) and adjacent non-neoplastic renal tissue (n = 81, P < 0.0001). (C) The majority of PRCC, unclassified RCC, CCRCC, and ChRCC tumors exhibited negative or low expression of VSTM2A. An ISH score cutoff of 200 was used to differentiate MTSCC tumors and non-MTSCC tumors. Two type 1 PRCC tumors with high expression of VSTM2A (ISH score > 200) had spindle cell components.
IRX5 is a Lineage-specific Biomarker for MTSCC
Classic MTSCC tumors (n = 29) showed moderate to high expression of IRX5 (mean ISH score = 150; range = 0 to 300) (Fig. 5A--D,D, Supplementary Fig. S6). The percentage of positive cells ranged from 0% to 100%. Four high grade MTSCC tumors demonstrated low expression of IRX5 (mean ISH score = 70; range = 50 to 120) (Supplementary Fig. S3B). The percentage of positive cells ranged from 40% to 60%. IRX5 was absent in the non-neoplastic renal cortex (Fig. 5E), but was expressed in certain medullary tubules, presumably the loop of Henle (Fig. 5F), as suggested by the nephron RNA-seq data (Fig 1E).
IRX5 expression in MTSCC by RNA ISH. (A, C) Classic MTSCC (H&E, 40X and 200X, respectively). (B, D) IRX5 expression in MTSCC by RNA ISH (40X and 200X, respectively). (E) Negative expression of IRX5 in renal cortex by RNA ISH (400X); inset: H&E (400X). (F) Certain tubules stained positive for IRX5 in renal medulla by RNA ISH (400X); inset: H&E (400X).
Classic type 1 PRCC tumors (n = 26) demonstrated low to moderate expression of IRX5 (mean ISH score = 57.5; range = 0 to 265; Figs. 6A--B).B). PRCC tumors with low-grade spindle cell foci (n = 14) also demonstrated low to moderate expression of IRX5 (mean ISH score = 75; range = 0 to 230) (Supplementary Figs. S7A-H). Type 2 PRCC tumors (n = 8) exhibited low to moderate expression of IRX5 (mean ISH score = 25; range = 0 to 130; Figs. 6C--D).D). The type 2 PRCC tumor, which showed heterogeneous expression of VSTM2A, also showed heterogeneous expression of IRX5 (ISH score = 110). The ISH scores for two unclassified RCC were 10 and 30, respectively. CCRCC (n = 15) and ChRCC tumors (n = 15) demonstrated negative or very low expression of IRX5 (mean ISH score = 1; range = 0 to 60; Figs. 6E--HH).
IRX5 expression in other RCC subtypes. (A) Type 1 PRCC (H&E, 200X). (B) Type 1 PRCC demonstrated low expression of IRX5 by RNA ISH (400X). (C) Type 2 PRCC (H&E, 200X). (D) Type 2 PRCC demonstrated low expression of IRX5 by RNA ISH (400X). (E) CCRCC (H&E, 200X). (F) CCRCC was negative for IRX5 expression by RNA ISH (400X). (G) ChRCC (H&E, 200X). (H) ChRCC was negative for IRX5 expression by RNA ISH (400X).
There was a strong correlation between IRX5 gene expression and RNA ISH product score (n=16; Spearman’s correlation coefficient r2 = 0.69, P = 0.00291, Fig. 7A). IRX5 expression was significantly higher in classic MTSCC tumors (n = 29) compared to other RCC subtypes (n = 80, P < 0.0001) and adjacent non-neoplastic renal tissues (n = 81, P < 0.0001, Fig. 7B). IRX5 RNA ISH product scores for all 109 tumors (four high-grade MTSCC were analyzed separately, as described above) are illustrated in Fig. 7C.
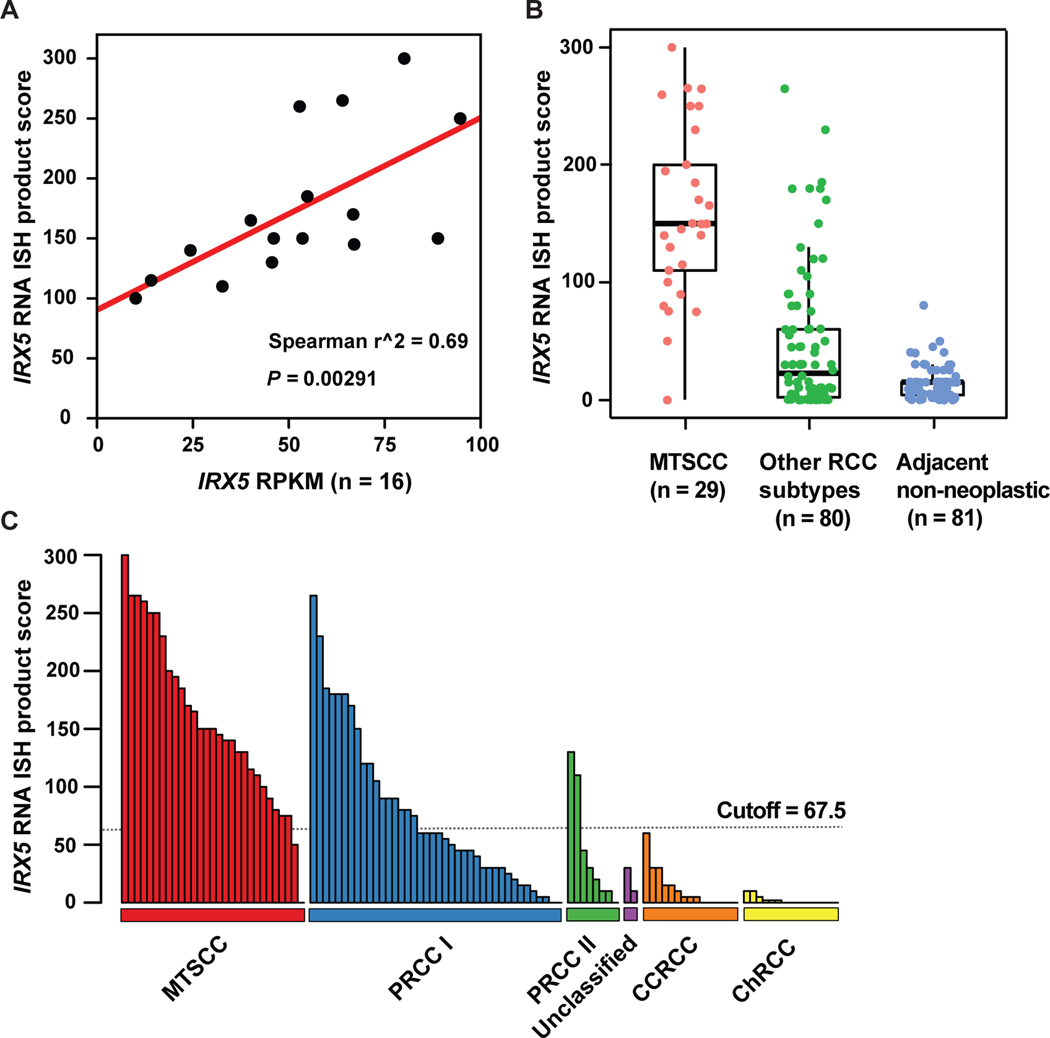
IRX5 RNA ISH product score in MTSCC and other RCC subtypes. (A) Correlation between IRX5 gene expression (RPKM) and RNA ISH product score (n = 16, P = 0.00291). (B) IRX5 expression was significantly higher in classic MTSCC (n = 29) compared to other RCC subtypes (n = 80, P < 0.001) and adjacent non-neoplastic renal tissue (n = 81, P < 0.001). (C) An ISH score cutoff of 67.5 was used to differentiate MTSCC tumors and non-MTSCC tumors.
Diagnostic performance of VSTM2A and IRX5 for MTSCC
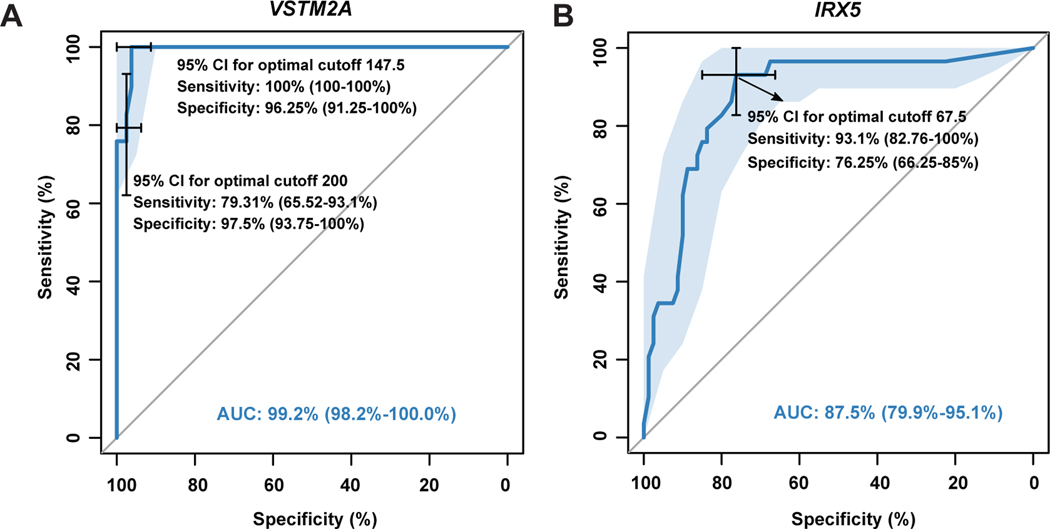
We created ROC curves in order to better evaluate the diagnostic value of VSTM2A and IRX5 expression in MTSCC, and to determine the cutoff ISH values with the best sensitivity and specificity relationship. Using a cutoff of 147.5 (ISH score), the sensitivity and specificity of VSTM2A for MTSCC were 100% and 96.25%, respectively (Fig. 8A), while a threshold of 200 yielded relatively lower sensitivity (79.31%) but higher specificity (97.5%) (Fig. 8A). Similar analysis on IRX5 data demonstrated that, using a cutoff of 67.5, the sensitivity and the specificity of IRX5 for MTSCC were 93.1% and 76.25%, respectively (Fig. 8B). In summary, VSTM2A expression (AUC: 99.2%) demonstrated better diagnostic efficacy than IRX5 (AUC: 87.5%).
DISCUSSION
In this study, we performed integrative analyses of RNA-seq data from TCGA index samples, MCTP RCC samples, and the Knepper dataset of microdissected rat nephrons. 1–3, 8, 21 This enabled us to investigate the MTSCC transcriptome and identify cancer- and lineage-specific biomarkers. Among the nominated markers, we selected VSTM2A and IRX5 for further experimental validation by RNA ISH on a comprehensive RCC cohort representing various subtypes (n = 113). Importantly, our results demonstrated that VSTM2A was highly expressed in MTSCC while showing either absent or low level expression in the vast majority of other RCC subtypes. We also found that IRX5 was a putative lineage-specific biomarker for MTSCC.
Clinically, MTSCC cases occasionally show extensive morphologic and immunohistochemical overlap with PRCC, especially PRCC with low-grade spindle cell foci.13, 14, 34 While some studies have suggested that MTSCC and PRCC are closely related,35 previous work from our group and others have demonstrated that these two RCC subtypes are distinct entities at the molecular level.2, 8, 9, 36 Our study of a multi-institutional MTSCC cohort revealed recurrent chromosomal losses and frequent biallelic alteration of Hippo pathway genes, resulting in increased YAP1 nuclear expression;8 however, YAP1 expression was not found to be of diagnostic use in differentiating MTSCC from PRCC in an independent study.9 The commonly utilized immunohistochemical biomarkers in pathology practice are relatively non-specific. Immunohistochemical staining with CK7 and AMACR may produce misleading results in differential diagnosis because both MTSCC and PRCC may be positive for CK7 and AMACR expression.14 While CD10 expression has been documented to be expressed at lower levels in MTSCC, this marker is relatively non-specific and not consistently valuable in this distinction.9, 14 Hence, the discovery that new markers, such as VSTM2A overexpression, to be sensitive and specific for MTSCC could increase our ability to accurately classify these tumors.
The expression patterns of VSTM2A have been explored. A recent study demonstrated that VSTM2A protein is expressed and secreted by committed preadipocytes, and affects both the amplification of BMP (bone morphogenetic protein) signaling and the expression of PPARG2 (peroxisome proliferator activated receptor gamma 2).37 This study also demonstrated a role for VSTM2A during adipocyte development with both in vitro and in vivo experiments, in which overexpression of this protein promoted adipogenesis while VSTM2A knockdown impaired this process. Our analysis of the GTEX data noted highly restricted VSTM2A expression in human brain samples, but the significance of this observation remains to be further characterized. To our knowledge, our study is the first to demonstrate that VSTM2A is overexpressed in MTSCC and could, therefore, be employed as a novel cancer-specific marker using RNA ISH. Unlike the traditional, relatively non-specific RCC markers (e.g. CK7, AMACR, and CD10), VSTM2A is nearly absent in non-neoplastic renal parenchyma and is specifically and homogeneously expressed only in MTSCC tumor cells. Hence, this expression pattern may prove to be clinically useful for accurately diagnosing MTSCC specimens. Future efforts should concentrate on developing a specific cell line model for MTSCC as to greatly facilitate characterizing the functional effects of VSTM2A over-expression in MTSCC.
In this study, the majority of MTSCC demonstrated VSTM2A expression at a level that was only rarely encountered in other renal tumors. Sets of cutoff points were established to better evaluate the diagnostic value of VSTM2A for MTSCC. With an ISH score cutoff of 147.5, VSTM2A expression demonstrated a high sensitivity (100%) and a high specificity (96.25%) for MTSCC. However, with the more practical and easily assessable ISH score cutoff of 200, VSTM2A expression demonstrated relatively lower sensitivity (79.31%) but higher specificity (97.5%). Hence, our results indicate that for an individual tumor with morphologic features that can be observed in either MTSCC or PRCC, high VSTM2A expression above an ISH score cutoff of 200 will support an interpretation of MTSCC. VSTM2A over-expression, may thus serve as a diagnostic marker to clinically distinguish MTSCC from PRCC with overlapping histologic features. Studies of additional cohorts would help validate these observations.
A prior study performed single nucleotide polymorphism (SNP) array on six high grade MTSCC cases.10 Similar to our previous findings,8 all six cases showed monosomy of chromosomes 1, 4, 6, 8, 9, 13, 14, 15, and 22, and absence of trisomy 7 and 17. The authors suggested modifying the definition of MTSCC to include cases with higher nuclear grade. In this study, we interrogated four of those MTSCC cases with high-grade cytological atypia10 and uncovered moderate expression of VSTM2A in all four cases, which further supports that the definition of MTSCC should be expanded to include a rare subset with higher nuclear grade. Since the number of high-grade MTSCC cases is low, additional cases are needed to further evaluate whether VSTM2A expression is associated with tumor grade.
In this study, two cases exhibited morphologic overlap with MTSCC but failed to harbor the characteristic chromosomal losses of MTSCC while lacking trisomy 7 and 17, highlighting the genomic heterogeneity observed among tumors with overlapping morphologic features. Both cases, assigned as unclassified RCC, showed very low expression of VSTM2A, emphasizing the diagnostic specificity of this biomarker.
The Iroquois genes were first identified in Drosophila because of their roles in the control of proneural and vein-forming gene expression.38 In various embryonic tissue types, Iroquois gene expression is spatially and temporally regulated by different signaling pathways, including Sonic Hedgehog, Wingless, Notch, epidermal growth factor receptor, and Hox signaling, which have all been implicated in tumorigenesis.39, 40 IRX1, IRX2, and IRX3 have been identified as an evolutionary conserved subset of IRX genes whose expression represents the earliest manifestation of intermediate compartment patterning in the developing vertebrate nephron.41 IRX5 is down- regulated by 1,25-Dihydroxyvitamin D3 in human prostate cancer and regulates apoptosis and the cell cycle in LNCaP prostate cancer cells.42 However, little is known about the role of IRX5 in the human kidney. Our study demonstrated that IRX5 was moderately to highly expressed in MTSCC at the mRNA level. When compared to VSTM2A expression, however, IRX5 expression demonstrated a high sensitivity (93.1%) but a low specificity (76.25%) for the diagnosis of MTSCC. The diagnostic value of IRX5 (AUC: 87.5%) was lower than VSTM2A (AUC: 99.2%) for detection of MTSCC in this study.
The phenotypic classification for MTSCC remains debatable.34, 35, 43, 44 Initially, this tumor was recognized as a distinctive subset of low-grade collecting duct carcinomas.43 In 2001, Parwani and colleagues44 formally described this entity and reported these tumors to be possibly related to the loop of Henle or distal convoluted tubule. In an attempt to identify the phenotypic origin for MTSCC, we performed an integrative analysis of the MCTP MTSCC RNA-seq samples and the Knepper dataset of microdissected rat nephrons.8, 21 IRX5 was previously identified to be specifically expressed in the loop of Henle in rats.21 Thus the observed IRX5 expression in MTSCC samples could be retained by the tumors differentiated from the cells within the loop of Henle, a region that was previously speculated to be associated with MTSCC.44 RNA ISH further validated that IRX5 was absent in the human non-neoplastic renal cortex, but was expressed in certain medullary tubules. Taken together, our results suggest that MTSCC displays an overlapping phenotypic expression pattern with the loop of Henle region of normal nephrons. Additional studies are needed to confirm these observations.
Our study successfully analyzed a relatively large cohort of clinically, morphologically, and molecularly confirmed MTSCC collected from multiple major academic institutions. However, our methods were constrained by certain limitations that should be considered when designing future studies. RNA ISH is a sensitive and specific tool for assessing gene expression in malignancies,45, 46 is a reliable and cost-effective alternative to RNA-seq for the detection of both VSTM2A and IRX5 markers, and can be easily applied in a laboratory or clinical setting. However, an important concern when implementing RNA ISH in the clinical environment is the RNA integrity of tissue samples. In this study, VSTM2A and IRX5 RNA ISH assays were performed on whole formalin-fixed, paraffin-embedded tumor sections, which allowed us to evaluate the expression pattern of these two markers. However, four out of the 117 cases did not pass quality control due to the old age of the tissue blocks. Another potential limitation is that we did not perform RNA ISH on core biopsy specimens in this study; follow-up studies may find it helpful to assess the diagnostic utility of RNA ISH on core biopsies. Furthermore, we used a semi-quantitative scoring method (ISH score) to interrogate VSTM2A expression. However, the method of semi-quantification is inherently subjective and produces ordinal rather than continuous variable data. Additional studies are needed to establish the reproducibility of our semi-quantitative approach to VSTM2A ISH evaluation before this method can be incorporated into routine clinical practice. To reduce between-laboratory variability, we suggest using human control slides containing cultured cell pellets, such as human NCI-H660 cells (Supplementary Figs. S8A-C), as positive controls.
In summary, our results demonstrate VSTM2A over-expression to be a sensitive and specific marker for MTSCC. VSTM2A over-expression by RNA ISH may serve as a diagnostic marker to clinically distinguish MTSCC from PRCC with overlapping histologic features. Furthermore, our results suggest that MTSCC displays an overlapping phenotypic expression pattern with the loop of Henle region.
Supplementary Material
Supplemental Data File (.doc, .tif, pdf, etc.)_1
Figure S1 Representative photomicrographs of samples showing different RNA in situ hybridization (ISH) intensity (400X magnification). (A) RNA ISH staining on a section of human brain. (B) Score 0 = no staining or less than 1 dot per 10 cells. (C) Score 1 = 1 to 3 dots per cell. (D) Score 2 = 4 to 9 dots per cell (few or no dot clusters). (E) Score 3 = 10 to 15 dots per cell (less than 10% in dot clusters). (F) Score 4 = greater than 15 dots per cell (more than 10% in dot clusters).
Supplemental Data File (.doc, .tif, pdf, etc.)_2
Figure S2 VSTM2A RNA ISH staining in additional MTSCC cases. (A, E, I) H&E sections of MTSCC (200X). (B, F, J) PPIB staining, used as the positive control (400X). (C, G, K) Positive VSTM2A RNA ISH with punctate brown staining in MTSCC. (D, H, L) DapB staining, used as the negative control (400X).
Supplemental Data File (.doc, .tif, pdf, etc.)_3
Supplemental Data File (.doc, .tif, pdf, etc.)_4
Figure S3 (A) Comparison of VSTM2A expression between classic and high-grade MTSCC tumors. (B) Comparison of IRX5 expression between classic and high-grade MTSCC tumors.
Supplemental Data File (.doc, .tif, pdf, etc.)_5
Figure S4 VSTM2A expression in type 1 PRCC with low-grade spindle cell foci. The neoplasm contains a papillary epithelioid area (left) merging with a spindled area (right) (A, 100X; C, 200X). Tumor cells were negative for VSTM2A expression in both the papillary (B) and the spindled area (D) (400X). (E, G) Another example of type 1 PRCC with low-grade spindle cell foci (200X). Tumor cells exhibited low expression of VSTM2A in both the papillary (F) and the spindled area (H) (400X). Inset in G: Dual-color fluorescence in situ hybridization (FISH) revealed trisomy of chromosomes 7 and 17, as demonstrated by three orange signals (CEP7) and three green signals (CEP17).
Supplemental Data File (.doc, .tif, pdf, etc.)_6
Figure S5 (A, C) H&E sections of two unclassified RCC cases (200X). (B, D) Both tumors showed very low expression of VSTM2A (400X).
Supplemental Data File (.doc, .tif, pdf, etc.)_7
Figure S6 IRX5 RNA ISH staining in additional MTSCC cases. (A, E, I) H&E sections of MTSCC (200X). (B, F, J) PPIB staining, used as the positive control (400X). (C, G, K) IRX5 expression in MTSCC. (D, H, L) DapB staining, used as the negative control (400X).
Supplemental Data File (.doc, .tif, pdf, etc.)_8
Figure S7 IRX5 expression in type 1 PRCC with low-grade spindle cell foci. (A, C) A type 1 PRCC containing a papillary epithelioid area and a spindled area (200X). (B, D) Tumor cells were negative for IRX5 expression in both areas (400X). (E, G) Another example of type 1 PRCC with low-grade spindle cell foci (200X). (F, H) Tumor cells exhibited low expression of IRX5 in both the papillary area and the spindled area (400X).
Supplemental Data File (.doc, .tif, pdf, etc.)_9
Figure S8 (A) Box plot showing expression of VSTM2A in all cancer cell lines, grouped by cancer types. BLCA, bladder urothelial carcinoma; BRCA, breast invasive carcinoma; CESC, cervical squamous cell carcinoma and endocervical adenocarcinoma; COAD, colon adenocarcinoma; DLBC, diffuse large B-cell lymphoma; ESCA, esophageal carcinoma; HNSC, head and neck squamous cell carcinoma; KIRC, kidney renal clear cell carcinoma; LCLL, chronic lymphocytic leukemia; LGG, brain lower grade glioma; LIHC, liver hepatocellular carcinoma; LUSC, lung squamous cell carcinoma; MESO, mesothelioma; MM, multiple myeloma; OV, ovarian serous cystadenocarcinoma; PAAD, pancreatic adenocarcinoma; PRAD, prostate adenocarcinoma; SARC, sarcoma; SKCM, skin cutaneous melanoma; STAD, stomach adenocarcinoma; THCA, thyroid carcinoma; UCEC, uterine corpus endometrial carcinoma; CCLE, Cancer Cell Line Encyclopedia. (B) Box plot showing expression of VSTM2A in representative cancer cell lines. (C) VSTM2A RNA ISH staining in NCI-H660 cell line (400X). RNA ISH score is 70.
ACKNOWLEDGMENTS
We thank Mandy Davis and Marta Hernadi-Muller for technical assistance, Sisi Gao for assistance with manuscript editing and submission.
Footnotes
Conflicts of Interest: None
REFERENCES
Full text links
Read article at publisher's site: https://doi.org/10.1097/pas.0000000000001150
Read article for free, from open access legal sources, via Unpaywall:
https://www.ncbi.nlm.nih.gov/pmc/articles/PMC7903805
Citations & impact
Impact metrics
Citations of article over time
Alternative metrics
Article citations
Contemporary review of papillary renal cell carcinoma-current state and future directions.
Virchows Arch, 485(3):391-405, 12 Jul 2024
Cited by: 0 articles | PMID: 38995356
Review
Expression of L1 Cell Adhesion Molecule, a Nephronal Principal Cell Marker, in Nephrogenic Adenoma.
Mod Pathol, 37(8):100540, 18 Jun 2024
Cited by: 0 articles | PMID: 38901674
Comprehensive proteogenomic characterization of rare kidney tumors.
Cell Rep Med, 5(5):101547, 03 May 2024
Cited by: 0 articles | PMID: 38703764 | PMCID: PMC11148773
Renal epithelioid angiomyolipomas overexpress TFE3 and the TFE3-regulated gene TRIM63 in the absence of TFE3 rearrangement.
Virchows Arch, 485(3):471-478, 07 Jul 2024
Cited by: 0 articles | PMID: 38971946
Papillary Renal Cell Carcinoma: A Review of Prospective Clinical Trials.
Curr Treat Options Oncol, 24(9):1199-1212, 06 Jul 2023
Cited by: 1 article | PMID: 37407886
Review
Go to all (18) article citations
Data
Data behind the article
This data has been text mined from the article, or deposited into data resources.
BioStudies: supplemental material and supporting data
RefSeq - NCBI Reference Sequence Database (2)
- (1 citation) RefSeq - NM_005853.5
- (1 citation) RefSeq - NM_182546.3
Similar Articles
To arrive at the top five similar articles we use a word-weighted algorithm to compare words from the Title and Abstract of each citation.
Distinct Genomic Copy Number Alterations Distinguish Mucinous Tubular and Spindle Cell Carcinoma of the Kidney From Papillary Renal Cell Carcinoma With Overlapping Histologic Features.
Am J Surg Pathol, 42(6):767-777, 01 Jun 2018
Cited by: 20 articles | PMID: 29462091 | PMCID: PMC6685145
Single nucleotide polymorphism (SNP) chromosomal microarray as a diagnostic tool for mucinous tubular and spindle cell carcinoma: A validation study.
Hum Pathol, 146:57-65, 12 Apr 2024
Cited by: 0 articles | PMID: 38615998
Mucinous spindle and tubular renal cell carcinoma: analysis of chromosomal aberration pattern of low-grade, high-grade, and overlapping morphologic variant with papillary renal cell carcinoma.
Ann Diagn Pathol, 19(4):226-231, 06 May 2015
Cited by: 16 articles | PMID: 26009022
[Two Cases of Metastatic and Recurrent Non-Clear Cell Renal Cell Carcinoma Re-Diagnosed as Renal Mucinous Tubular and Spindle Cell Carcinoma during Long-Term Follow-Up].
Hinyokika Kiyo, 64(3):111-115, 01 Mar 2018
Cited by: 2 articles | PMID: 29684960
Review
Funding
Funders who supported this work.
NCI NIH HHS (3)
Grant ID: T32 CA140044
Grant ID: P50 CA186786
Grant ID: P30 CA008748
