Abstract
Free full text

PAK4 inhibition improves PD-1 blockade immunotherapy
Abstract
Lack of tumor infiltration by immune cells is the main mechanism of primary resistance to programmed cell death protein 1 (PD-1) blockade therapies for cancer. It has been postulated that cancer cell-intrinsic mechanisms may actively exclude T cells from tumors, suggesting that the finding of actionable molecules that could be inhibited to increase T cell infiltration may synergize with checkpoint inhibitor immunotherapy. Here, we show that p21-activated kinase 4 (PAK4) is enriched in non-responding tumor biopsies with low T cell and dendritic cell infiltration. In mouse models, genetic deletion of PAK4 increased T cell infiltration and reversed resistance to PD-1 blockade in a CD8 T cell-dependent manner. Furthermore, combination of anti-PD-1 with the PAK4 inhibitor KPT-9274 improved anti-tumor response compared with anti-PD-1 alone. Therefore, high PAK4 expression is correlated with low T cell and dendritic cell infiltration and a lack of response to PD-1 blockade, which could be reversed with PAK4 inhibition.
Immune checkpoint blockade therapies have significantly altered the current landscape of cancer treatment1. Programmed cell death protein 1 (PD-1) blockade induces major and durable antitumor response by releasing the PD-1/programmed death-ligand 1 checkpoint that blocks the effector functions of anti-tumor T cells2. However, this approach has limited activity in patients with cancers that lack pre-existing immune cell infiltration, which is the primary mechanism of resistance to PD-1 blockade therapy3–6. Exclusion of tumor infiltration by T cells could be mediated by several mechanisms that result in failure to attract or retain antigen-specific T cells in tumors, such as a lack of antigenic mutations, alterations in the antigen processing machinery, loss of human leukocyte antigen expression, and disruption of the interferon (IFN) signaling pathway that is needed to amplify the anti-tumor T cell response7. In addition, it has been proposed that cancer cell-intrinsic mechanisms such as oncogenic mitogen-activated protein kinase, phosphoinositide 3-kinase (PI3K) and WNT signaling pathways may actively exclude T cells from tumors8–11. In particular, it has been reported that alterations in the WNT/β-catenin signaling pathway are associated with impaired dendritic cell recruitment and immune cell exclusion in melanoma and other tumor types such as colorectal cancer12–14. These observations necessitate a clearer understanding of how WNT signaling causes immune evasion, as well as identification of actionable WNT-related targets that can be exploited to reverse T cell exclusion and overcome primary resistance to PD-1 blockade therapy.
To address this issue, we compared the transcriptional landscape of tumor biopsies from patients with advanced melanoma treated with anti-PD-1 immunotherapy. Here, we report on p21-activated kinase 4 (PAK4) as an actionable target that could be inhibited in combination with immune checkpoint blockade therapies to increase immune cell infiltration and overcome primary resistance to these therapies. PAK4 is a kinase known to be involved in tumorigenesis that directly binds and phosphorylates a specific site in β-catenin to activate WNT signaling15–18. Our work shows that: (1) PAK4 expression is enriched in non-responding tumor biopsies with low immune cell infiltration; (2) genetic and pharmacologic PAK4 inhibition improve response to PD-1 blockade in vivo; and (3) this provides a novel therapeutic strategy that may improve the efficacy of immune checkpoint inhibitor therapies.
Results
Resistance to PD-1 blockade is associated with lack of immune cell infiltration.
To identify drivers of resistance to immunotherapy, we generated transcriptome data from biopsies of 41 patients with advanced melanoma treated with PD-1-blocking antibody. We sequenced a total of 27 baseline and 33 on-treatment biopsies, including 14 non-responding and 13 responding samples (Fig. 1a and Supplementary Table 1). We removed two samples because CD8A gene expression did not agree with CD8 protein levels measured using immunohistochemistry (IHC) (Supplementary Fig. 1a–c), and four samples based on their outlier keratinocyte biomarker gene expression of KRT15 and KRT5, which indicated that these biopsies mostly consisted of keratinocytes and did not have enough melanoma content19 (Supplementary Fig. 1d,e). On-treatment biopsies taken from patients with a response to PD-1 blockade showed increased expression of a CD8 T cell effector signature including CXCL9, CXCL10, GZMB, PRF1, GZMA, CD8A, TBX21, IFNG and TNF (Fig. 1b; P = 1 × 10⁻⁴), consistent with previous data2–5. Paired t-tests with matched samples also confirmed that only biopsies from patients with a clinical response to PD-1 blockade exhibited significant increases in the expression of markers of immune response (Extended Data Fig. 1). We applied gene set enrichment analysis (GSEA) using the Gene Ontology gene sets to demonstrate that, unlike non-responding biopsies, the genes significantly increased in on-treatment responding biopsies were enriched in signatures associated with an adaptive immune response (Fig. 1c). We further identified immune genes that were upregulated in on-treatment responding biopsies relative to on-treatment non-responding biopsies. As expected, CD8A, TNF, GZMA and IFNG, among other immune genes, were expressed at higher levels in biopsies from patients who responded to PD-1 blockade therapy (Fig. 1d and Extended Data Fig. 1). To estimate the relative abundances and diversity of the different immune cells present in the tumor biopsies, we performed RNA sequencing (RNA-Seq)-based immune cell deconvolution using the microenvironment cell populations counter (MCP-counter)20. Responding biopsies were significantly infiltrated with T cells, CD8 T cells, myeloid dendritic cells and natural killer cells compared with non-responding tumor biopsies (Fig. 1e and Extended Data Fig. 1). Altogether, on-treatment biopsies from patients with a response to therapy present the characteristic features of an adaptive immune response, while on-treatment biopsies from patients without a response mostly lack T cell infiltration.
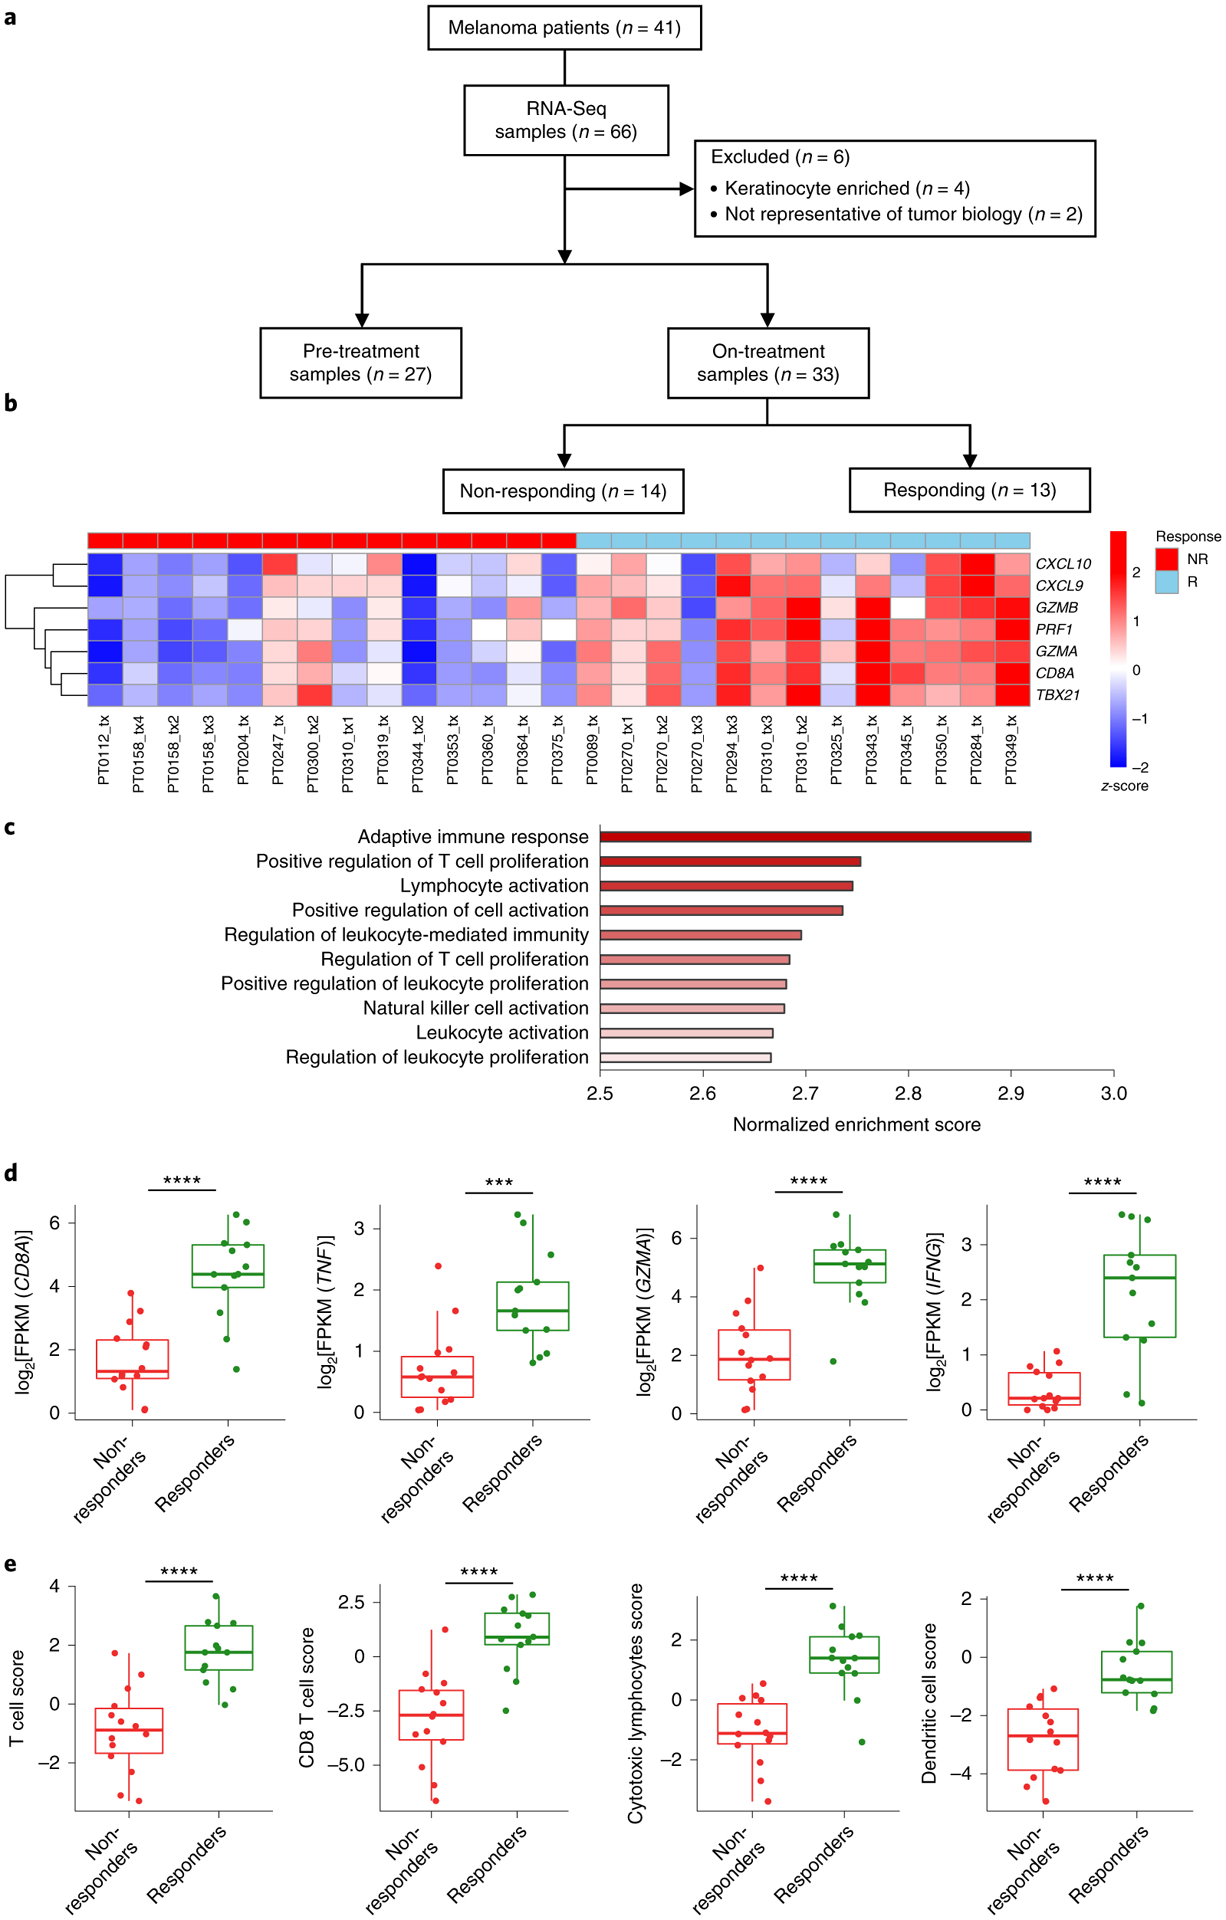
a, Schematic of the analysis of tumor biopsies from patients with metastatic melanoma included in the RNA-Seq studies. b, Heatmap of a CD8 T cell effector signature for on-treatment biopsies (non-responding (NR; red; n = 14) and responding (R; blue; n = 13)). P = 1 × 10⁻⁴. c, GSEA of on-treatment responding biopsies showing the top signatures for the Gene Ontology gene set. d, Differences in gene expression between non-responding (n = 14) and responding biopsies (n = 13) for CD8A (P = 1.45 × 10⁻⁵), TNF (P = 6.04 × 10⁻⁴), GZMA (P = 6.76 × 10⁻⁶) and IFNG (P = 1.11 × 10⁻⁴). e, Differences in immune population scores between non-responding and responding on-treatment biopsies (n = 13), including T cell score (P = 1.21 × 10⁻⁵), CD8 T cell score (P = 2.04 × 10⁻⁵), cytotoxic lymphocytes score (P = 1.14 × 10⁻⁵) and dendritic cell score (P = 1.90 × 10⁻⁵). From top to bottom, box plots in d and e define the maximum, third quartile, median, first quartile and minimum values. P values were determined by two-sided Welch’s t-test (***P < 0.001; ****P < 0.0001).
PAK4 expression is enriched in poorly infiltrated tumor samples and constitutes a potential target to improve PD-1 blockade immunotherapies.
Because immune cell exclusion was a common factor among non-responding biopsies, we sought to determine tumor-intrinsic drivers of T cell exclusion by comparing immune-infiltrated tumor biopsies with immune-excluded ones. Differential gene expression analysis revealed that only 18 overlapping genes were enriched in biopsies with both a low dendritic cell score and a low T cell score (log2[fold change] > 1 and false discovery rate < 5 × 10⁻⁵; Supplementary Table 2c). Among these genes, we were interested in studying an actionable gene whose function could be blocked by a drug. PAK4 stood out among the list of 18 genes as its expression was consistently higher in tumor biopsies with low infiltration with dendritic cells (adjusted P value (q) < 0.0001) and T cells (q < 0.0001) (Fig. 2a,,cc and Supplementary Table 2a), as well as in tumor biopsies with low expression of CD8A, TNF and IFNG (Fig. 2c and Supplementary Table 2b). The correlation with low intratumoral T cell and dendritic cell infiltration was validated in a published cohort of 99 biopsies analyzed by RNA-Seq5 (Fig. 2b). Furthermore, tumors with high expression of PAK4 were enriched and positively correlated with a signature of immune cell exclusion reported by Jerby-Arnon et al.6, based on analysis of 33 melanoma biopsies using single-cell RNA-Seq (Extended Data Fig. 2a,,b).b). PAK4 is a serine/threonine kinase that functions downstream of the small GTPases CDC42 and RAC, and plays an important role in several signaling pathways involved in tumorigenesis, including a known function of phosphorylating β-catenin, and shuttling with it into the nucleus to activate the WNT/β-catenin pathway15–18,21. This function of PAK4 seemed relevant based on previous work by Spranger et al.11 showing that tumor-intrinsic β-catenin signaling can impair T cell infiltration in melanoma.

a,b, Volcano plots derived from differential gene expression analysis between the upper and lower quartiles of the dendritic cell score, using both pre- and on-treatment samples. PAK4 expression was enriched in the samples with low dendritic cell scores in our UCLA cohort (a; n = 30 biopsies; q = 1.19 × 10⁻⁵), as well as in the Riaz et al.5 validation cohort (b; n = 50 biopsies; q = 1.59 × 10⁻¹¹). c, PAK4 expression was also enriched in samples with low T cell infiltration (q = 2.74 × 10⁻⁷), and low expression of CD8A (q = 9.08 × 10⁻⁹), TNF (q = 6.67 × 10⁻¹²) and IFNG (q = 1.9 × 10⁻⁶) (n = 15 biopsies per group for each comparison). In a–c, P values were calculated using the negative binomial generalized linear model fitting and Wald significance test, while q values were obtained by applying the Benjamini–Hochberg method. d, PAK4 expression negatively correlates with log2[FPKM] expression of the known immune markers CD8A (r = −0.54; P = 7.95 × 10⁻⁶), TNF (r = −0.69; P = 1.12 × 10⁻⁹), GZMA (r = −0.59; P = 7.95 × 10⁻⁷) and PRF1 (r = −0.41; P = 6.20 × 10⁻⁴), as well as the different immune populations assessed using MCP-counter: T cells (r = −0.62; P = 1.04 × 10⁻⁷), CD8 T cells (r = −0.55; P = 5.25 × 10⁻⁶), cytotoxic lymphocytes (r = −0.46; P = 1.90 × 10⁻⁴) and dendritic cells (r = −0.49; P = 6.60 × 10⁻⁵) (n = 60 biopsies for all correlations). Correlations were calculated applying Pearson’s correlation coefficient test. e, Images from biopsies of two representative patients of non-responding/low T cell infiltration (top) and responding/high T cell infiltration (bottom). Slides were stained with S100, PAK4 and CD8. The results showed co-localization of PAK4 and S100, and validation of the exclusivity between PAK4 and CD8 expression. Scale bars: 100 μm.
PAK4 negatively correlated with immune markers of an active CD8 T cell response, including CD8A, TNF, GZMA and PRF1, as well as with transcriptome signatures of different immune cell populations, such as T cells, CD8 T cells, cytotoxic T cells and dendritic cells, in both our cohort and the Riaz et al.5 validation cohort (Fig. 2d and Extended Data Fig. 2c). To determine whether PAK4 was expressed by melanoma cancer cells, we performed IHC on on-treatment tumor biopsies. Indeed, PAK4 co-localized with the melanoma marker S100 (Fig. 2e and Extended Data Fig. 2d). In addition, IHC analysis validated the inverse correlation between PAK4 and CD8 T cell infiltration observed by RNA-Seq (Fig. 2e). Overall, our data suggest that tumor-intrinsic PAK4 expression is associated with a lack of immune cell infiltration, and constitutes a potential target to overcome PD-1 blockade resistance.
PAK4 expression correlates with WNT/β-catenin pathway activation in melanoma tumor biopsies and regulates its activation in vitro.
Given the evidence relating WNT signaling, immune infiltration and a lack of response to checkpoint blockade immunotherapies in melanoma and other solid tumors, and consistent with the known relationship between PAK4 and WNT signaling15–18,21, we further investigated the role of PAK4 in the β-catenin pathway using clinical tumor samples. Tumor biopsies with high PAK4 expression had increased levels of MYC and CTNNB1 compared with tumor biopsies with low PAK4 expression (Fig. 3a). Tumors with high expression of PAK4 were also enriched for and positively correlated with a previously reported WNT signature that includes APC, MYC, CTNNB1, DKK2 and VEGFA12 (Fig. 3b). Furthermore, IHC analysis of the on-treatment tumor biopsies also showed that β-catenin co-localized with PAK4 (Fig. 3c). Of note, the PAK4 overlap with β-catenin was higher in the two tumor biopsies with low T cell infiltration, suggesting that there may be a dual requirement of β-catenin and PAK4 to induce a T cell-excluded phenotype (Extended Data Fig. 2e).
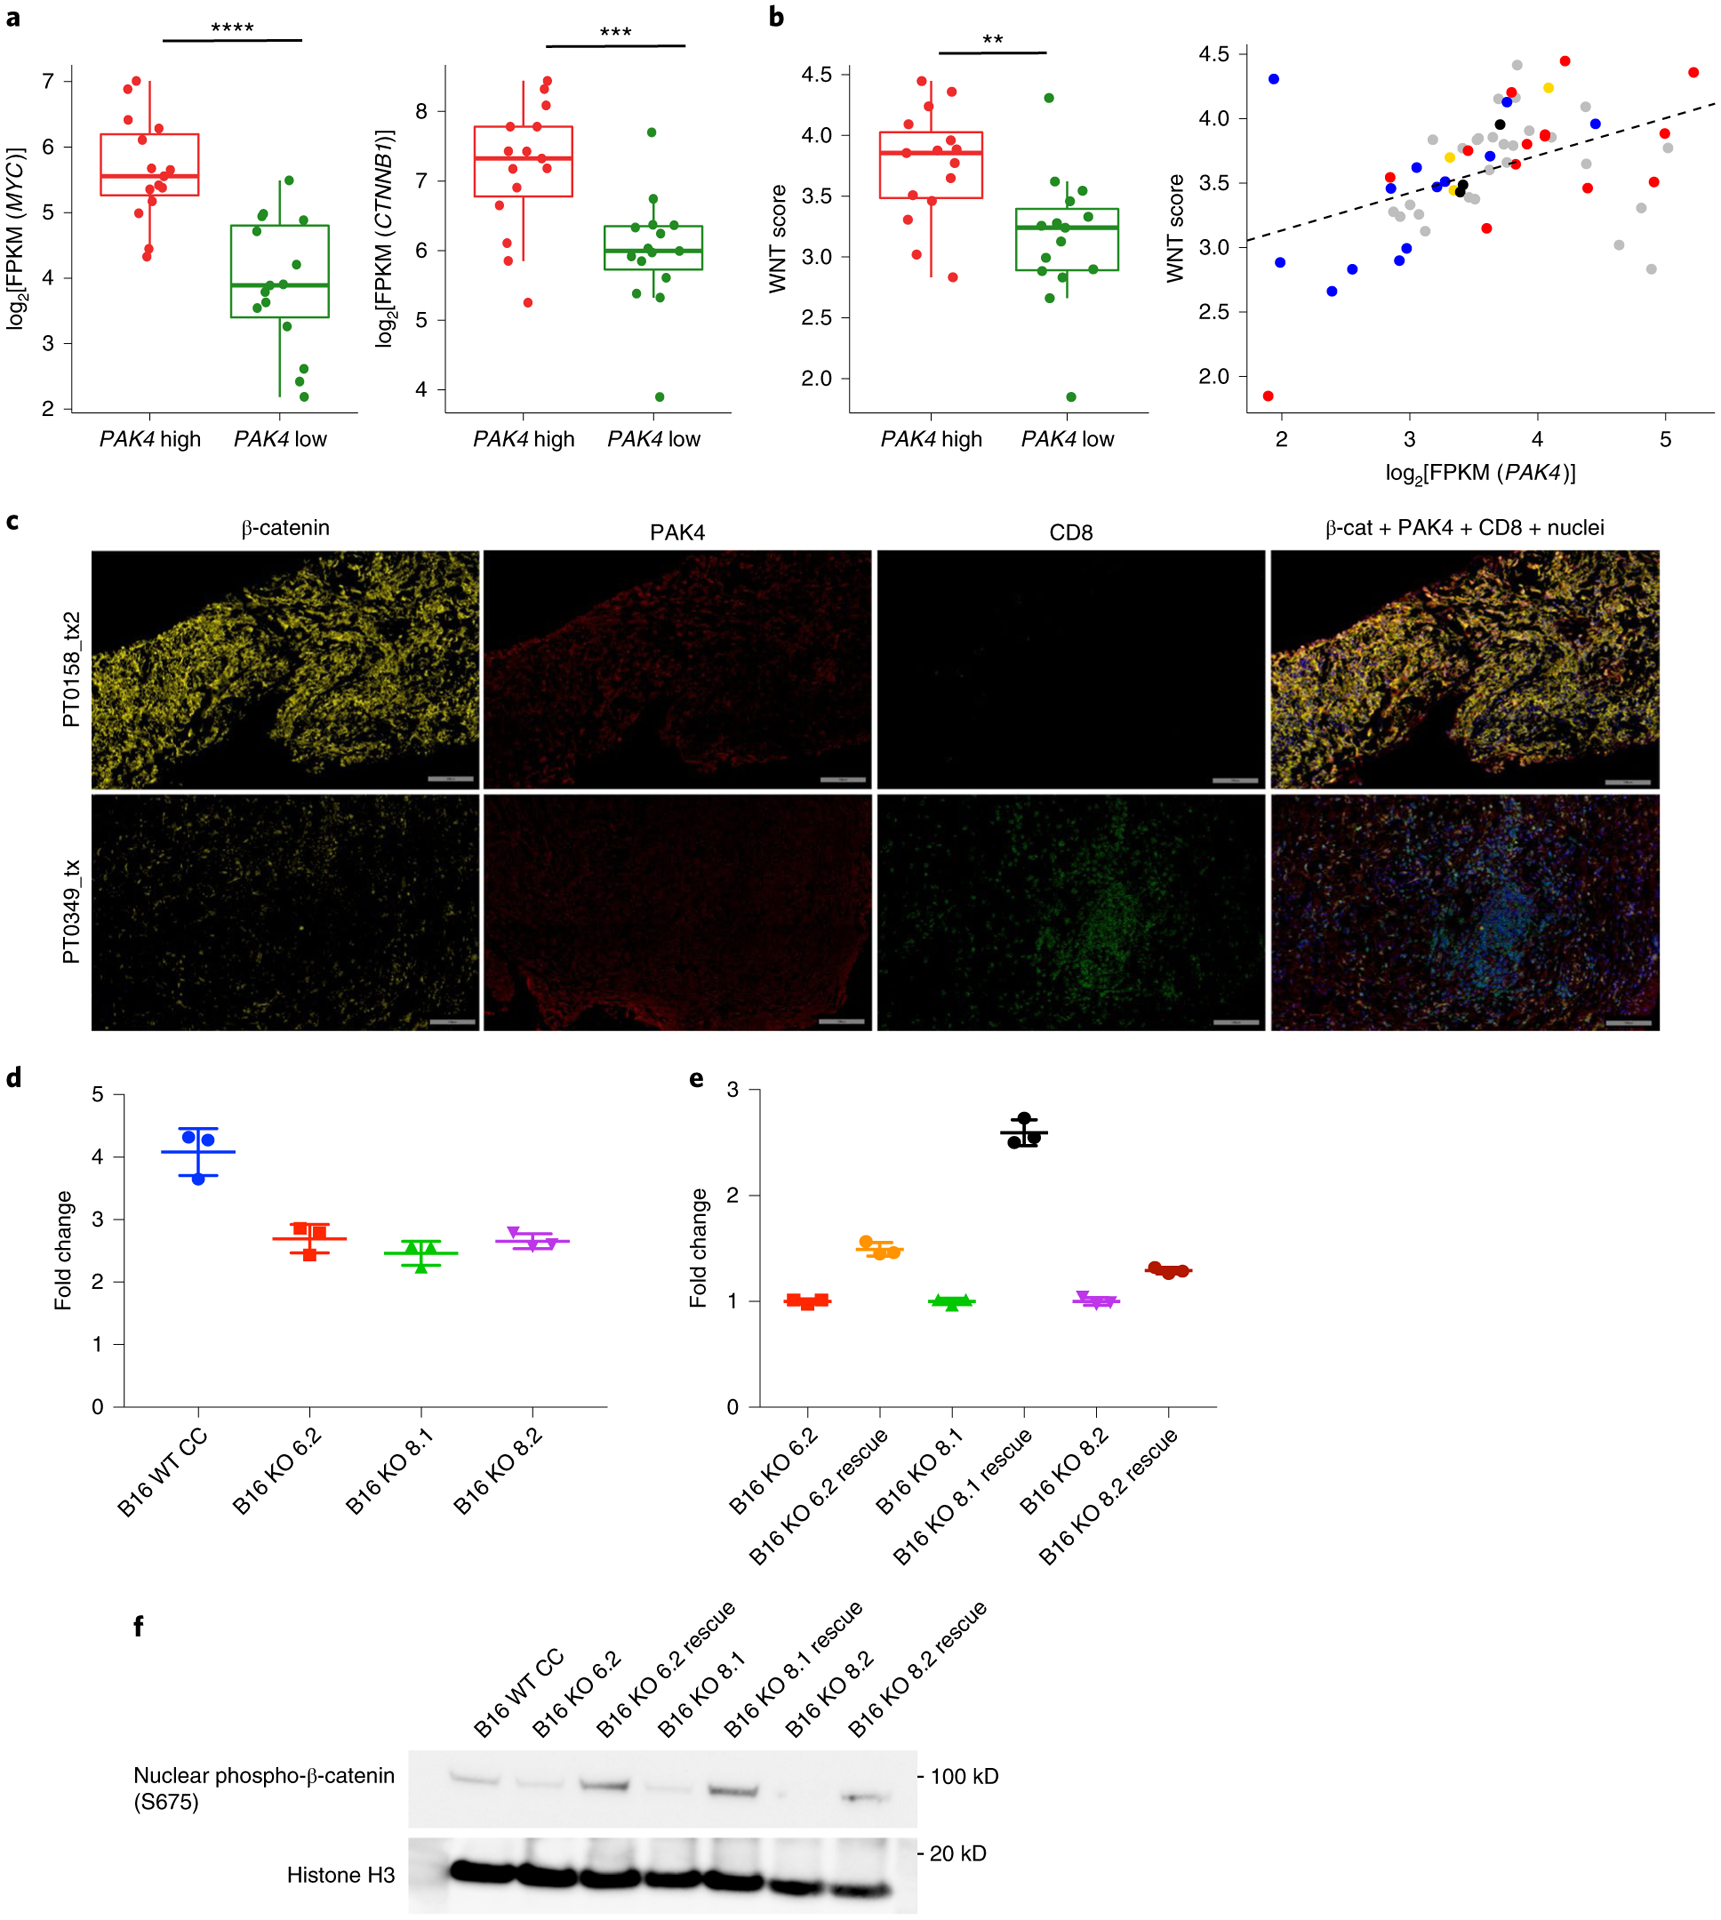
a, Comparison of MYC (P = 1.32 × 10⁻⁵) and β-catenin (CTNNB1; P = 7.00 × 10⁻⁴) log2[FPKM] expression values between tumor biopsies within the upper (n = 15) and lower (n = 15) quartile of PAK4 expression using the UCLA cohort. b, Left: comparison of WNT scores (P = 3 × 10⁻³) between tumor biopsies within the upper (n = 15) and lower (n = 15) quartile of PAK4 expression. Right: correlation (n = 60; r = 0.45; P = 2.96 × 10⁻⁴) between WNT scores and log2[FPKM] PAK4 expression values (blue: responders; red: non-responders; yellow: stable disease; gray: pre-treatment). The WNT score was obtained based on the geometric mean of the following WNT-related genes: APC, MYC, CTNNB1, DKK2 and VEGFA. In a and b, P values were determined by two-sided Welch’s t-test (a and b (left)) and Pearson’s correlation coefficient (b (right)) (**P < 0.01; ***P < 0.001; ****P < 0.0001). From top to bottom, box plots show the maximum, third quartile, median, first quartile and minimum values. c, Images from biopsies of two representative patients of non-responding/low T cell infiltration (top) and responding/high T cell infiltration (bottom). Slides were stained with β-catenin, PAK4 and CD8. Scale bars: 100 μm. d,e, Topflash WNT activity assays indicating that B16 PAK4 KO cells failed to upregulate WNT signaling as high as PAK4 CRISPR control WT cells (d; P = 0.0054 for B16 WT CRISPR control (CC) versus B16 KO 6.2; P = 0.0026 for B16 WT CC versus B16 KO 8.1; P = 0.0033 for B16 WT CC versus B16 KO 8.2), while rescuing PAK4 expression increased basal WNT activity (e; P = 0.0002 for B16 KO 6.2 versus B16 KO 6.2 rescue; P < 0.0001 for B16 KO 8.1 versus B16 KO 8.1 rescue; P = 0.0004 for B16 KO 8.2 versus B16 KO 8.2 rescue) (n = 3 technical replicates per group). The results are representative of three independent experiments. In d and e, data represent means ± s.e.m. and the results were compared by two-tailed unpaired t-test. f, Immunoblot for β-catenin S675 phosphorylation. Phosphorylation levels were decreased in B16 PAK4 KO cells compared with PAK4 WT cells and restored in PAK4 rescue cell lines. The results are representative of three independent experiments. Source data are available for d–f.
To directly investigate the impact of PAK4 deletion on WNT signaling, we first generated PAK4 knockout (KO) sublines of the murine melanoma B16 using CRISPR–Cas9 (three sublines: B16 KO 6.2, B16 KO 8.1 and B16 KO 8.2; Extended Data Fig. 3a–d). To quantify WNT signaling activation, B16 PAK4 KO cells were transfected with the Topflash luciferase reporter, which is under the control of consensus T cell factor-binding sites22,23. Whereas Wnt-3a exposure induced the Topflash luciferase activity in B16 wild-type (WT) CRISPR control cells, the induction of Topflash luciferase activity by Wnt-3a was reduced in B16 PAK4 KO cells (Fig. 3d and Extended Data Fig. 4a). Rescuing WT PAK4 expression in B16 PAK4 KO cells increased baseline WNT activity (Fig. 3e and Extended Data Fig. 3e), although PAK4 deletion did not affect WNT activity at steady state (Extended Data Fig. 4b). In addition, PAK4 deletion decreased nuclear β-catenin phosphorylation at serine 675 (S675), which was restored in PAK4 rescue cell lines (Fig. 3f). Of note, neither PAK4 deletion nor overexpression affected the levels of β-catenin nuclear protein (Extended Data Fig. 4c). Moreover, PAK4 inhibition with the dual PAK4 and nicotinamide phosphoribosyl-transferase (NAMPT) inhibitor KPT-9274 (refs.24–27) recapitulated the results observed with the B16 PAK4 KO clones as it diminished nuclear S675 β-catenin phosphorylation and decreased sensitivity to Wnt-3a, while it did not affect WNT activity at steady state, nor nuclear β-catenin protein levels (Extended Data Fig. 5a–c). Furthermore, B16 PAK4 KO cell lines decreased tyrosinase expression (Extended Data Fig. 5d) and lost their pigmentation when cultured over time (Extended Data Fig. 5e)—a phenotype that is consistent with the suggested role of PAK4 in melanogenesis and the β-catenin/MITF (microphthalmia-associated transcription factor) pathway17. Taken together, our results validate the association between PAK4 expression and WNT/β-catenin pathway activation, and provide evidence that genetic deletion and pharmacological inhibition of PAK4 impair Wnt/β-catenin pathway signaling in vitro.
PAK4 negatively correlates with immune cell infiltration across human cancers.
We then investigated whether the association between PAK4 expression and the lack of T cell infiltration in melanoma tumor biopsies could be expanded to other tumor types. To do so, we analyzed transcriptome data from 32 different cancer types in The Cancer Genome Atlas (TCGA), and calculated the correlation between PAK4 expression and T cell, cytotoxic T cell and dendritic cell scores generated using MCP-counter20 in all of the samples for each cancer type. In addition to cutaneous melanoma, we observed a negative correlation with T cell infiltration in the majority of cancer types (18 out of 32), including cancers that are notoriously resistant to anti-PD-1 therapy, such as prostate cancer, adrenocortical carcinoma, germ cell cancers and glioblastoma multiforme (Fig. 4a and Supplementary Table 3). In line with published data, one of the strongest negative correlations was in pancreatic cancer, where a pan-PAK inhibitor had previously been shown to enhance anti-tumor immune response in a preclinical model28.
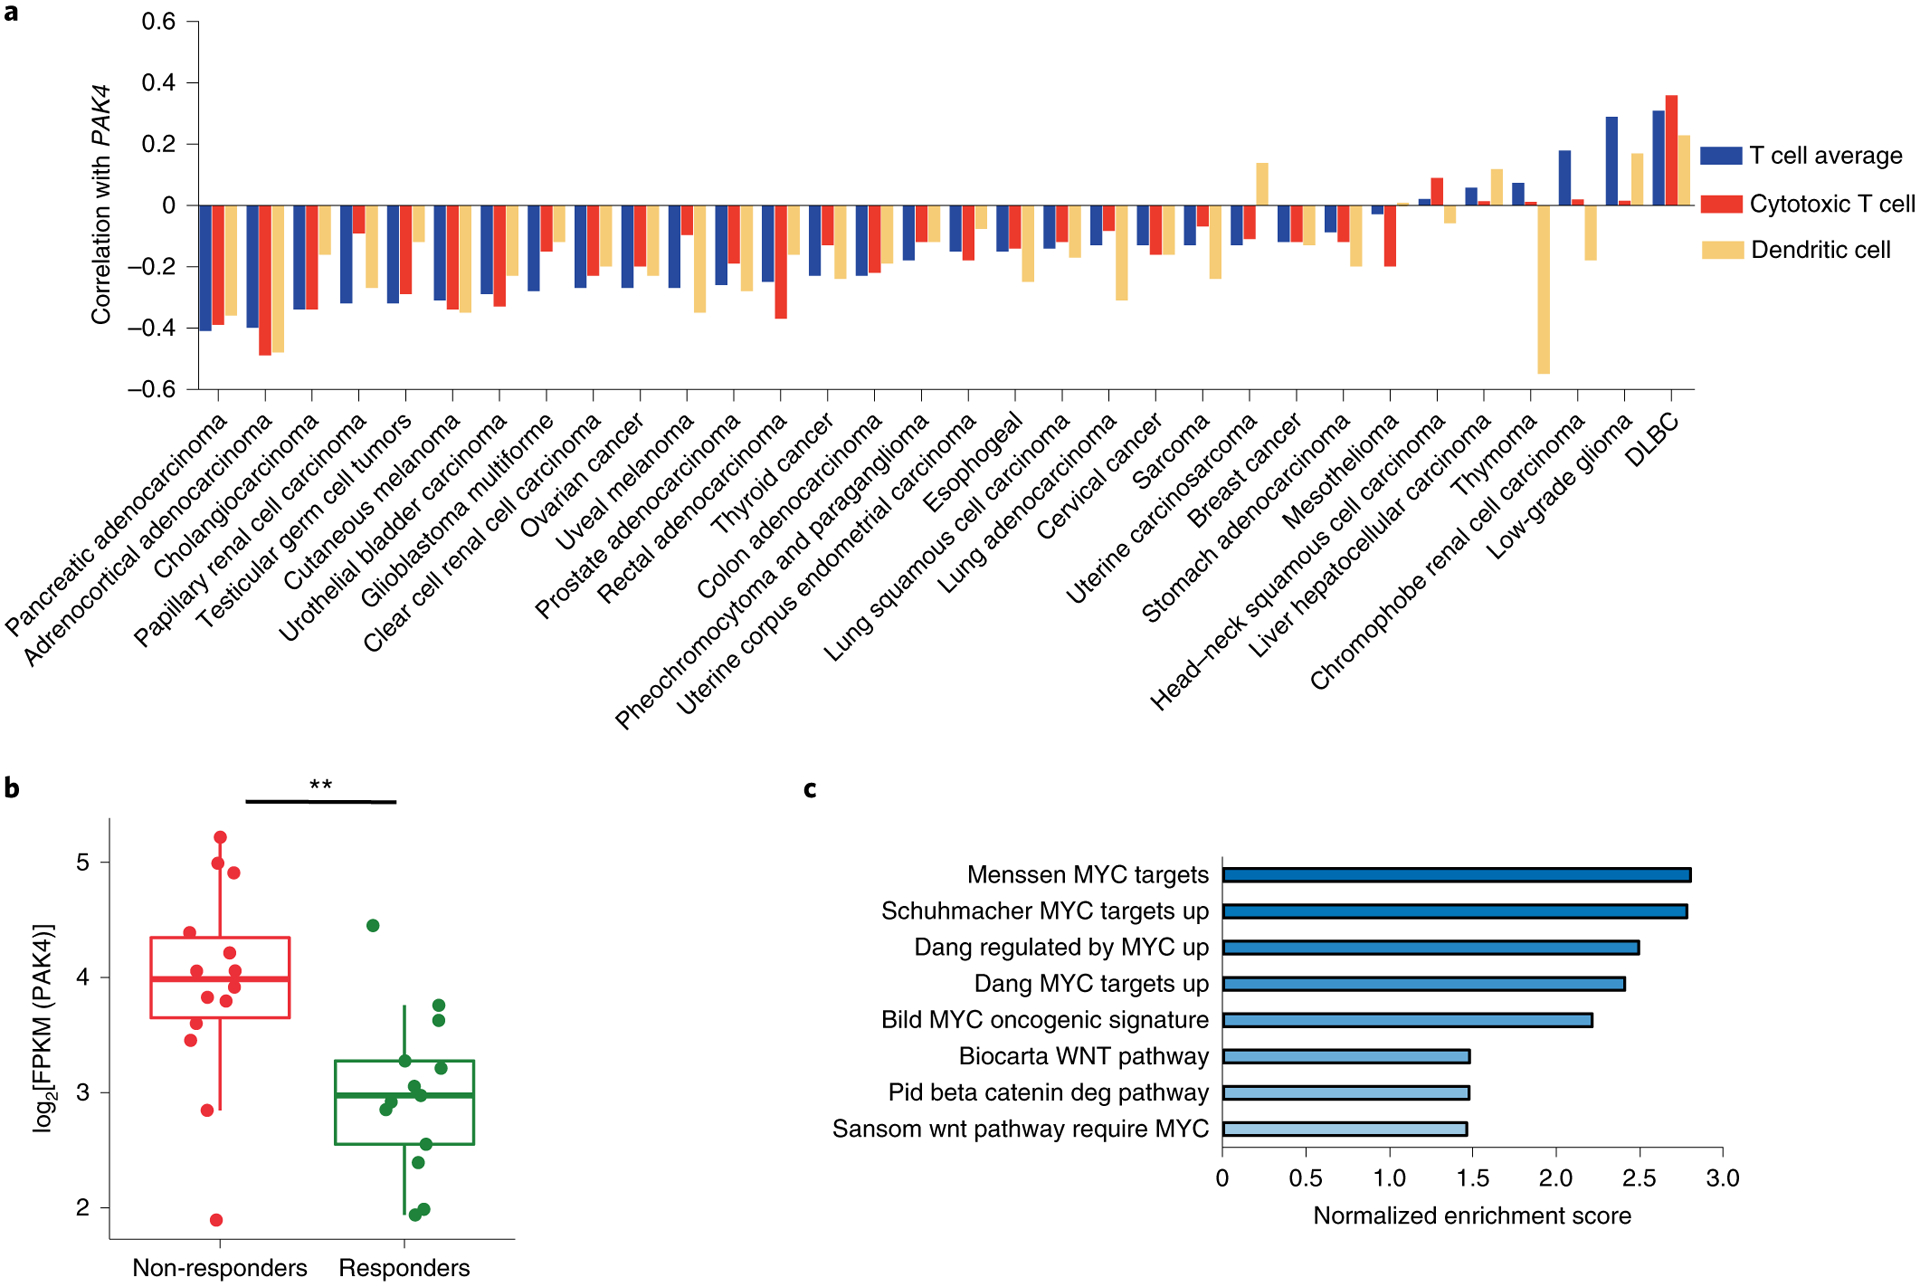
a, Pan-cancer analysis using TCGA transcriptome data shows the negative correlation between PAK4 expression and T cell (blue), cytotoxic T cell (red) and dendritic cell scores (yellow) across 32 tumor types (the sample size for each cancer type and the associated P value for each correlation can be found in Supplementary Table 3). Correlations were evaluated using Spearman’s correlation coefficient. DLBC, diffuse large B-cell lymphoma. b,c, On-treatment non-responding biopsies (n = 14) have higher levels of log2[FPKM] PAK4 expression compared with responding biopsies (b; n = 13; P = 4.72 × 10⁻³), and are enriched in gene signatures related to known oncogenic signatures involved in immune cell exclusion, as observed by GSEA using Gene Ontology gene sets as targets (c). From top to bottom, box plots in b show the maximum, third quartile, median, first quartile and minimum values, and the P value was determined by two-sided Welch’s t-test (**P < 0.01).
Lack of response to PD-1 blockade is associated with increased PAK4 expression and is enriched in oncogenic pathways involved in immune cell exclusion.
As PAK4 showed a strong inverse correlation with both dendritic cells and T cells in melanoma, we reasoned that tumor biopsies from patients without a response to anti-PD-1 may have enriched PAK4 expression. Indeed, non-responding biopsies had higher levels of PAK4 transcripts (P = 0.004; Fig. 4b). We also investigated whether our cohort of tumor biopsies non-responding to PD-1 blockade therapy recapitulated known oncogenic mechanisms of T cell exclusion10. To test this hypothesis, we compared on-treatment non-responding biopsies with responding biopsies, and applied GSEA using the curated gene sets. Signatures enriched in non-responding biopsies included gene sets related to WNT/β-catenin signaling and the WNT target gene MYC (Fig. 4c and Supplementary Table 4). Overall, biopsies from patients without a response to PD-1 blockade were enriched for PAK4 expression and gene signatures related to known oncogenic pathways involved in T cell exclusion10.
Genetic KO of PAK4 sensitizes tumors to PD-1 blockade and increases immune cell infiltration.
If PAK4 plays an active role in excluding tumor-specific T cells from the tumor microenvironment of melanoma biopsies, PAK4 inhibition would increase tumor-specific T cell infiltration and hence sensitize tumors to PD-1 blockade therapy. To test this hypothesis, we used the murine melanoma model B16, which exhibits primary resistance to PD-1 blockade29, lacks previous infiltration by tumor-specific lymphocytes30, and intrinsically expresses the immune resistance program defined by Jerby-Arnon6. To assess the anti-tumor efficacy of PD-1 blockade in the context of PAK4 deletion, we treated syngeneic C57BL/6 mice bearing B16 PAK4 KO or B16 WT tumors with a murine anti-PD-1 antibody. We observed the anti-tumor activity of PD-1 blockade only in melanoma tumors lacking PAK4 expression (Fig. 5a,,bb and Extended Data Fig. 6a,,b).b). Of note, untreated B16 PAK4 KO tumors grew progressively, suggesting that although PAK4 deletion provides sensitization to PD-1 blockade therapy, it is not sufficient by itself in the B16 model to trigger an anti-tumor immune response. In addition, restoring PAK4 protein levels in B16 PAK4 KO tumors resulted in the loss of PD-1 blockade anti-tumor efficacy (Fig. 5c and Extended Data Fig. 6c). To elucidate whether the observed response to anti-PD-1 was CD8 dependent, we depleted CD8 T cells in syngeneic C57BL/6 mice bearing B16 PAK4 KO tumors. CD8 depletion completely abrogated the anti-tumor activity of mouse anti-PD-1, showing that PAK4 deletion sensitized melanoma B16 tumors to PD-1 blockade in a CD8 T cell-dependent manner (Fig. 5d and Extended Data Fig. 6d). These results suggest that genetic PAK4 deletion allows the infiltration of tumor-specific T cells that confer anti-tumor efficacy on PD-1 blockade.
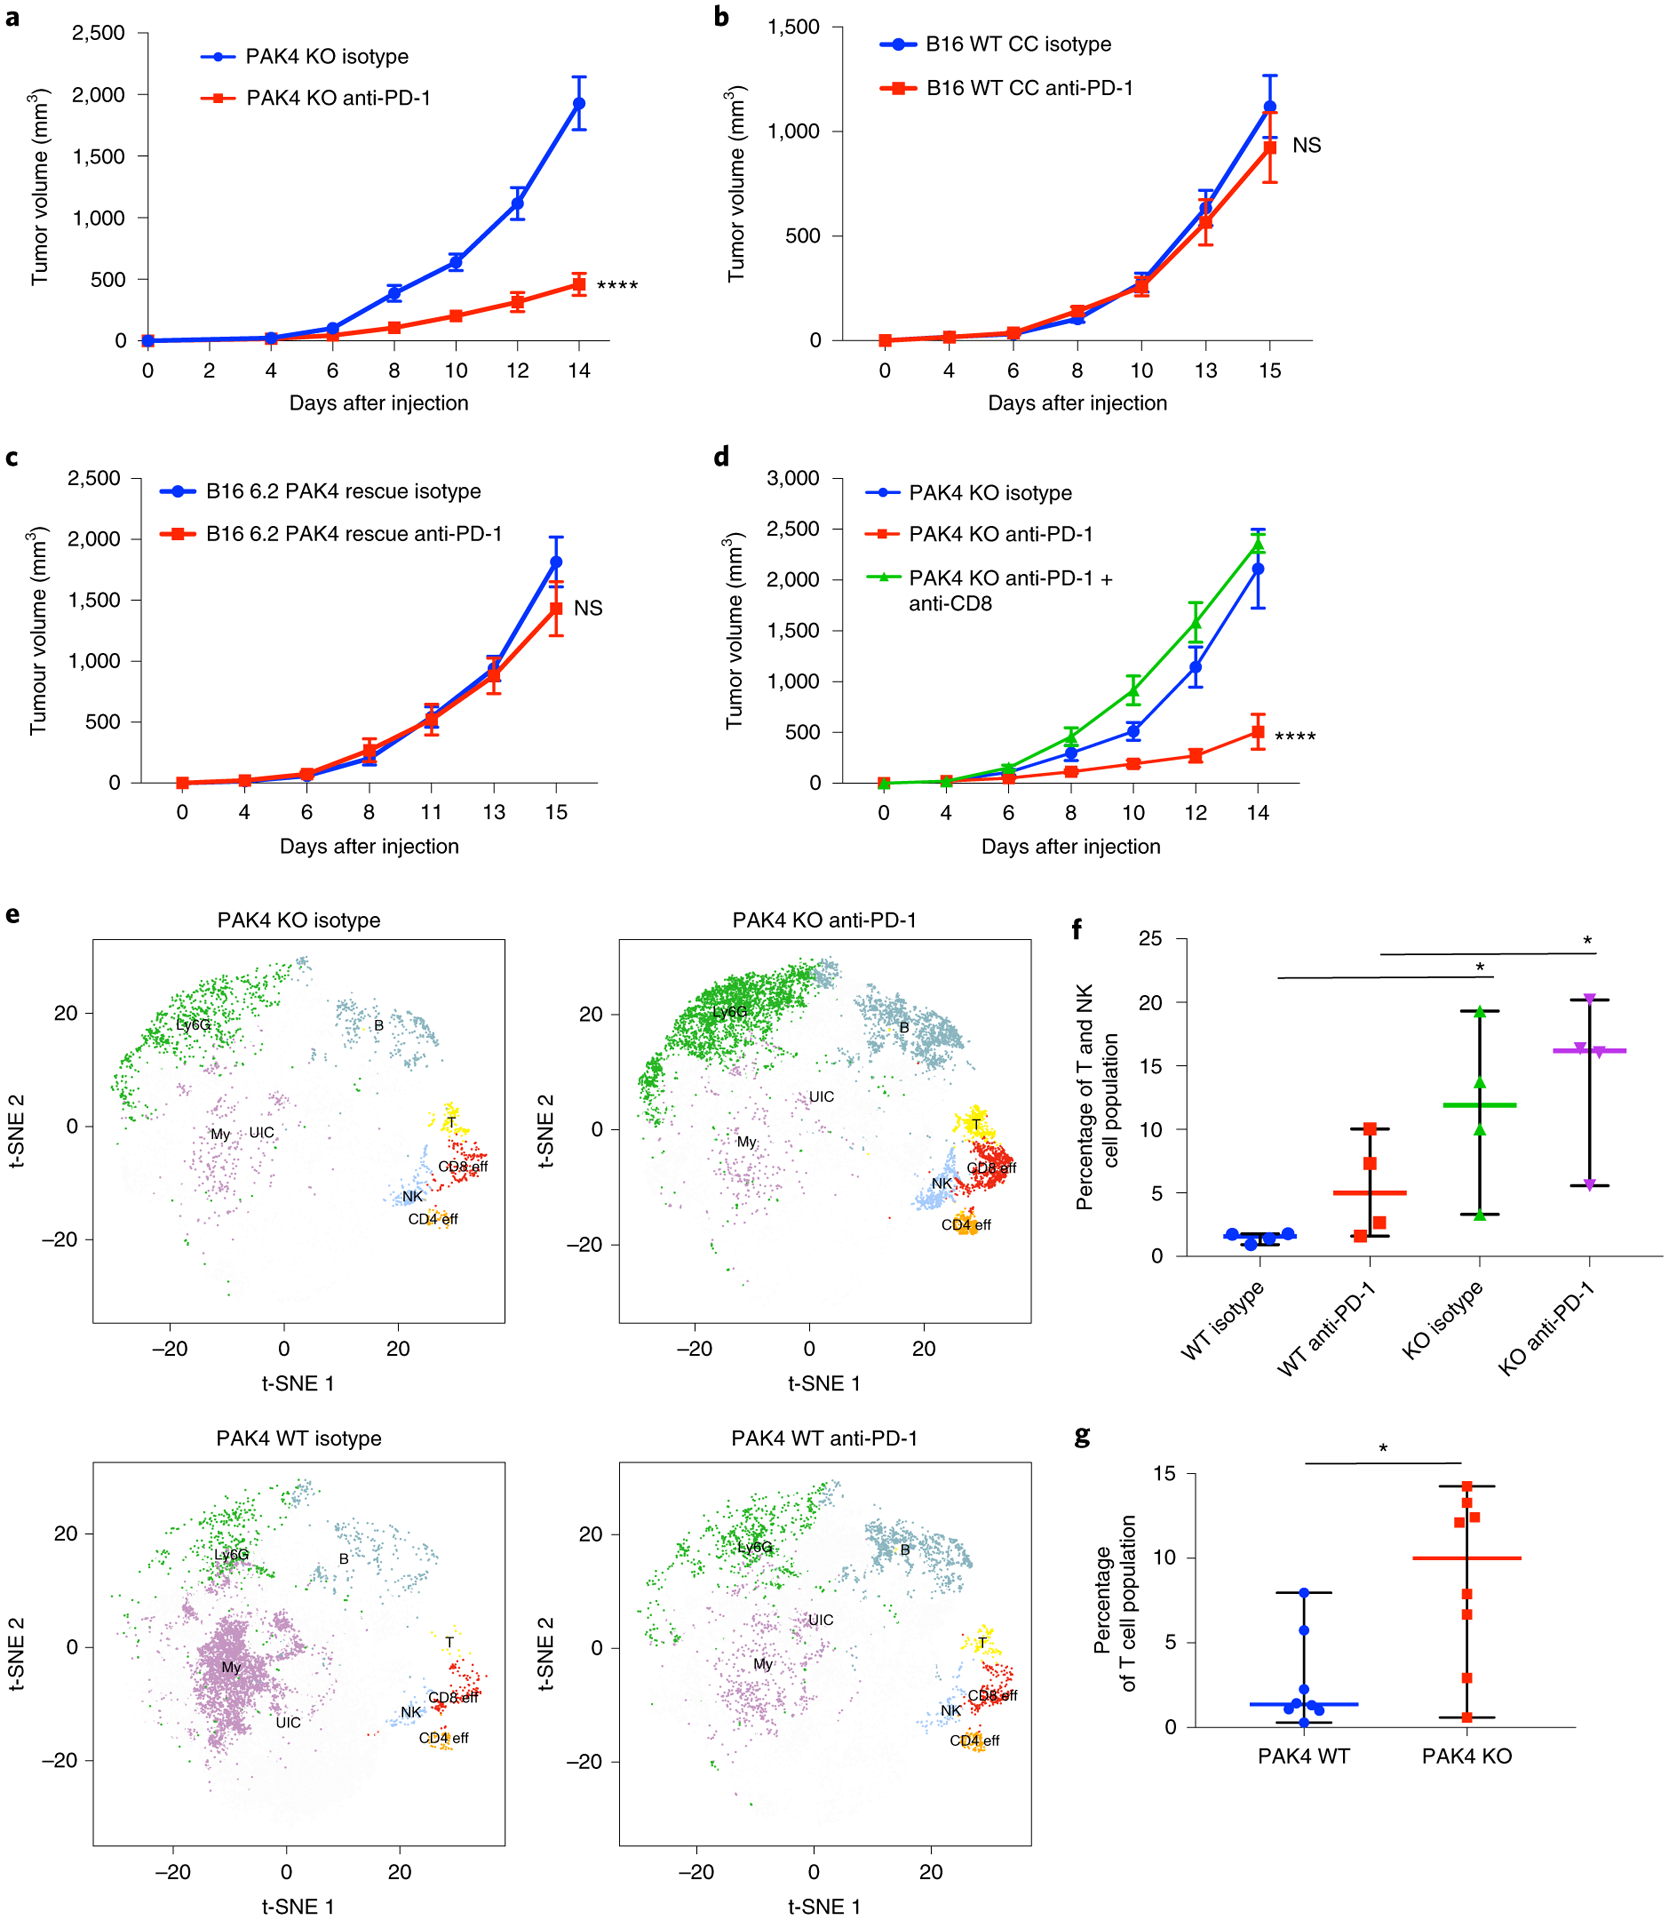
a, Tumor growth curves for B16 PAK4 KO 6.2 tumors (n = 16 per group) treated with isotype (blue) or anti-PD-1 (red). Anti-PD-1-treated B16 PAK4 KO tumors showed decreased tumor growth compared with untreated B16 PAK4 KO tumors (P = 3.65 × 10⁻⁶ at day 14). b, Tumor growth curves for B16 WT CC tumors treated with isotype (blue; n = 14) or anti-PD-1 (red; n = 13). No significant differences were observed in tumor growth (P = 0.91 at day 14). c, Tumor growth curves for B16 6.2 PAK4 rescue tumors treated with isotype (blue; n = 5) or anti-PD-1 (red; n = 5). Anti-PD-1 treatment did not have significant anti-tumor efficacy when restoring PAK4 expression (P = 0.74 at day 14). d, Tumor growth for B16 PAK4 KO 6.2 tumors with CD8 depletion (n = 5) (P = 4.31 × 10⁻⁵ at day 14 for B16 PAK4 KO anti-PD-1 versus B16 PAK4 KO anti-PD-1 + anti-CD8). e, T-distributed stochastic neighbor embedding plots for each of the following four groups: B16 PAK4 KO isotype; B16 PAK4 KO anti-PD-1; B16 WT isotype; and B16 WT anti-PD-1. The different immune populations were: myeloid cell (My); B cells (B); CD8 T cells (CD8 eff); CD4 T cells (CD4 eff); T cells (T); natural killer cells (NK); Ly6G+ cluster (Ly6G) and unidentified cluster (UIC). f, Percentage of T cell and natural killer cell (NK cell) population from CD45+ cells. PAK4 KO treated tumors had increased T and NK cell infiltration relative to WT treated tumors (median percentage: 16.18% for KO anti-PD-1; 4.99% for WT anti-PD-1; P < 0.05). PAK4 KO untreated tumors also showed increased T and NK cell infiltration relative to WT untreated tumors (median percentage: 11.89% for KO anti-PD-1; 1.57% for WT anti-PD-1; P = 0.02) (n = 4 mice per group). g, Percentage of T cell population from CD45+ cells. B16 PAK4 KO tumors presented increased T cell infiltration compared with B16 WT tumors (median percentage: 10% for KO; 1.37% for WT; P = 0.009) (n = 8 mice per group). In a–d, f and g, means ± s.e.m are shown. Statistical significance and corrections for multiple comparisons were determined using the Holm–Šidak method (a–d) or two-tailed unpaired t-test (f and g) (*P < 0.05; ****P < 0.0001). NS, not significant. Source data are available for a–d, f and g.
To validate whether PAK4 deletion facilitates immune cell infiltration, we performed immune profiling of tumor-infiltrating immune cells using cytometry by time of flight (CyTOF), and identified a total of 16 independent cell clusters (Fig. 6a). The T cell population was defined by three clusters, including a non-T regulatory CD4 T cell cluster positive for CD3e, CD4, IFN-γ and Ki-67, a CD8 T cell cluster positive for CD3e, CD8a, Tbet and Ki-67, and a general T cell cluster positive for CD3e. A natural killer cluster positive for CD335 and CD161 was also identified. B16 PAK4 KO anti-PD-1-treated tumors presented increased infiltration of T and natural killer cells compared with B16 WT anti-PD-1-treated tumors (P = 0.049; Fig. 5e,,f).f). Interestingly, untreated B16 PAK4 KO tumors already presented increased T and natural killer cell infiltration compared with B16 WT untreated tumors (P = 0.02; Fig. 5e,,f),f), although we did not observe anti-tumor efficacy in the B16 PAK4 KO group (Fig. 6b). Consistently, B16 PAK4 KO tumors had increased levels of T cells regardless of treatment with murine anti-PD-1 (P = 0.009; Fig. 5g). Therefore, these data support the hypothesis that PAK4 depletion increases tumor-specific T cell infiltration, which sensitizes tumors to PD-1 blockade.
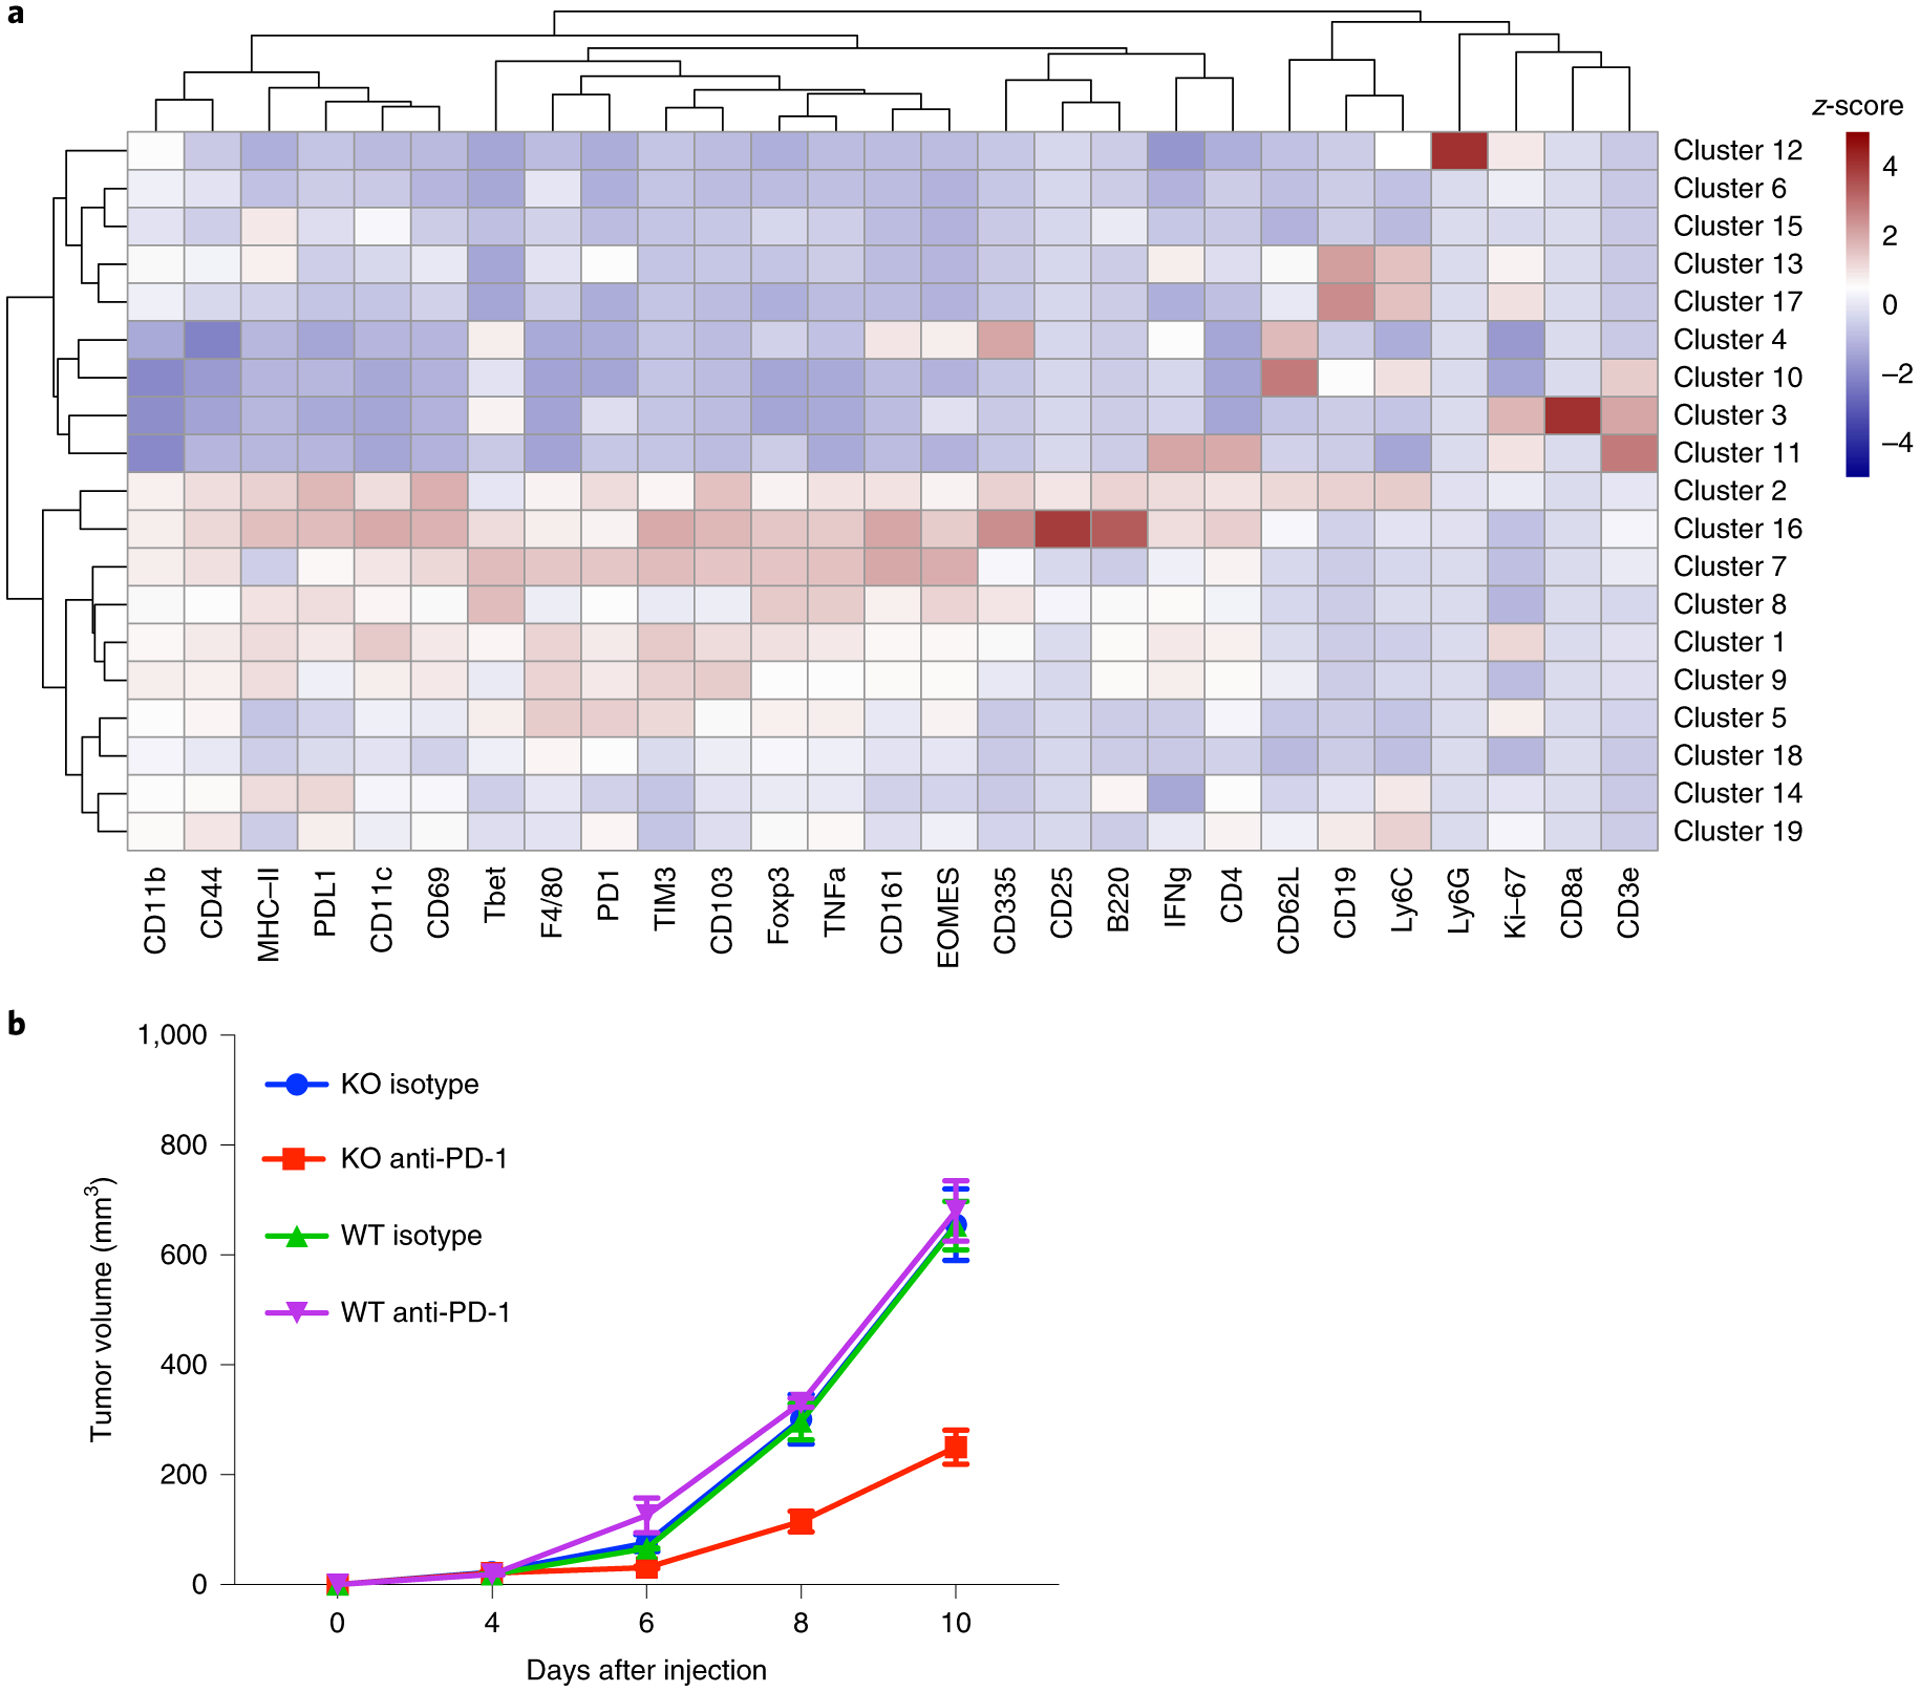
a, Heatmap with the normalized median percentage for each of the immune markers in the different clusters obtained. Only clusters with a >0.5% frequency were analyzed. b, Tumor growth curves for the 16 samples (n = 4 per group) used for the CyTOF analysis. Data represent means ± s.e.m.
Pharmacological inhibition of PAK4 synergizes with PD-1 blockade immunotherapy.
KPT-9274 is a dual PAK4 and NAMPT inhibitor24–27 currently in clinical trials. We tested whether treatment with KPT-9274 recapitulates the anti-tumor effects of genetic PAK4 deletion to sensitize B16 melanoma to murine anti-PD-1 therapy. Indeed, B16 murine melanoma tumors treated with anti-PD-1 in combination with KPT-9274 showed a stronger anti-tumor effect compared with anti-PD-1 (P = 0.01; Fig. 7a) and KPT-9274 monotherapy (P = 0.0007; Fig. 7a). To expand the testing to other settings of partial anti-PD-1 therapy resistance, we used the MC38 mouse colon adenocarcinoma model, which is a model of a cancer with high tumor mutation burden and is partially sensitive to PD-1 blockade, but with ample margin for improvement as tumors grow progressively after a period of transient response31,32. Consistent with being an immunogenic tumor model, and with PAK4 deletion per se facilitating T cell infiltration (Fig. 5f,,g),g), both MC38 WT tumors, treated with either a combination of KPT-9274 and anti-PD-1 or KPT-9274 alone, showed decreased tumor growth compared with the anti-PD-1 monotherapy group (Fig. 7b). We generated a PAK4 KO subline of MC38 through CRISPR–Cas9 gene editing (Extended Data Fig. 7a,,b),b), and consistent with the results with KPT-9274, MC38 PAK4 KO tumors achieved tumor regression even in the absence of anti-PD-1 therapy (Fig. 7c). Of note, MC38 PAK4 KO tumors only reached complete regression (n = 3) when treated with anti-PD-1, suggesting that PD-1 blockade also improves anti-tumor T cell response in the setting of partial response to anti-PD-1 therapy. In addition, we found that MC38 PAK4 KO clones were more sensitive to the anti-proliferative effects of tumor necrosis factor (TNF), which is consistent with the current literature33,34, and could contribute to the phenotype observed in this model (Extended Data Fig. 7c). Altogether, these data suggest that PAK4 inhibition synergizes with anti-PD-1 treatment.
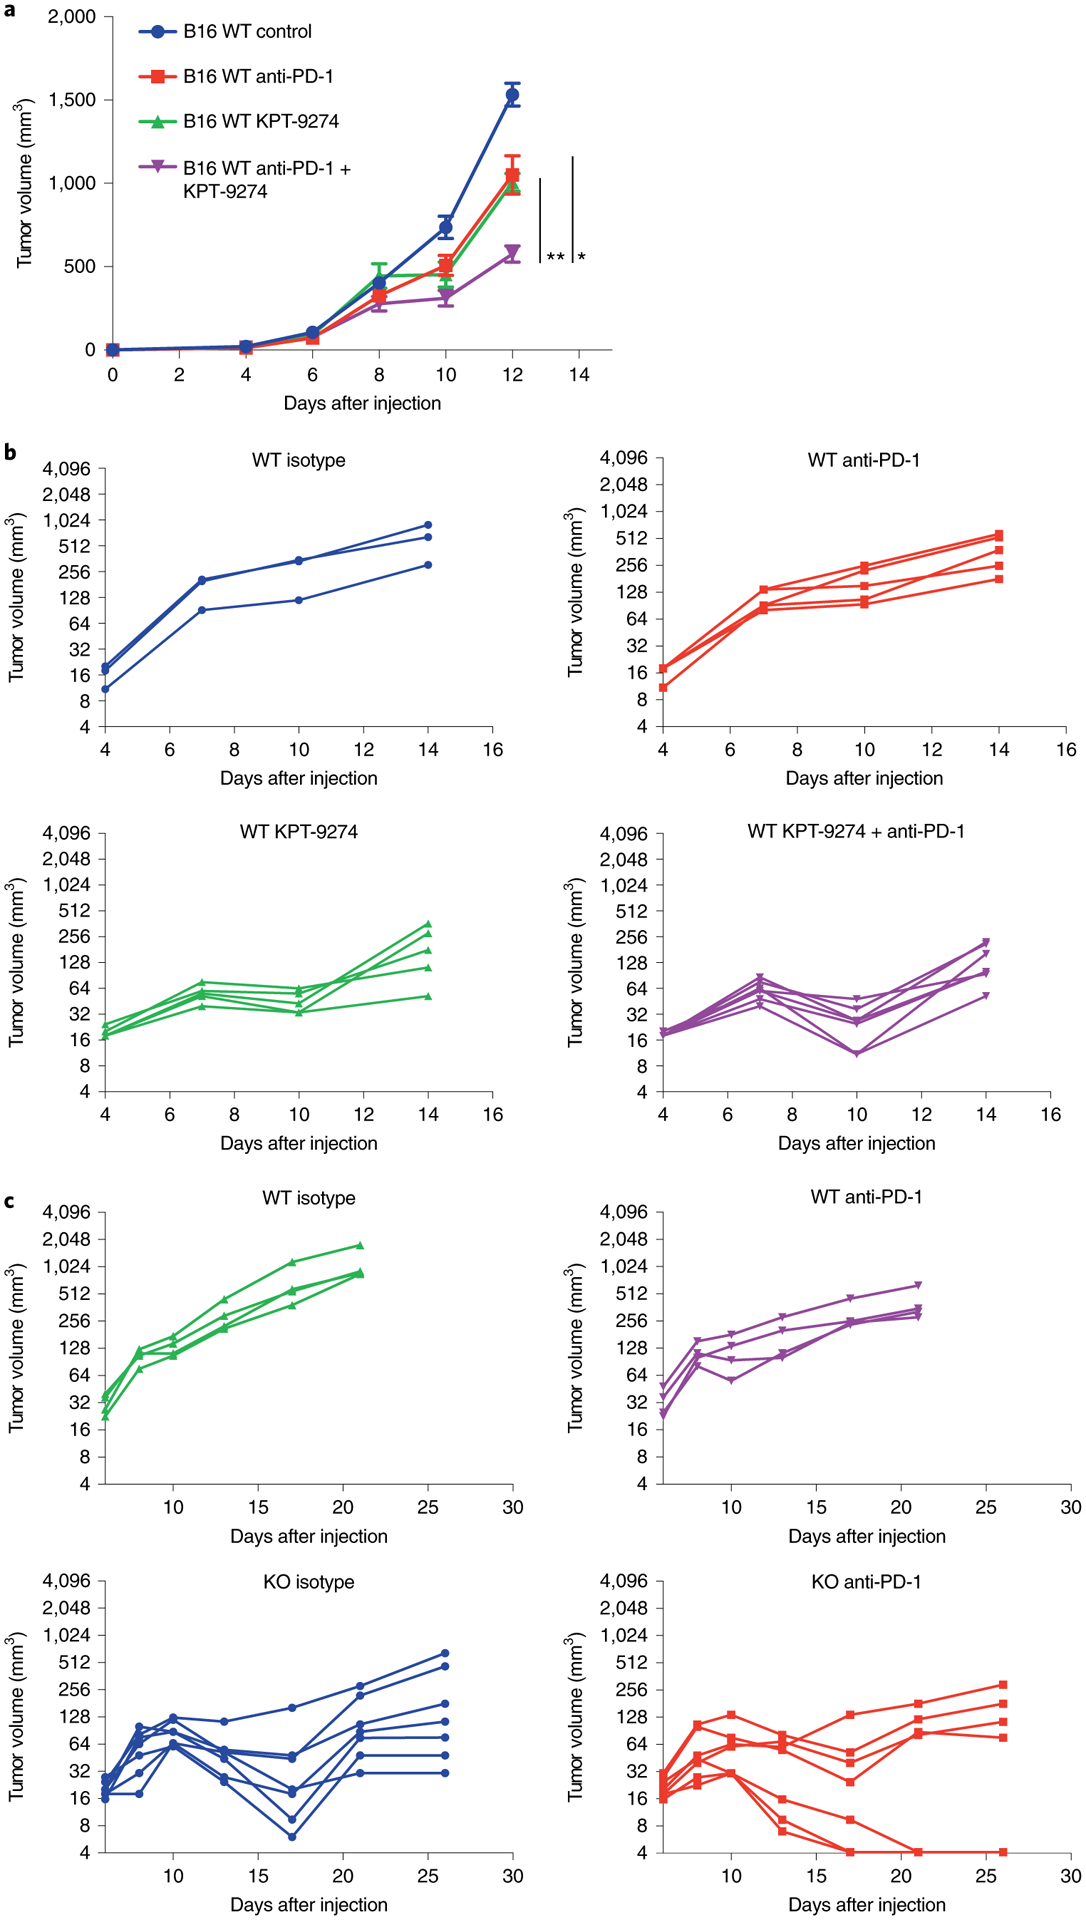
a, Tumor growth curves for B16 WT melanoma tumors treated with KPT-9274 in combination with anti-PD-1 (n = 6; purple), KPT-9274 (n = 6; green) or anti-PD-1 (n = 6; red) versus controls (n = 6; blue). The combination of KPT-9274 and anti-PD-1 showed decreased tumor growth compared with both anti-PD-1 monotherapy (P = 0.01 at day 12) and KPT-9274 monotherapy (P = 0.0007 at day 12). Data represent means ± s.e.m. b, Tumor growth curves for MC38 WT tumors treated with KPT-9274 and anti-PD-1 (n = 7; purple), KPT-9274 (n = 5; green), anti-PD-1 (n = 5; red) and isotype (n = 3; blue). The combination of KPT-9274 and anti-PD-1 or KPT-9274 monotherapy resulted in significantly decreased tumor growth compared with anti-PD-1 alone (P = 0.01 for the combination group; P = 0.02 for KPT-9274 monotherapy; both at day 10). KPT-9274 was given twice daily from days 4–7 and then discontinued due to KPT-9274-associated toxicity. c, Tumor growth curves for MC38 WT and MC38 PAK4 KO tumors treated with PD-1 blockade (n = 7 for the MC38 PAK4 KO anti-PD-1 and MC38 PAK4 KO isotype groups; n = 4 for the MC38 WT isotype and MC38 WT anti-PD-1 groups). Treated tumors received four doses of anti-PD-1 in total. Both MC38 PAK4 KO untreated and anti-PD-1-treated tumors showed decreased tumor growth compared with the MC38 WT anti-PD-1-treated group (P = 0.001 for the WT isotype versus the KO isotype; P = 0.004 for WT anti-PD-1 versus KO anti-PD-1; both at day 21). Statistical significance and correction for multiple comparisons were calculated using the Holm–Šidak method (*P < 0.05; **P < 0.01). Source data are available for a–c.
Discussion
By studying the transcriptional landscape of biopsies of patients with melanoma treated with PD-1 blockade immunotherapy, we found that the expression of PAK4 is associated with immune exclusion and lack of clinical response. Genetic and pharmacological PAK4 inhibition altered WNT/β-catenin signaling, increased intratumoral T cell infiltration and improved the response to checkpoint blockade therapy in two mouse models. The negative correlation between PAK4 expression and T cell infiltration held true across several human cancers, including cancers notoriously resistant to PD-1 blockade, and hence expands the potential clinical applicability of the combined inhibition of PAK4 and PD-1.
Finding novel molecular targets that could improve and overcome resistance to PD-1 blockade therapy remains one of the main challenges that needs to be tackled to increase the efficacy rate of cancer immunotherapies10. Our current work validates and builds on the fundamental knowledge that PD-1 blockade works by unleashing the immune breaks of a pre-existent tumor-specific T cell population2. The transcriptional characterization of melanoma tumor samples highlighted the common denominator among biopsies of non-responding patients—the lack of a proper immune T cell infiltration of the tumor microenvironment. Therefore, interventions that increase the immunogenicity and the immune infiltration within the tumor microenvironment remain a top therapeutic priority7.
The immune system exercises a selective pressure that shapes cancer evolution and results in the selection of malignant cells able to escape an immune cell attack. This has been termed cancer immunoediting35. Cancer cells can exploit and rewire oncogenic signaling pathways that alter the immunogenicity of the tumor and confer an advantage against the immune system10. Among the different oncogenic signaling pathways, there is compelling evidence from several studies that associate an active WNT/β-catenin signaling pathway with immune exclusion and resistance to immune checkpoint blockade therapy11–13. In this context, among the list of differentially expressed genes in non-immune-infiltrated biopsies, the appeal of focusing our studies on PAK4 became more relevant given its previously reported involvement in the WNT/β-catenin pathway15,18. PAK4 deletion disrupted WNT signaling activity without altering β-catenin protein levels, which suggests that PAK4 may be regulating WNT activity by means other than the number of molecules that translocate into the nucleus, such as alteration of the interaction of β-catenin with other proteins that are important in regulating β-catenin transcriptional activity. Overall, our findings provide novel insights into the mechanism by which PAK4 impacts WNT signaling activity. However, it still remains necessary to fully elucidate how PAK4-induced WNT inhibition contributes to overcoming PD-1 blockade resistance.
PAK4 overexpression or increased activity is associated with the development and progression of several tumor malignancies, including melanoma36, pancreatic cancer37 and prostate cancer38. In breast cancer, PAK4 messenger RNA levels are also often overexpressed39, and its protein activity is required for oncogenic transformation40,41. In addition to regulating WNT/β-catenin signaling15,18, PAK4 can promote tumorigenesis by altering different oncogenic pathways, including those that have been previously involved in immune cell exclusion16. For instance, PAK4 can increase PI3K/AKT signaling in different cancer malignancies by directly binding to PI3K and increasing AKT phosphorylation42–45. Interestingly, PAK4 also presents kinase-independent functions. It has been reported that PAK4 acts as a scaffold to facilitate TNF receptor type 1-associated death domain (TRADD) protein binding to the TNF receptor to promote TNF survival activity33. Therefore, PAK4 protein inhibition increases TNF-induced apoptosis—an observation that is in line with our results seen in the MC38 model34. The role of PAK4 and TNF signaling in PD-1 blockade sensitivity necessitates a better understanding and will need to be explored further in the future.
In these studies, we primarily used the B16 murine melanoma model as it has previously been reported that it is poorly inflamed and resistant to checkpoint blockade29. Of note, we acknowledge that there may be additional mouse models that have not been used in this study and that could help expand our understanding of the role of PAK4 in immune cell exclusion, such as the BrafV600E/Pten−/−/CAT-STA mice used in the Spranger et. al. study11. This particular mouse model has been used to study WNT-induced T cell exclusion in melanoma, and has provided evidence that the oncogenic WNT/β-catenin pathway mediates dendritic cell exclusion, resulting in immune evasion. However, it is a model that relies on the in situ generation of multiple oncogene-driven primary skin cancers on induction of the driver oncogenes. This does not allow the genetic testing of PAK4 inhibition, unless a new transgenic mouse with an inducible PAK4 inhibition is created and cross-bred with the already BrafV600E/Pten−/−/CAT-STA triple genetically engineered mice.
In summary, this study presents a potential new therapeutic strategy to overcome PD-1 blockade resistance. Having analyzed three patient biopsy-derived RNA-Seq datasets, we conclude that PAK4 expression is enriched in poorly infiltrated tumor samples and constitutes a target to reverse PD-1 blockade resistance. Our pan-cancer correlation analysis with multiple cancer histologies having an anti-correlation of PAK4 expression and T cell infiltration suggests that patients with different cancers could potentially benefit from dual PAK4 and PD-1 inhibition. The results from this study have led to the planning of a phase 1 clinical trial combining the anti-PD-1 nivolumab with the dual PAK4 and NAMPT inhibitor KPT-9274 (NCT02702492).
Methods
Patients, tumor biopsies and response assessment.
Tumor biopsies were collected under University of California, Los Angeles (UCLA) Institutional Review Board approvals 11–001918 and 11–003066 from 41 patients with metastatic melanoma treated with either pembrolizumab or nivolumab. All patients signed a written informed consent form. Samples were immediately stored in RNAlater (Ambion) or snap frozen in liquid nitrogen for subsequent RNA extraction. Response was assessed for each biopsy independently by A.R. Complete patient clinical information can be found in Supplementary Table 1.
RNA isolation and RNA-Seq analysis.
We obtained a total of 66 tumor samples from which we extracted RNA using the AllPrep DNA/RNA Mini Kit (Qiagen) and mirVana miRNA Isolation Kit (Ambion). Poly-A selection was used for library construction, and samples were sequenced using the Illumina HiSeq 2500 platform with a read length of 2 × 100 at the UCLA Technology Center for Genomics and Bioinformatics. Raw FASTQ files were aligned to the hg19 genome using HISAT2 version 2.0.4 (ref.46) with the default parameters, and counted with HTSeq version 0.6.1 (ref.47) with the intersection-nonempty mode (ambiguous reads were counted if fully overlapping). Raw counts were then normalized to fragments per kilobase of transcript per million mapped reads (FPKM). Two tumor biopsies were excluded from the analysis due to discordancy with previous IHC analysis (Supplementary Fig. 1a–c). Four tumor biopsies were excluded based on the expression of KRT15 and KRT5 (Supplementary Fig. 1d,e). A total of 60 tumor biopsies were considered for transcriptomic analysis. RNA-Seq-based cell deconvolution of tissue-infiltrating and stromal populations was performed using MCP-counter20 with the default settings, and immune cell infiltration was defined using the upper and lower quartile scores for each of the obtained immune cell populations. Differential gene expression was performed based on the negative binomial distribution with the DESeq2 package48 using the default settings (Wald significance test). Principal component analyses were also performed, using the DESeq2 package47, on prior normalization of raw reads using the variance-stabilizing transformation (vst) function. To identify enriched signaling pathways, we utilized GSEA with the following gene sets: C2 Curated Gene Sets and C5 Gene Ontology Gene Sets49. Pan-cancer correlation analysis between PAK4 expression and immune cell infiltration (calculated using MCP-counter as described above) was performed using gene expression data from 32 tumor types from the TCGA Research Network (http://cancergenome.nih.gov/).
Cell lines and PAK4 CRISPR–Cas9 KO and rescue.
Murine B16 and MC38 cells were maintained in DMEM and RPMI medium respectively, supplemented with 10% fetal bovine serum, 100 U ml−1 penicillin and 100 μg ml−1 streptomycin at 37 °C under a humidified atmosphere of 5% CO2. The following single guide RNAs targeting PAK4 were used: forward: 5′-TTCGAGCACCGTGTACACAC-3′; reverse: 5′-GTGTGTACACGGTGCTCGAA-3′. These were cloned into the pSpCas9(BB)-2A-GFP vector (Addgene) as described in Zheng’s protocol50. Cells were then transfected with PAK4-single guide RNA plasmid using lipofectamine 3000 (Thermo Fisher Scientific), and green fluorescent protein-positive cells were collected and single-cell sorted 48 h after transfection at the UCLA Flow Cytometry Core. Genomic DNA was isolated for each clone (NucleoSpin Tissue XS; Macherey Nagel), and after PCR amplifying the PAK4 sequence, we used the tracking of indels by decomposition (TIDE)51 web tool to evaluate and confirm knockout efficiency (Extended Data Figs. 3a–c and and7a).7a). PAK4 deletion was also validated by western blot, performed as described previously52. PAK4 antibody (Proteintech) immunoreactivity was assessed with an ECL-Plus Kit (Amersham Biosciences) and analyzed using the ChemiDoc MP system (Bio-Rad Laboratories) (Extended Data Figs. 3d and and7b).7b). To restore PAK4 levels in PAK4 KO cells, we cloned the mouse PAK4 open reading frame into a lentiviral vector containing Thy1.1. 293T cells were used for lentiviral particle generation, and B16 PAK4 KO cells were transduced at 20% confluency. Then, 24 h after transduction, the media was changed and cells were expanded and sorted based on Thy1.1 expression. PAK4 expression was then validated by western blot (Extended Data Fig. 3e).
WNT activity assays.
β-catenin protein levels and phosphorylation were investigated by western blot performed as described previously51 using the following antibodies: β-catenin (catalog number: 9587); phospho-β-catenin (S675; catalog number: 9567) and phospho-β-catenin (S33/37/T41; catalog number: 9561) (all from Cell Signaling Technology). Cytoplasm and nuclear extraction were performed with NE-PER Nuclear and Cytoplasmic Extraction Reagents (Thermo Fisher Scientific) following the manufacturer’s protocol.
For the Topflash WNT activity assay, cells were plated in 24-well plates and co-transfected with pSV-β-galactosidase control vector (PR-E1081; Promega) along with either pTopflash (Addgene; catalog number: 12456) or pFopflash (Addgene; catalog number: 12457). Then, 24 h after transfection, cells were treated with Wnt-3a (R&D Systems) at 200 ng ml−1. After 8 h, cells were harvested using Reporter Lysis Buffer (Promega; catalog number: PR-E4030) and the luciferase activity was measured using a Bright-Glo Luciferase Assay System (Promega; catalog number: PR-E2610) and Beta-Glo Assay System (Promega; catalog number: PR-E4720). The luciferase activity was normalized to its corresponding Beta-Glo activity to account for transfection efficiency.
Tyrosinase expression was measured by reverse transcription PCR following manufacturer’s protocol for the Power SYBR Green RNA-to-CT 1-Step Kit (Applied Biosystems) and using the following primers: 5′-GCACCTATCGGCCATAACAG-3′ and 5′-GCCAGATACGACTGGCTTGT-3′.
TNF proliferation assay.
To assess the anti-proliferative effects of TNF, MC38 cells were plated into 96-well plates by triplicate with either media or media containing TNF (100 ng ml−1; Peprotech). Cell confluency was measured using the IncuCyte S3 Live System. To determine the percentage of cell growth inhibition, we measured the area under the curve of each group and calculated the reduction in under the curve between the untreated and TNF-treated cells.
Mouse model studies.
All mouse studies were performed under UCLA Animal Research Committee protocol number 2004-159-23. C57BL/6 mice were bred and kept under defined-flora pathogen-free conditions at the Association for Assessment and Accreditation of Laboratory Animal Care-approved animal facility of the Division of Experimental Radiation Oncology at UCLA. To study the in vivo effect of PD-1 blockade in anti-tumor response and immune cell infiltration, we injected 0.3 × 10⁶ B16 PAK4 KO or PAK4 rescue melanoma cells or MC38 PAK4 KO cells subcutaneously into the flanks of C57BL/6 syngeneic mice. Then, 96 h after tumor injection, mice were randomly assigned to the different groups. Anti-PD-1 (catalog number: BE0146; clone RMP1–14; BioXCell) treatment was Xinjected intraperitoneally three times per week at 200 μg per dose. For the CD8 depletion studies, we administered anti-CD8 (catalog number BE0117; clone YST 169.4; BioXCell) 1 d before anti-PD-1 treatment and then it was co-administered with anti-PD-1 for a total of four doses. Splenocytes from control and CD8-depleted mice were taken to validate CD8 depletion efficacy (Extended Data Fig. 6d). To study the combination effects of PAK4 inhibition with KPT-9274 and anti-PD-1 (catalog number: BE0146; clone RMP1–14; BioXCell) in immune cell infiltration and anti-tumor response, 0.3 × 10⁶ B16 WT or 0.5 × 10⁶ MC38 WT cells were injected subcutaneously into the flanks of C57BL/6 mice. Then, 96 h after tumor injection, mice were randomly assigned to the different groups. For B16 WT tumors, KPT-9274 was administered once a day by oral gavage at 300 mg kg−1 while anti-PD-1 treatment was administered as described above. For MC38 WT tumors, KPT-9274 was administered twice a day by oral gavage at 150 mg kg−1. Tumor progression was monitored three times per week by measuring two perpendicular dimensions with a calliper.
Mass cytometry.
To study the different immune cell populations in the tumor microenvironment of melanoma B16 PAK4 KO and B16 WT tumors, we collected spleen and tumor samples from anti-PD-1-treated or untreated mice for each of the two conditions. Tumor samples were processed using the Tumor Dissociation Kit, mouse (Miltenyi Biotec) following the manufacturer’s protocol. Spleens were manually disaggregated and filtered with a 70-μm strainer following digestion with ACK Lysing Buffer (Lonza). Samples were then stained and processed as described previously53, with two deviations: (1) samples were not barcoded; and (2) 3% paraformaldehyde was used instead. Detailed information on the immune markers used for immune cell phenotyping can be found in Supplementary Table 5. Following staining, samples were analyzed using the Helios mass cytometer (Fluidigm) platform at the UCLA Flow Cytometry Core. Sample quality control was assessed by measuring the fluctuation/disruption over time. Calibration beads (Cs140) were also excluded. Samples were pre-gated for cells, singlets and double expression of the viable CD45 single-cell-positive population using FlowJo software (version 10.4.2) and used as the input for Cytofkit54, which was analyzed in R (version 3.5.1). To identify and annotate each of the clusters obtained, cluster median data were normalized, and a threshold of >0.5 was used to define positive immune markers53. T-distributed stochastic neighbor embedding plots were generated by PhenoGraph clustering through cytofkiyShinyAPP from Cytofkit54.
IHC.
We re-analyzed IHC samples used in our previous work2 with matching RNA-Seq data to correlate immune cell infiltration between IHC and RNA-Seq. We generated new slides for two representative patients and stained them with hematoxylin and eosin, S100, CD8, PAK4 and CTNNB1 at the UCLA Anatomic Pathology IHC Laboratory. Leica Bond-III autostainers (Leica Biosystems) were used for immunostaining as previously described2. Cell density (cells mm−2) and quantification of PAK4 co-localization with S100 and CTNNB1 were calculated using the Indica Labs HALO 2.
Statistics and reproducibility.
GraphPad Prism 7 (GraphPad Software) and R software (version 3.5.1) were used for graphic representation and statistical analysis. Gene expression comparisons were performed using two-sided Welch’s t-test unless matching pre- and on-treatment samples were used, in which case a two-sided paired t-test was performed. Correlation analysis was performed using the Pearson correlation coefficient unless otherwise specified. Differential gene expression was performed using the R package DeSeq2 in which P values were calculated using the negative binomial generalized linear model fitting and Wald significance test, while q values were obtained by applying the Benjamini–Hochberg method. For in vivo studies, statistical significance and correction for multiple comparisons were calculated using the Holm–Šidak method. Differences were considered statistically significant if P < 0.05. Functional data are representative of at least three experiments unless otherwise specified.
Reporting Summary.
Further information on research design is available in the Nature Research Reporting Summary linked to this article.
Data availability
RNA-Seq data supporting the findings of this study have been deposited in the National Center for Biotechnology Information database of Genotypes and Phenotypes (https://www.ncbi.nlm.nih.gov/gap/) with accession number phs001919. The data for the pan-cancer correlation analysis were derived from the TCGA Research Network (http://cancergenome.nih.gov/). Source data on unprocessed blots in Fig. 3 and Extended Data Figs. 3–5 and and7,7, as well as numerical raw data for Figs. 3, ,55 and and77 and Extended Data Figs. 4–6 are provided with the paper. All other data supporting the findings of this study are available from the corresponding author on reasonable request.
Extended Data
Extended Data Fig. 1 |

Comparison (two-sided, paired T-test) of each of the immune populations and immune markers between baseline and on-treatment tumour samples for responding (n= 5) and non-responding (n= 6) biopsies. From left to right: T cell score (R P= 0.007, NR P= 0.44), Dendritic cell score (R P= 0.009, NR P= 0.08), CD8 T cell score (R P= 0.006, NR P= 0.48), CTL score (R P= 0.01, NR P= 0.43), NK cell score (R P= 0.006, NR P= 0.32), Monocyte lineage score (R P= 0.004, NR P= 0.48), IFNg (R P= 0.01, NR P= 0.47), TNF (R P= 0.01, NR P= 0.9), GZMA (R P= 0.01, NR P= 0.73), PRF1 (R P= 0.004, NR P= 0.29) and CD8A (R P= 0.004, NR P= 0.52) expression. Increase in all immune populations and markers was significant (P < 0.05) only in responding biopsies. *P <0.05, **P < 0.01; ns, not significant
Extended Data Fig. 2 |
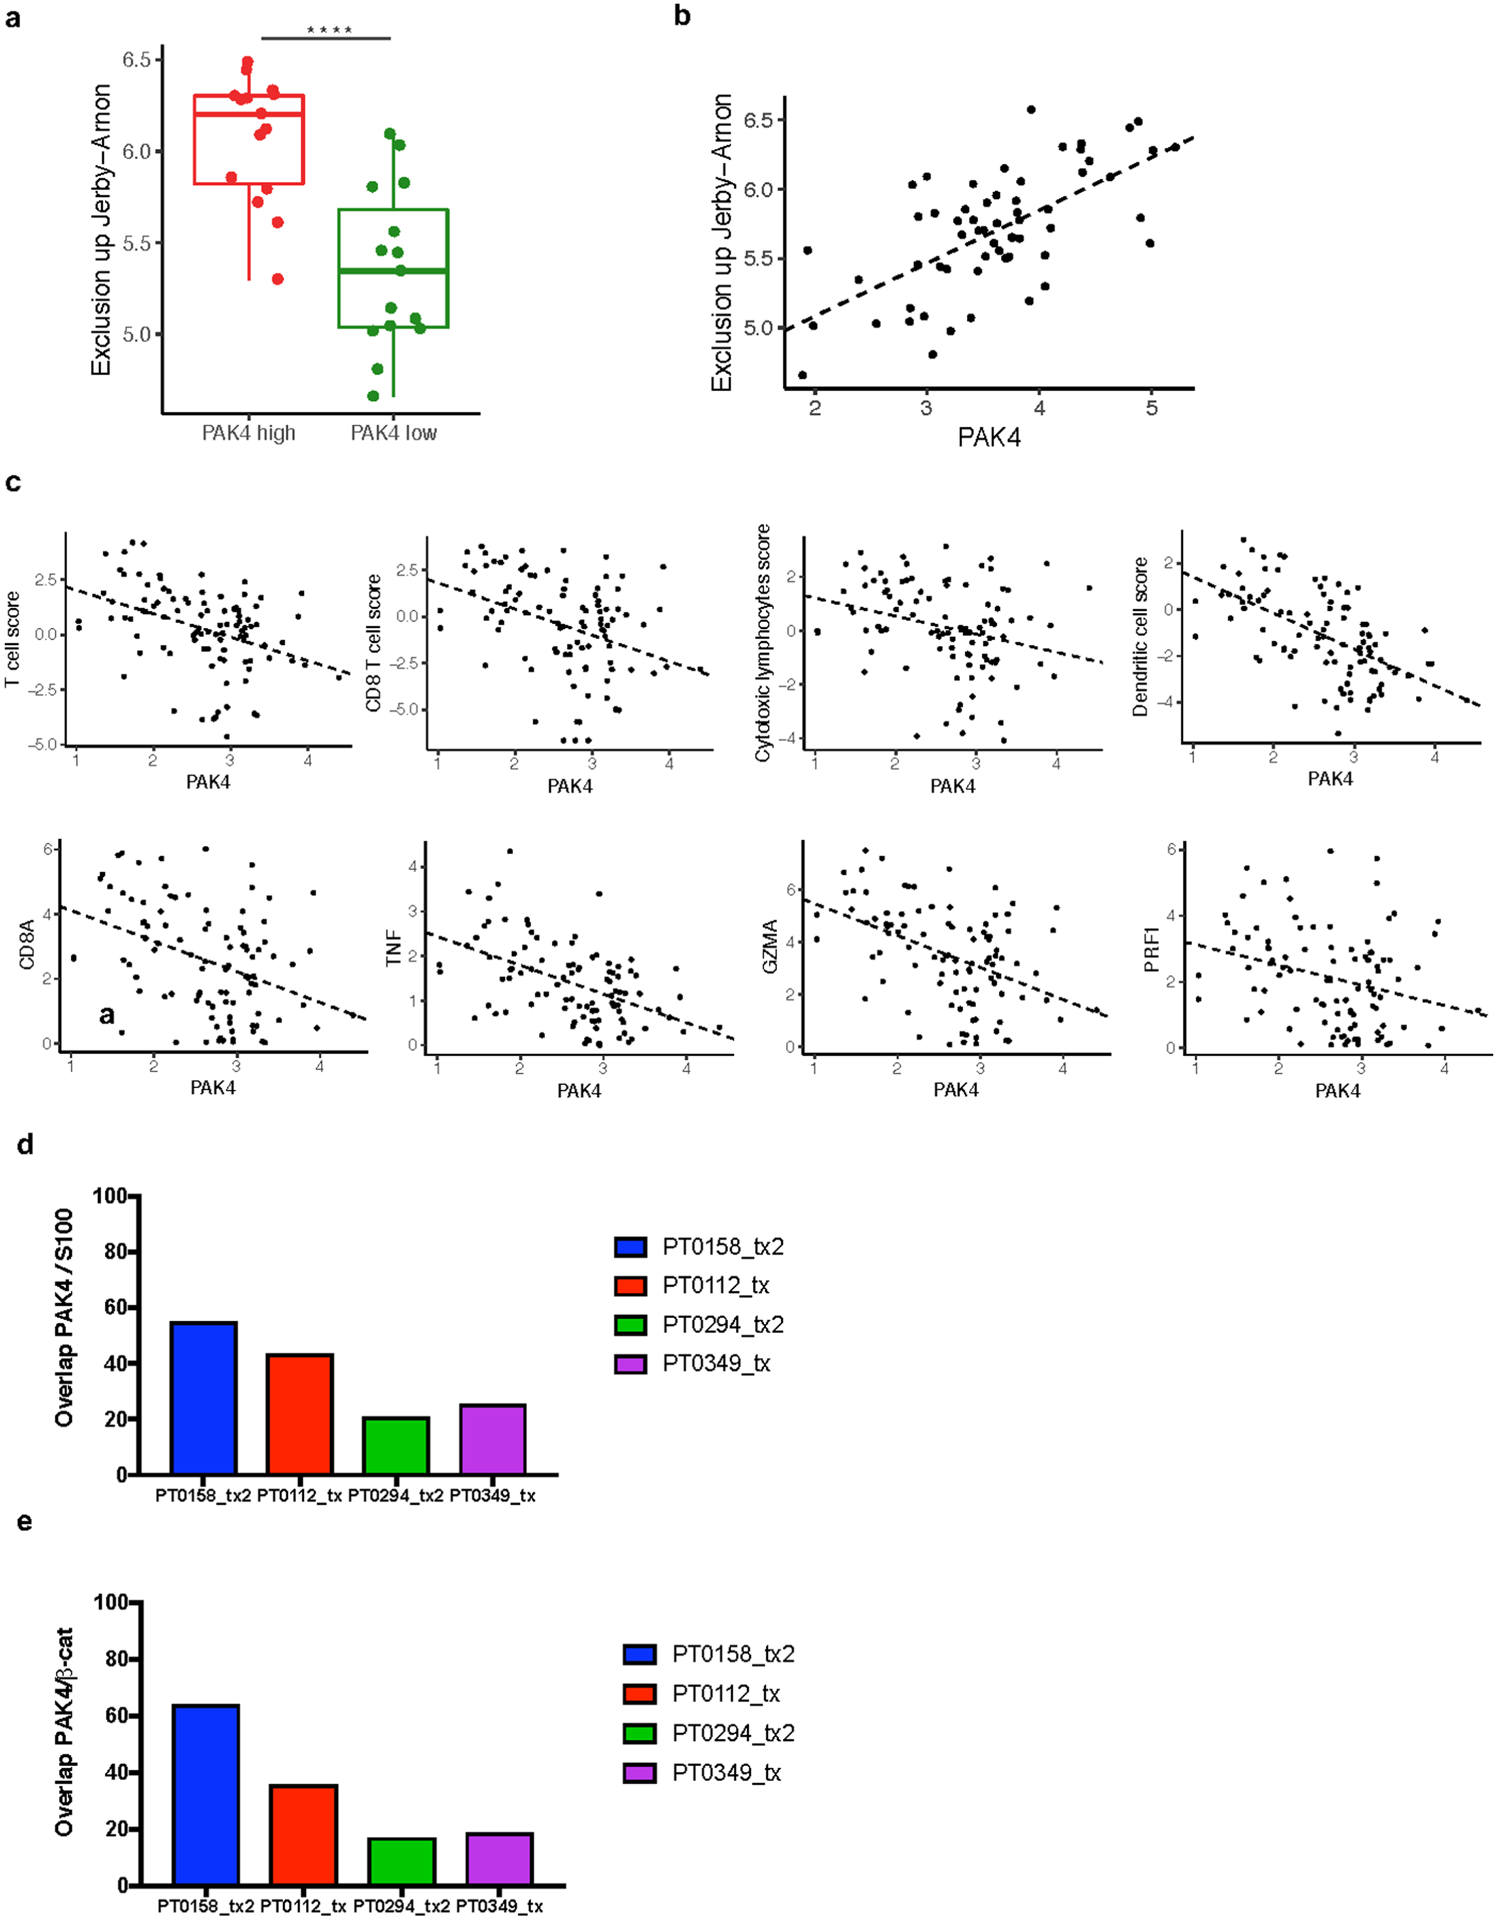
a, Comparison of exclusion up Jerby-Arnon score expression (P = 3.28e-05) between tumour biopsies within the upper (n = 15) and lower (n = 15) quartile of PAK4 expression. b, PAK4 correlation with Jerby-Arnon score expression (n = 60) (R = 0.65, P = 1.78e-08). Exclusion up Jerby-Arnon was obtained based on the geometric mean of the 302 gene from Jerby-Arnon et al. c, CD8A (R = −0.39, P = 6.07e-05), TNF (R = −0.49, P = 1.89e-07), GZMA (R = −0.45, P = 2.47e-06), PRF1 (R = −0.28, P = 4e-03) and the different immune populations assessed using MCP-Counter: T cells (R = −0.39, P = 4.41e-05), CD8 T cells (R = −0.36, P = 1.71e-04), cytotoxic lymphocytes (R = −0.28, P = 4.9e-03) and dendritic cells (R = −0.57, P = 3.95e-10). n= 99 for all plots. d, Quantification of PAK4 positive cells out of S100 total positive cells. PT0158_tx2 and PT0112_tx are two biopsies with low T cell infiltration and high PAK4 expression while PT0294_tx2 and PT0349_tx have low PAK4 and high T cell infiltrate as determined by RNAseq. e, Quantification of PAK4 positive cells out of β-catenin total positive cells. From top to bottom box-plots define the maximum, 3rd quartile, median, 1st quartile and minimum values a. P values obtained using two-sided Welch’s t-test a. Correlations were calculated applying Pearson’s correlation coefficient test b, c
Extended Data Fig. 3 |
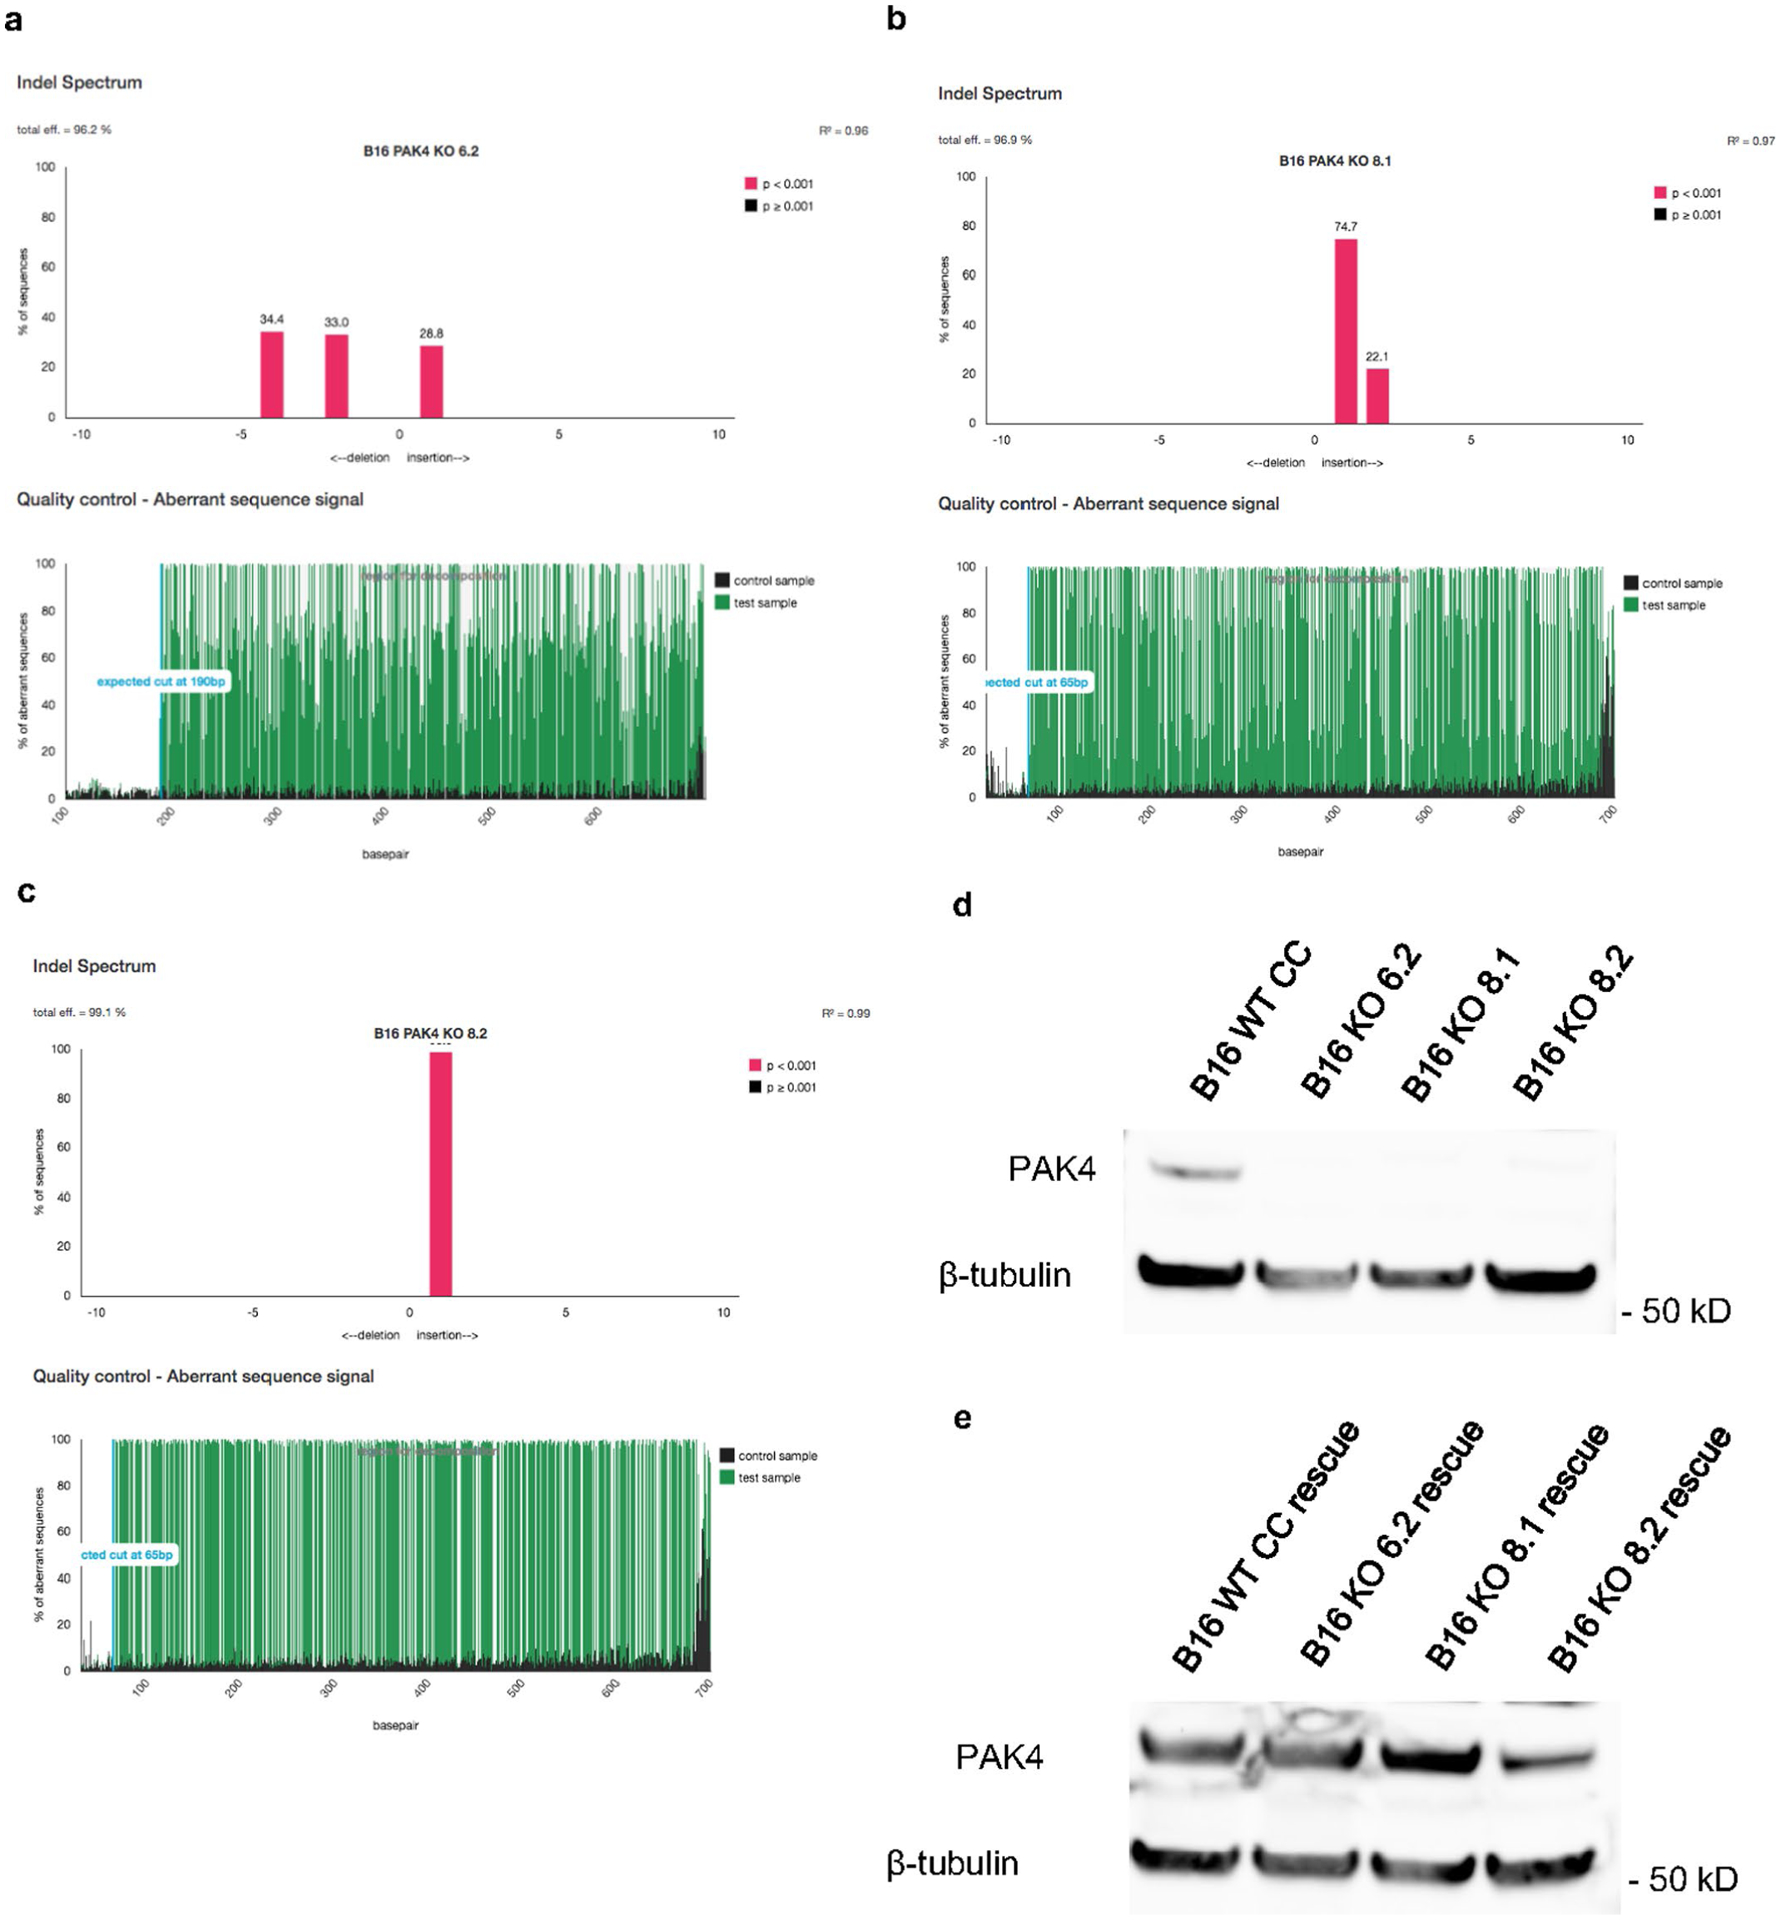
a, b, c TIDE analysis of the B16 PAK4 KO clones: 6.2, 8.1 and 8.2 respectively. d, e, Analysis of PAK4 protein expression in the three B16 PAK4 KO clones, B16 WT CRISPR control and rescue cell lines by Western blot. Results are representative from three independent experiments. Unprocessed blot images are provided as a Source Data file d, e.
Extended Data Fig. 4 |
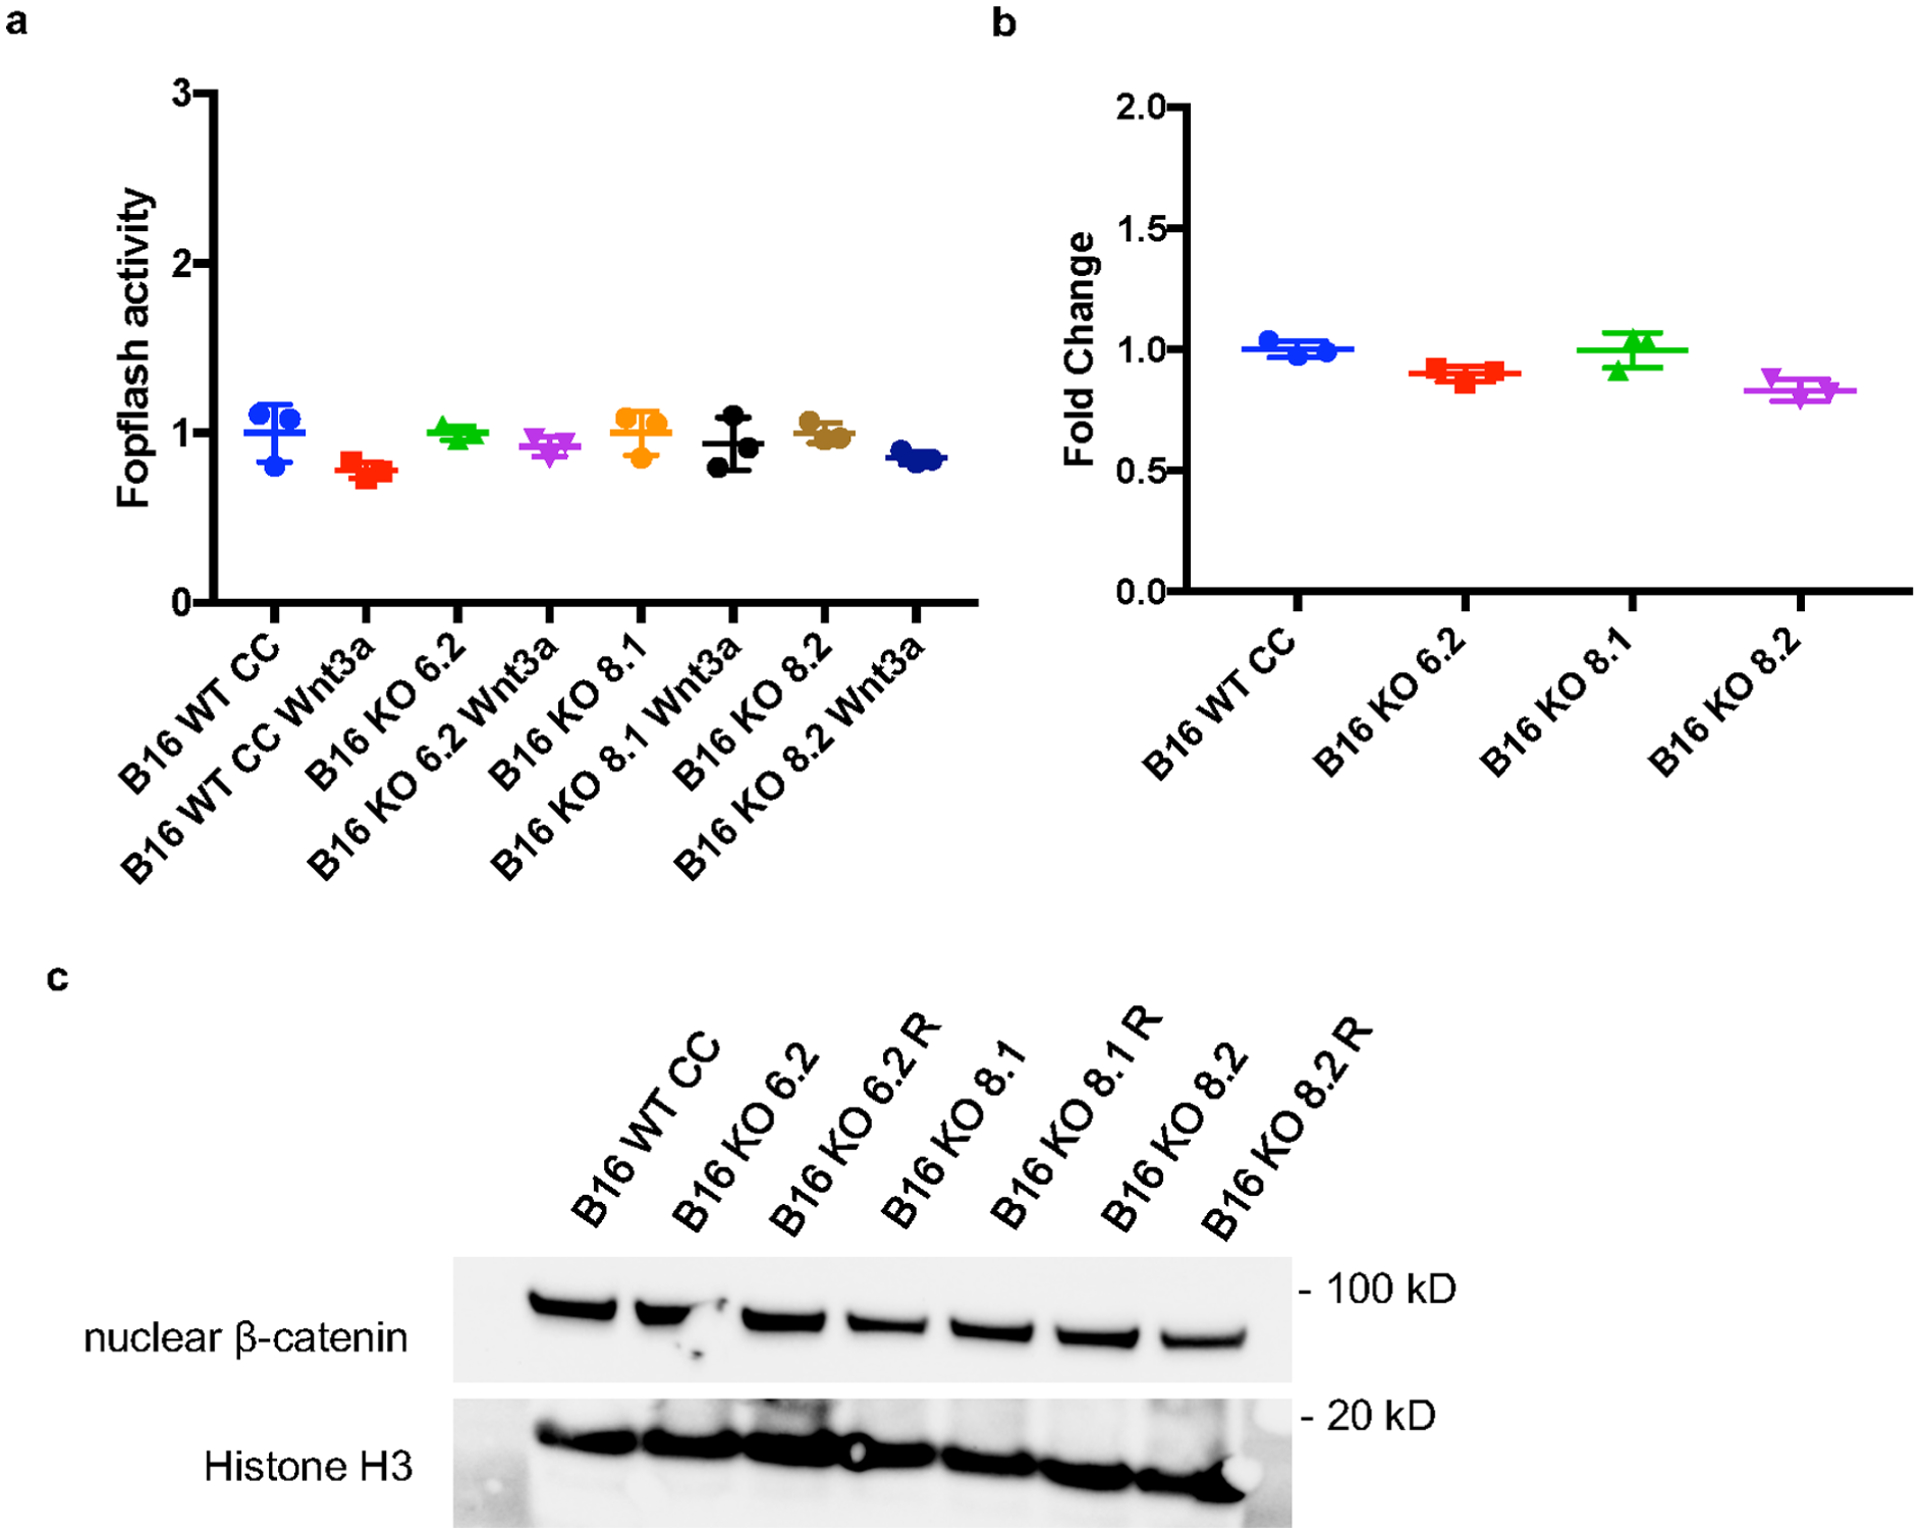
a, Negative control for the Topflash experiment using the Fopflash luciferase vector which contains a mutated version of the TCF/LEF binding motifs. There are no changes in Fopflash activity upon stimulation with Wnt-3a ligand for 8 hours in any of the tested cell lines (n= 3 per group) (P > 0.05 for all comparisons). b, Baseline WNT activity levels assessed by Topflash assay (n= 3 per group). Values were normalized to B16 WT CC cell lines and no significant WNT activity changes were observed between PAK4 WT and KO cell. c, Immunoblots for nuclear β-catenin protein levels show no differences between B16 WT CRISPR control, PAK4 KO and PAK4 rescue cells. Results are representative from three independent experiments. Means +/− SEM two-tailed unpaired t-test a, b. Unprocessed blot images and raw data are provided as a Source Data file a-c.
Extended Data Fig. 5 |
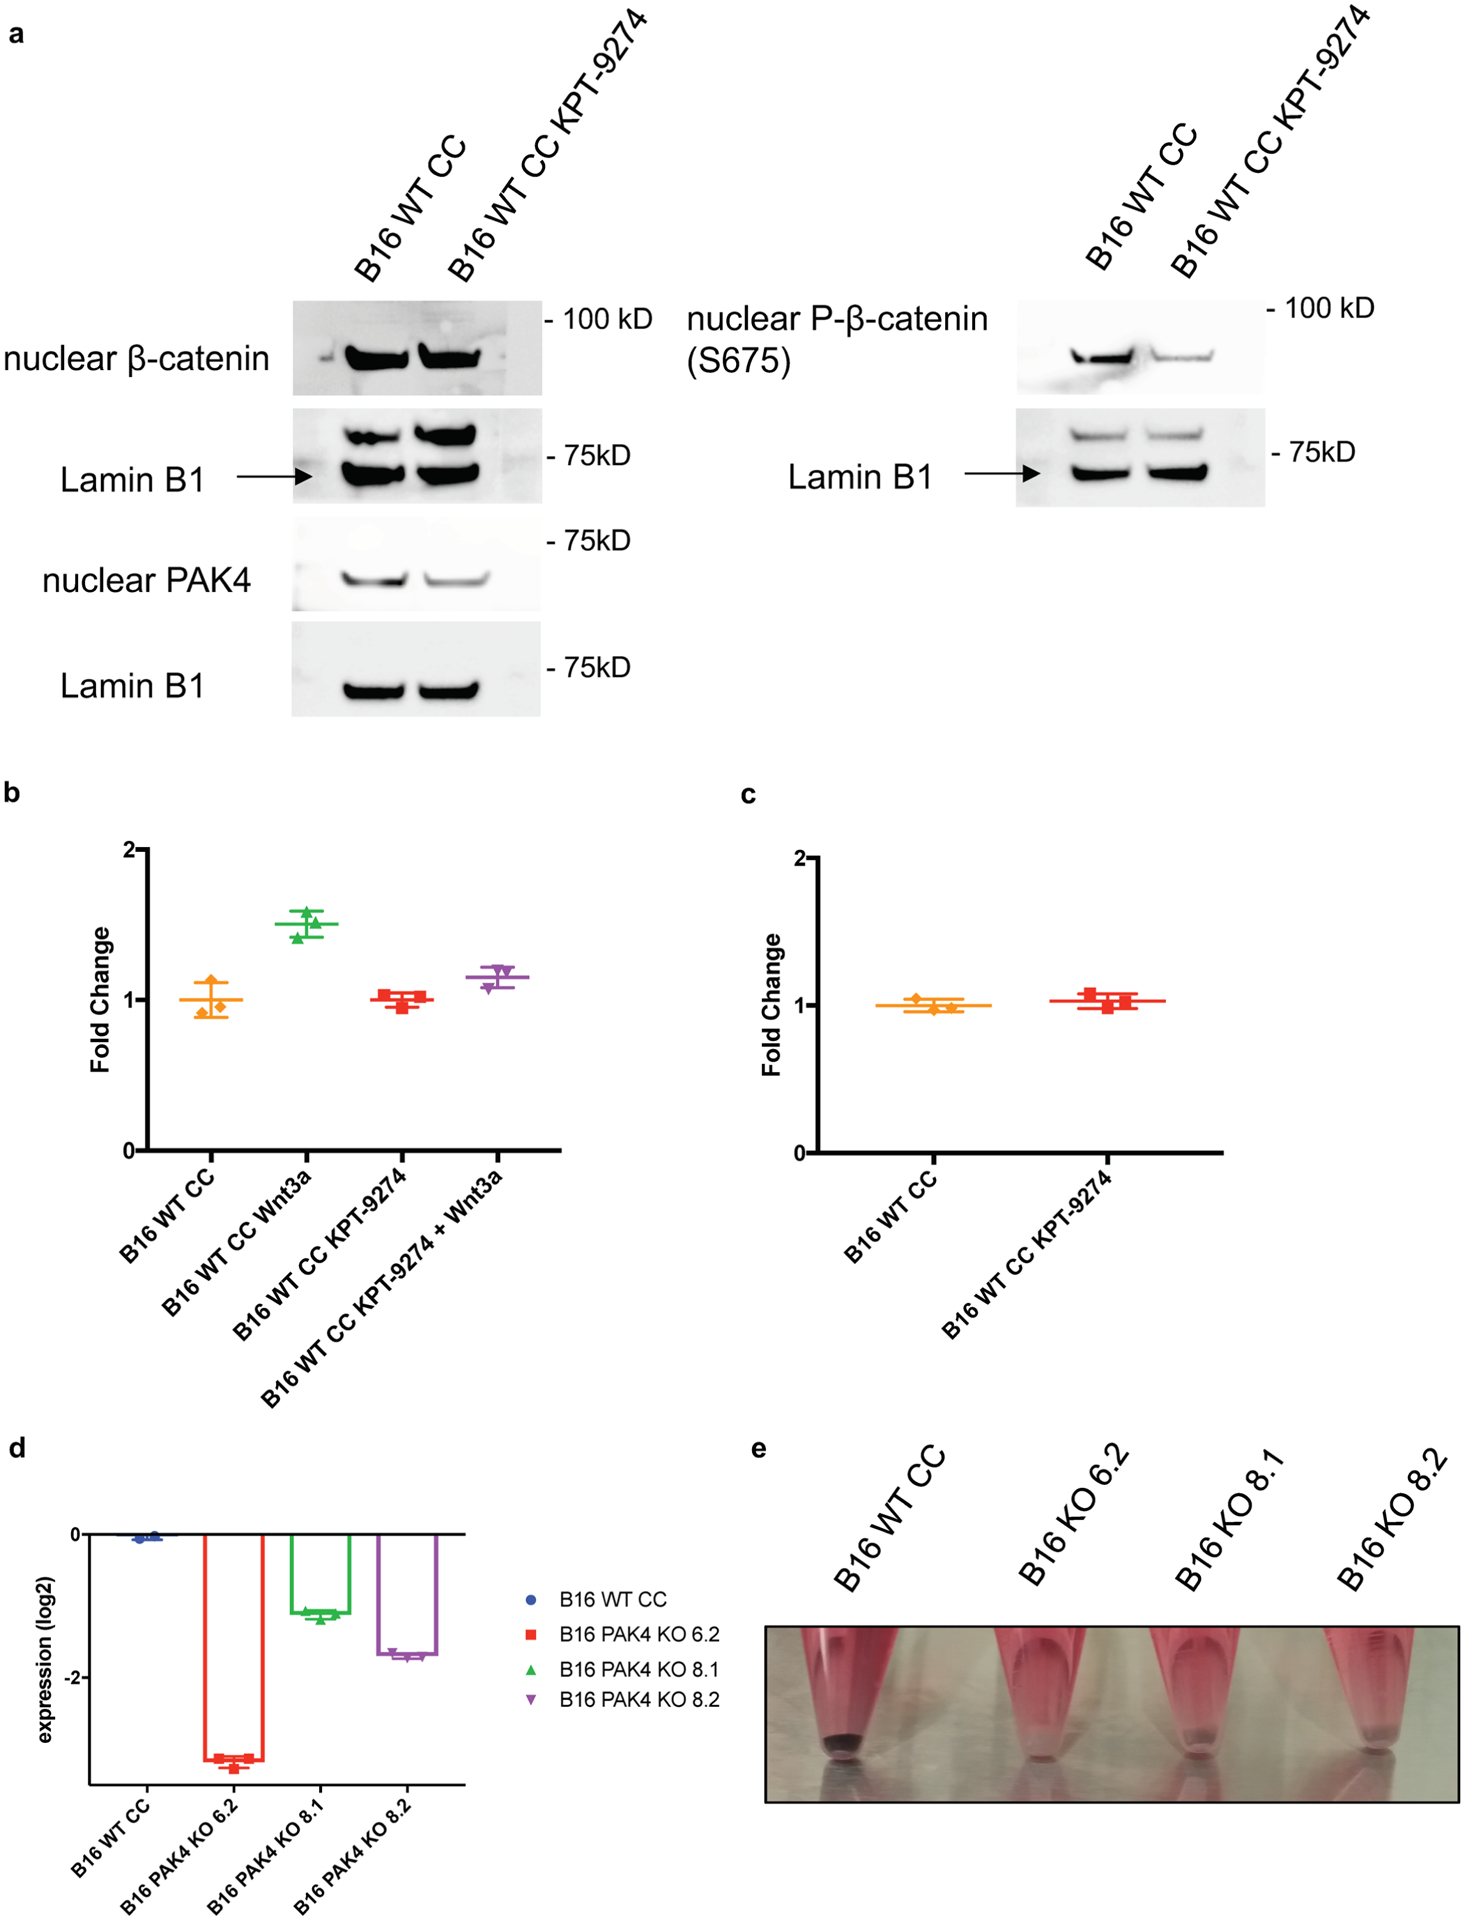
a, Cells were cultured with 2μM KPT-9274 for 72 hours before nuclear protein isolation. Showing immunoblots for nuclear β-catenin, nuclear phosphor-β-catenin (S675) and nuclear PAK4 protein levels. Results are representative from two independent experiments. b, Cells were cultured with 2μM KPT-9274 for 72 hours and Wnt-3a for 8 hours prior to Topflash assay (n= 3 per group). Pharmacological inhibition of PAK4 significantly decreases sensitivity to Wnt-3a stimulation (P= 0.005 for WT Wnt3a vs WT KPT-9274 + Wnt3a comparison). c, Baseline WNT activity levels assessed by Topflash assay of cell treated with 2μM KPT-9274 for 72 hours (n= 3 per group) (P > 0.05). Values were normalized to untreated B16 WT CC cells. d, RT-PCR for tyrosinase expression show that PAK4 depletion reduces the expression levels of this gene. Showing means +/− SEM. Results are normalized to B16 WT CRISPR control levels and then log2 transformed (n= 3). e, For image, cells were cultured and harvest upon reaching 80% confluency. B16 WT CRISPR Control cell line maintains melanin production over time while PAK4 KO clones lose their pigmentation. Results are representative from three independent experiments. Means +/− SEM two-tailed unpaired t-test b, c. Unprocessed blots and raw data are provided as a Source Data file a-c.
Extended Data Fig. 6 |
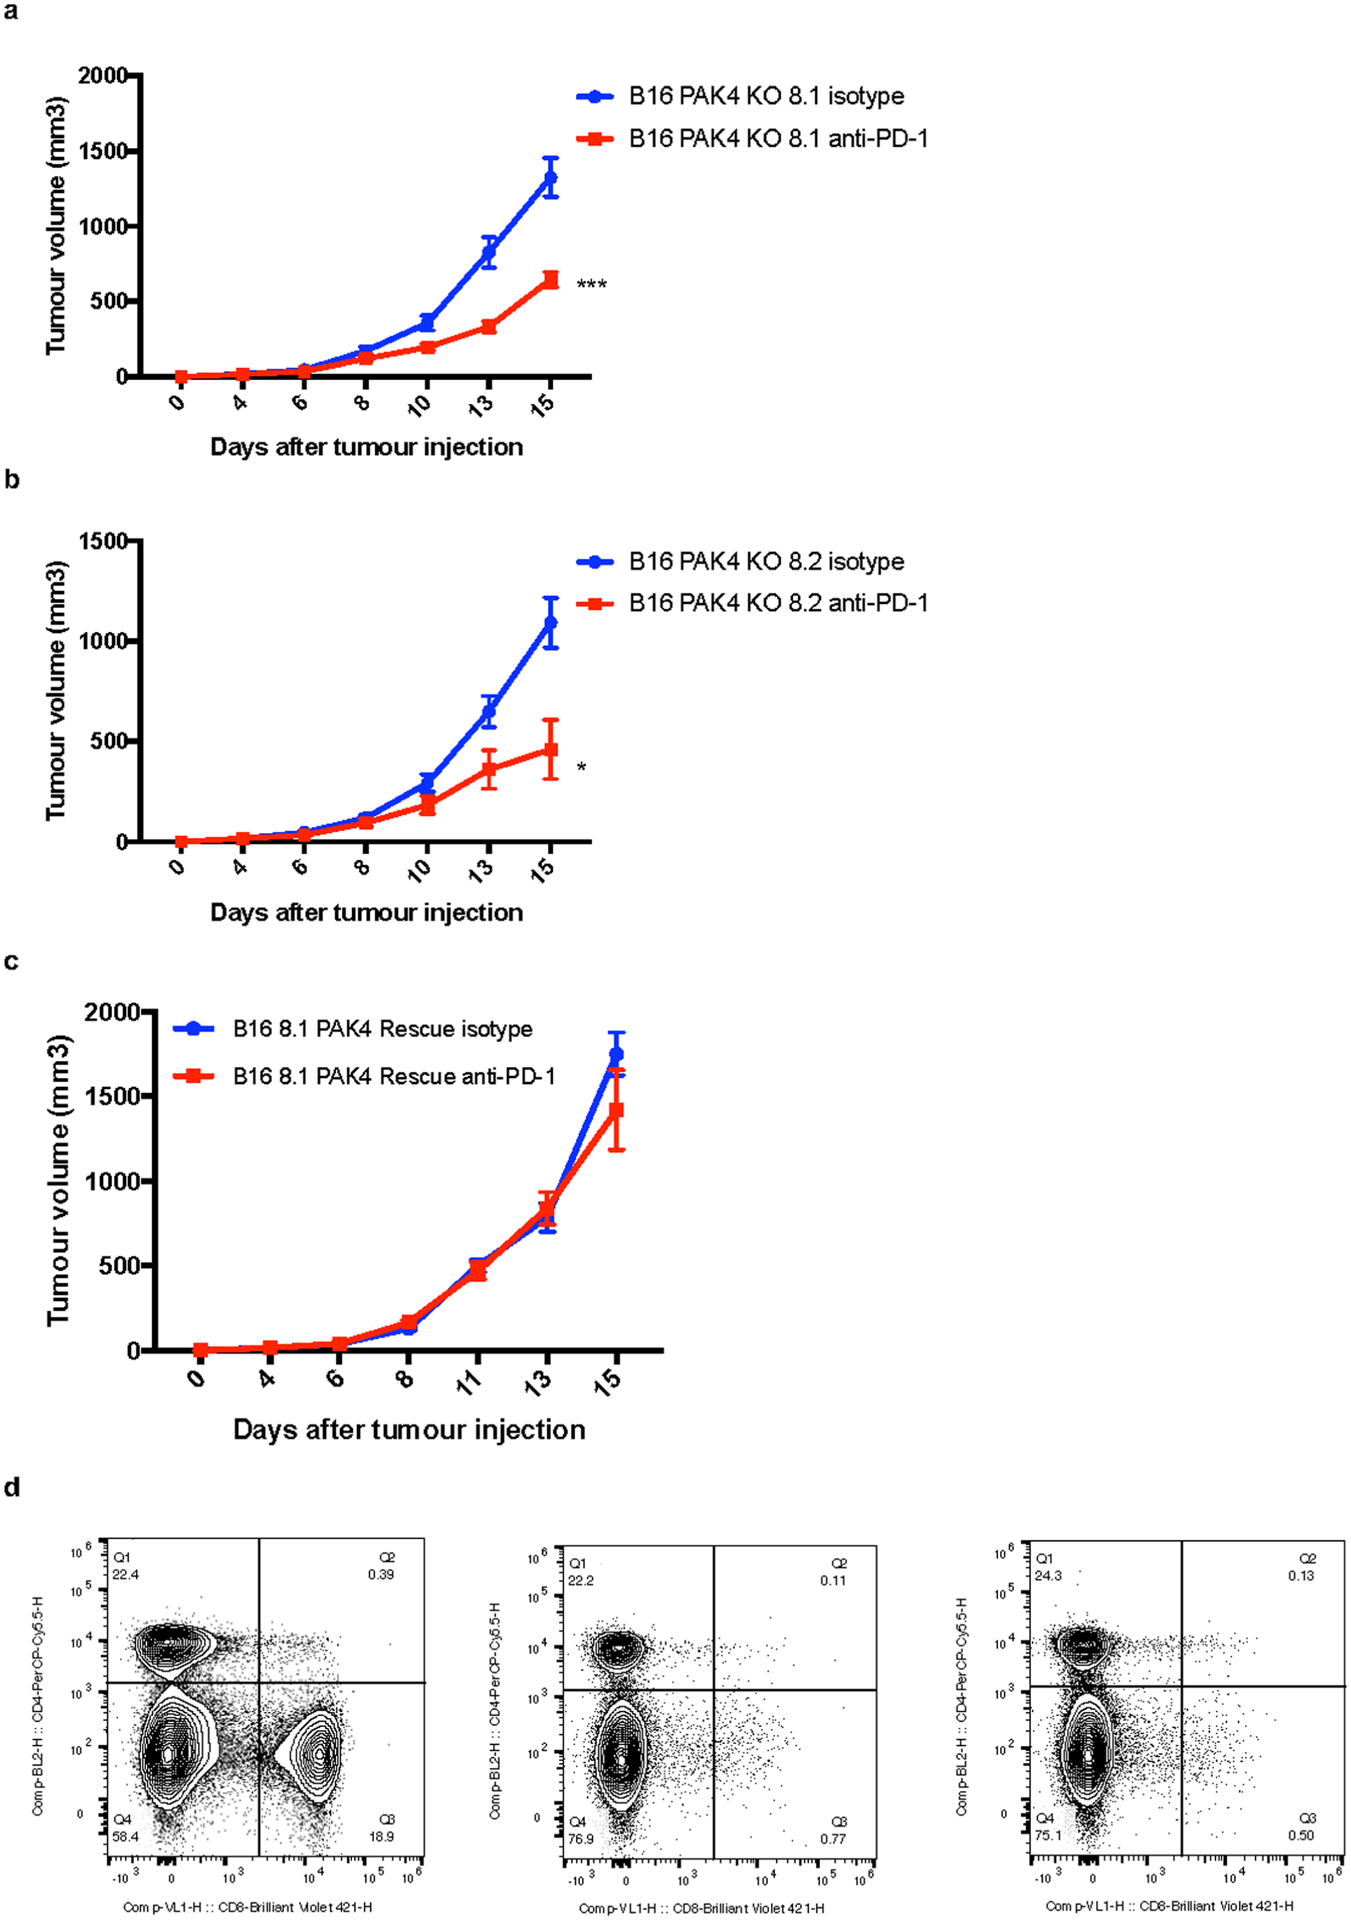
a, Tumour growth curves for B16 PAK4 KO 8.1 tumours treated with isotype (blue, n = 10) or anti-PD-1 (red, n = 12) (P= 0.00024, day 15). b, Tumour growth curves for B16 PAK4 KO 8.2 tumours treated with isotype (blue, n = 10) or anti-PD-1 (red, n = 10) (P= 0.02, day 15). In both PAK4 KO cell lines anti-PD-1 treated tumours showed decreased tumour growth compared to untreated tumours. c, Tumour growth curves for B16 8.1 PAK4 rescue tumours treated with isotype (blue, n = 5) or anti-PD-1 (red, n = 5). Anti-PD-1 treatment did not result in any significant anti-tumour efficacy (P= 0.80, day 15). d, Flow cytometry analysis of CD8 positive splenocytes after CD8 depletion. Left panel show splenocytes pattern without anti-CD8 treatment (CD8 population = 18.9%) while middle and right panel show splenocytes derived from two independent mice treated with anti-CD8 antibody (CD8 population = 0.77% and 0.50% respectively). Plotting the mean +/− s.e.m a-c. Statistical significance and correction for multiple comparisons was calculated using Holm-Sidak method a-c. Raw data is provided as a Source Data file a-c. *P <0.05, **P < 0.01, ***P <0.001, ****P < 0.0001. ns, not significant.
Extended Data Fig. 7 |
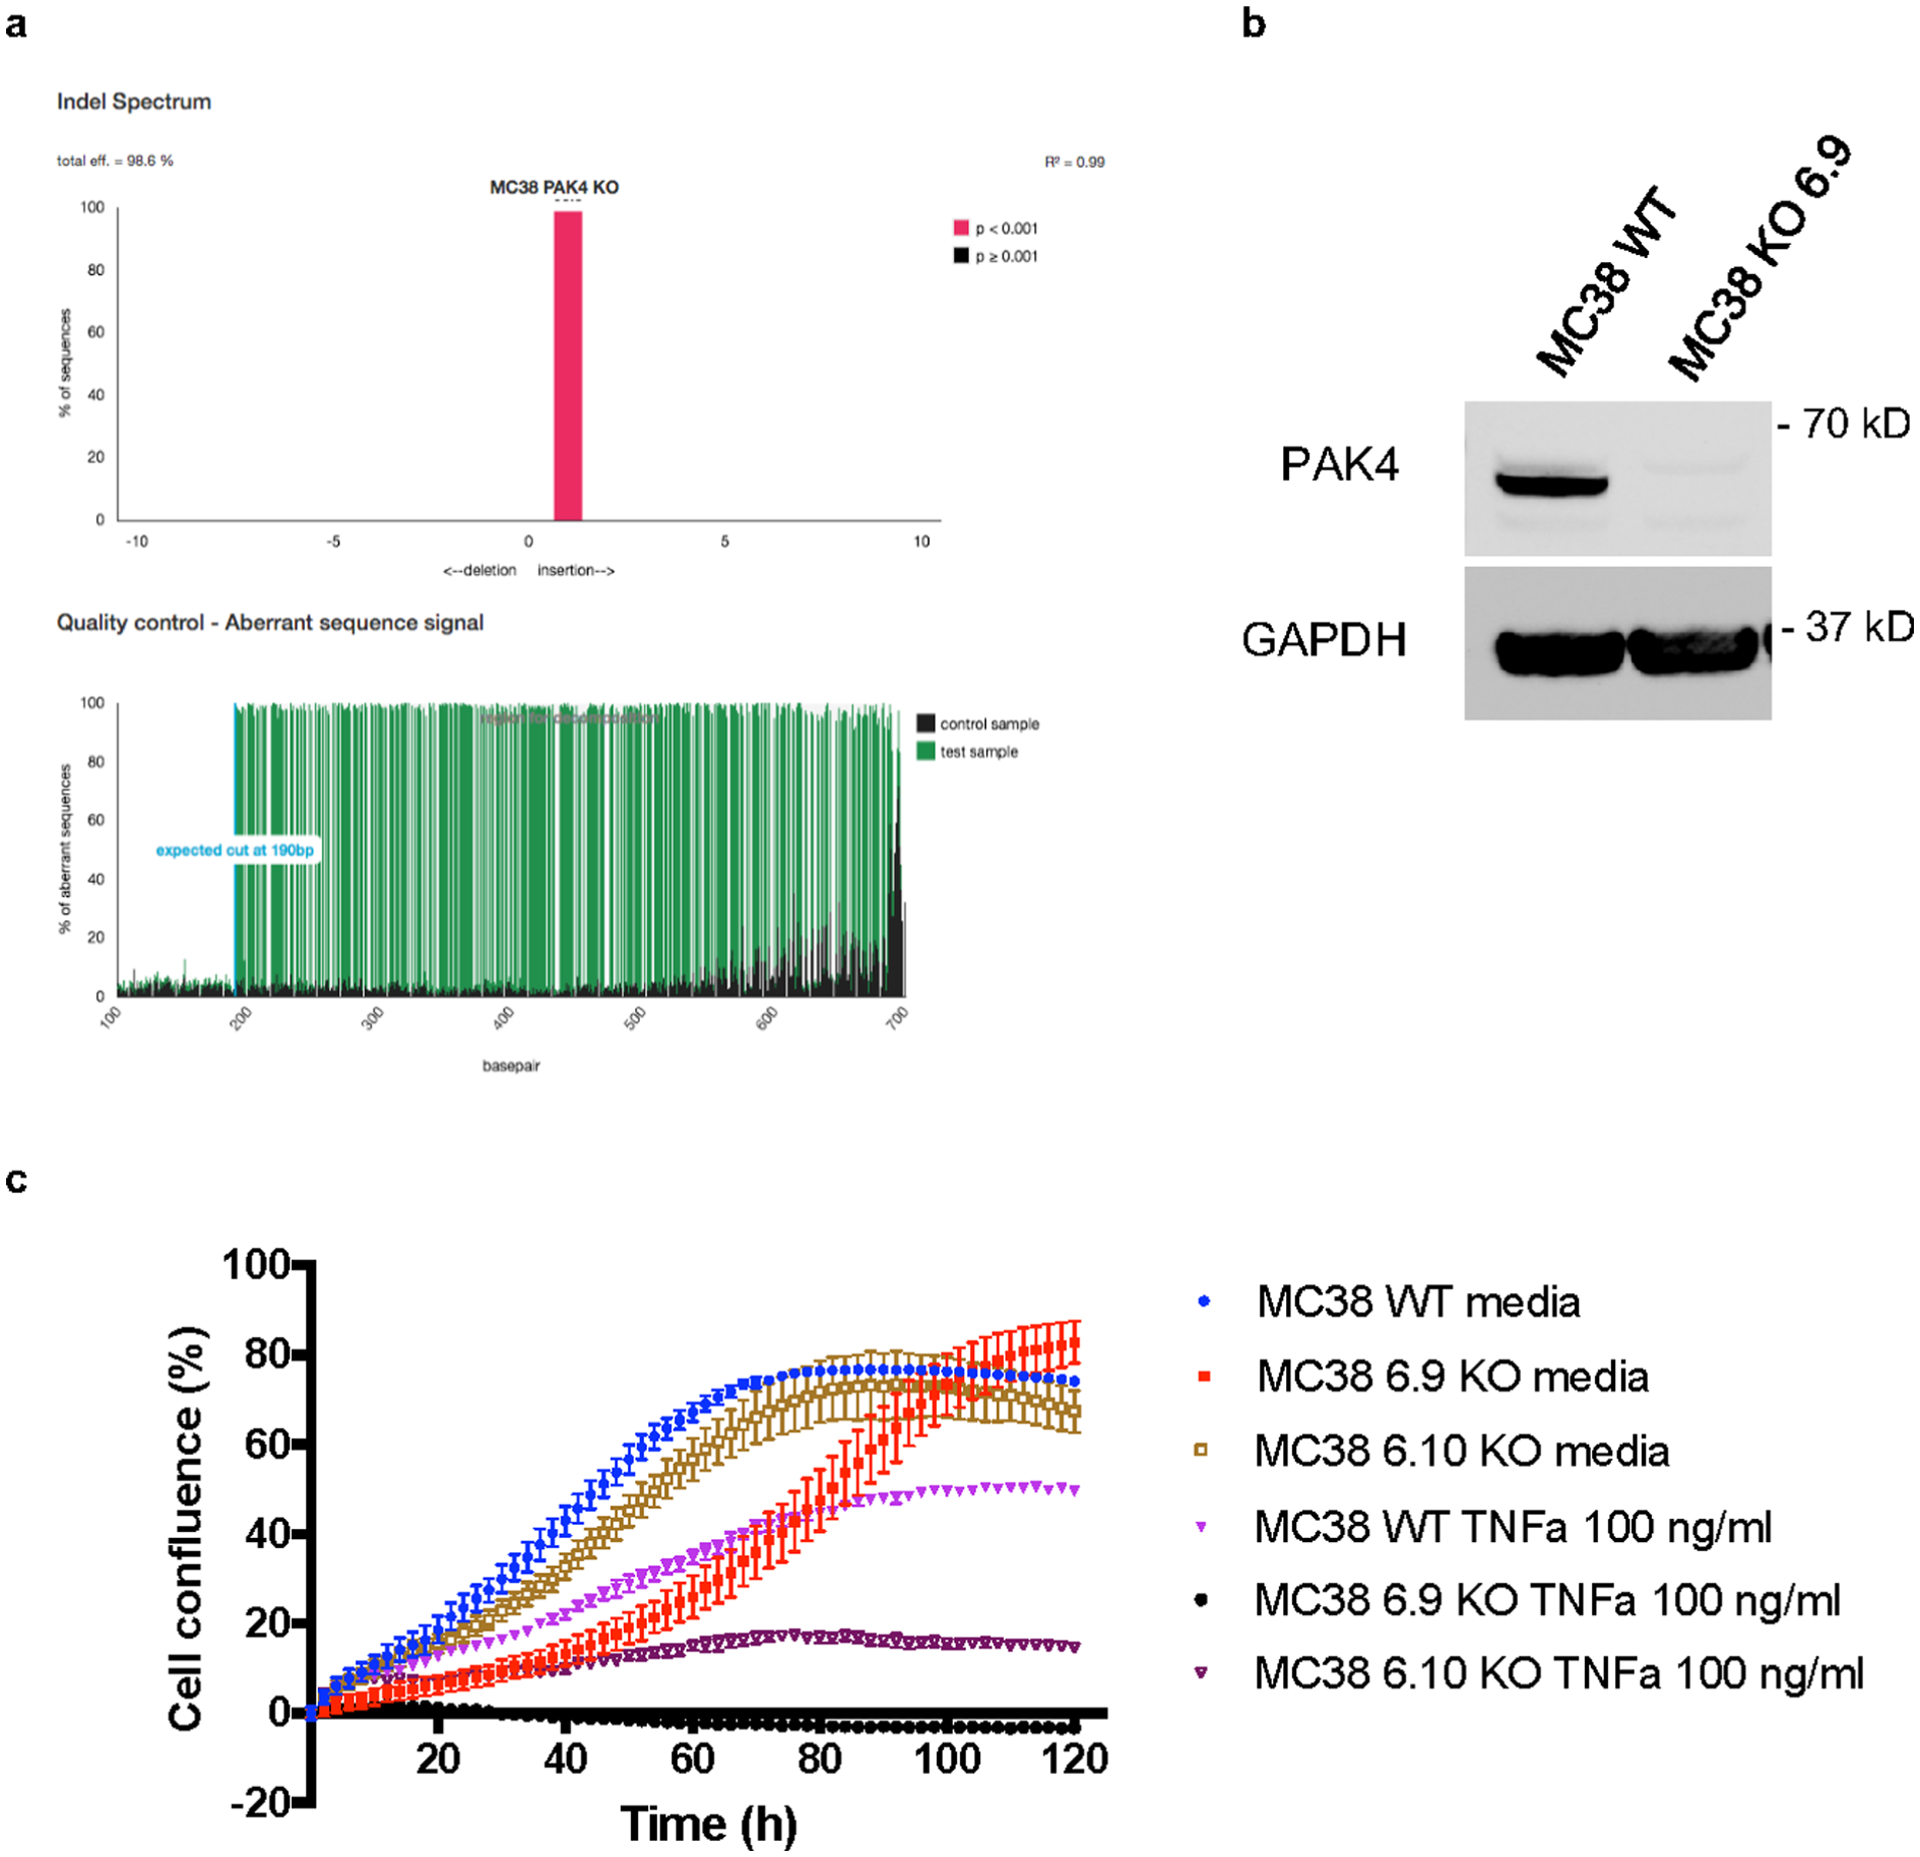
a, TIDE analysis of the MC38 PAK4 KO 6.9 clone. b, Analysis of PAK4 protein expression in MC38 PAK4 KO 6.9 clone and MC38 WT by Western blot. Results are representative from two independent experiments. c, Cells were plated by triplicate into 96 well plates and then treated with TNF at 100ng/mL. Cell proliferation was measured by cell confluence using the IncuCyte S3 Live Cell Analysis System. TNF treatment decreased proliferation of MC38 WT, MC38 PAK4 KO 6.9 and MC38 PAK4 KO 6.10 cells by 41%, 95% and 74% respectively compared to untreated cells (means +/− SEM). Results are representative from three biologically independent experiments. Unprocessed blots are provided as a Source Data file b.
Supplementary Material
Supple Fig 1and2
Supple Tables 1-5
Acknowledgements
This study was funded in part by the Parker Institute for Cancer Immunotherapy, NIH grants R35 CA197633 and P01 CA168585, the Ressler Family Foundation, and support from K. Schultz and D. Schultz (to A.R.). G.A.-R. was supported by the Isabel and Harvey Kibel Fellowship award and Alan Ghitis Fellowship Award for Melanoma Research. D.Y.T. was supported by a Young Investigator Award from the American Society of Clinical Oncology, a grant from the Spanish Society of Medical Oncology for Translational Research in Reference Centers and the V Foundation-Gil Nickel Family Endowed Fellowship in Melanoma Research. J.M.Z. was part of the UCLA Medical Scientist Training Program supported by NIH training grant GM08042. T.S.N. was supported by NIH/NICHD grant K12-HD000850 (Pediatric Scientist Development Program). S.H.-L. was supported by a Young Investigator Award and a Career Development Award from the American Society of Clinical Oncology, a Tower Cancer Research Foundation Grant and a Dr. Charles A. Coltman Fellowship Award from the Hope Foundation. C.-Y.W. was supported by NIH/NIDCR grant R01DE15964. We acknowledge X. Li, L. Dong, J. Yoshizawa and J. Zhou from the UCLA Clinical Microarray Core for sequencing expertise, and J. Min Chen and J. Trent from the Parker Institute for Cancer Immunotherapy Center at UCLA for administrative support. Flow and mass cytometry were performed in the UCLA Jonsson Comprehensive Cancer Center and the Center for AIDS Research Flow Cytometry Core Facility (supported by NIH awards P30 CA016042 and 5P30 AI028697), as well as by the Jonsson Comprehensive Cancer Center, UCLA AIDS Institute and David Geffen School of Medicine at UCLA. The authors thank A. Minden from Rutgers, the State University of New Jersey, for helpful comments.
Footnotes
Competing interests
G.A.-R. has received honoraria for consulting with Arcus Biosciences. W.S. and E.B. were employees of Karyopharm Therapeutics when this study was conducted. A.R. has received honoraria for consulting with Amgen, Bristol-Myers Squibb, Chugai, Genentech, Merck, Novartis, Roche and Sanofi, is or has been a member of the scientific advisory board, and holds stock in Advaxis, Arcus Biosciences, Bioncotech Therapeutics, Compugen, CytomX, Five Prime, FLX Bio, ImaginAb, IsoPlexis, Gilead Kite, Lutris Pharma, Merus, PACT Pharma, Rgenix and Tango Therapeutics. G.A.-R., D.Y.T., C.S.G. and A.R. are inventors in a patent application covering the use of PAK4 inhibitors for cancer immunotherapy.
Extended data is available for this paper at https://doi.org/10.1038/s43018-019-0003-0.
Supplementary information is available for this paper at https://doi.org/10.1038/s43018-019-0003-0.
References
Full text links
Read article at publisher's site: https://doi.org/10.1038/s43018-019-0003-0
Read article for free, from open access legal sources, via Unpaywall:
https://www.ncbi.nlm.nih.gov/pmc/articles/PMC8340852
Citations & impact
Impact metrics
Citations of article over time
Alternative metrics
Article citations
Immunogenic cell death signatures from on-treatment tumor specimens predict immune checkpoint therapy response in metastatic melanoma.
Sci Rep, 14(1):22872, 02 Oct 2024
Cited by: 0 articles | PMID: 39358546 | PMCID: PMC11447205
Targeting IL-33 reprograms the tumor microenvironment and potentiates antitumor response to anti-PD-L1 immunotherapy.
J Immunother Cancer, 12(9):e009236, 03 Sep 2024
Cited by: 0 articles | PMID: 39231544 | PMCID: PMC11409265
Inhibition of NAMPT by PAK4 Inhibitors.
Int J Mol Sci, 25(18):10138, 21 Sep 2024
Cited by: 0 articles | PMID: 39337621 | PMCID: PMC11431865
Integrative analysis of pan-cancer single-cell data reveals a tumor ecosystem subtype predicting immunotherapy response.
NPJ Precis Oncol, 8(1):205, 15 Sep 2024
Cited by: 0 articles | PMID: 39277681 | PMCID: PMC11401940
Genomic and molecular alterations associated with primary resistance to immune checkpoint inhibitors.
Cancer Immunol Immunother, 73(11):234, 13 Sep 2024
Cited by: 0 articles | PMID: 39271499 | PMCID: PMC11399531
Review Free full text in Europe PMC
Go to all (69) article citations
Data
Data behind the article
This data has been text mined from the article, or deposited into data resources.
BioStudies: supplemental material and supporting data
Clinical Trials
- (1 citation) ClinicalTrials.gov - NCT02702492
Similar Articles
To arrive at the top five similar articles we use a word-weighted algorithm to compare words from the Title and Abstract of each citation.
PAK4 inhibition improves PD1 blockade immunotherapy in prostate cancer by increasing immune infiltration.
Cancer Lett, 555:216034, 10 Dec 2022
Cited by: 6 articles | PMID: 36509363
Remodeling of the tumor microenvironment through PAK4 inhibition sensitizes tumors to immune checkpoint blockade.
Cancer Res Commun, 2(10):1214-1228, 19 Oct 2022
Cited by: 4 articles | PMID: 36588582 | PMCID: PMC9799984
CDK4/6 inhibition promotes immune infiltration in ovarian cancer and synergizes with PD-1 blockade in a B cell-dependent manner.
Theranostics, 10(23):10619-10633, 25 Aug 2020
Cited by: 62 articles | PMID: 32929370 | PMCID: PMC7482823
The role of PAK4 in the immune system and its potential implication in cancer immunotherapy.
Cell Immunol, 367:104408, 01 Jul 2021
Cited by: 7 articles | PMID: 34246086
Review
Funding
Funders who supported this work.
NCI NIH HHS (4)
Grant ID: P01 CA168585
Grant ID: P30 CA016042
Grant ID: R35 CA197633
Grant ID: P01 CA244118
NIAID NIH HHS (1)
Grant ID: P30 AI028697
NICHD NIH HHS (1)
Grant ID: K12 HD000850
NIDCR NIH HHS (1)
Grant ID: R01 DE015964
NIGMS NIH HHS (1)
Grant ID: T32 GM008042


