Abstract
Free full text

The physiological basis of pulmonary arterial hypertension
Associated Data
Abstract
Pulmonary arterial hypertension (PAH) is a rare dyspnoea-fatigue syndrome caused by a progressive increase in pulmonary vascular resistance and eventual right ventricular (RV) failure. In spite of extensive pulmonary vascular remodelling, lung function in PAH is generally well preserved, with hyperventilation and increased physiological dead space, but minimal changes in lung mechanics and only mild to moderate hypoxaemia and hypocapnia. Hypoxaemia is mainly caused by a low mixed venous oxygen tension from a decreased cardiac output. Hypocapnia is mainly caused by an increased chemosensitivity. Exercise limitation in PAH is cardiovascular rather than ventilatory or muscular. The extent of pulmonary vascular disease in PAH is defined by multipoint pulmonary vascular pressure–flow relationships with a correction for haematocrit. Pulsatile pulmonary vascular pressure–flow relationships in PAH allow for the assessment of RV hydraulic load. This analysis is possible either in the frequency domain or in the time domain. The RV in PAH adapts to increased afterload by an increased contractility to preserve its coupling to the pulmonary circulation. When this homeometric mechanism is exhausted, the RV dilates to preserve flow output by an additional heterometric mechanism. Right heart failure is then diagnosed by imaging of increased right heart dimensions and clinical systemic congestion signs and symptoms. The coupling of the RV to the pulmonary circulation is assessed by the ratio of end-systolic to arterial elastances, but these measurements are difficult. Simplified estimates of RV–pulmonary artery coupling can be obtained by magnetic resonance or echocardiographic imaging of ejection fraction.
Short abstract
Pulmonary arterial hypertension (PAH) is a dyspnoea–fatigue syndrome diagnosed on the basis of measurements of the pulmonary circulation, lung mechanics, gas exchange and the right heart, whose physiological basis is re-explained and updated https://bit.ly/3EhDf24
Introduction
Pulmonary arterial hypertension (PAH) is a rare dyspnoea-fatigue syndrome due to a progressive increase in pulmonary vascular resistance (PVR) and eventual right ventricular (RV) failure. The diagnosis of PAH relies on the exclusion of cardiac, pulmonary or thrombo-embolic causes of increased pulmonary artery pressure (PAP) followed by a right heart catheterisation showing a mean pulmonary arterial pressure (mPAP) >20 mmHg, a wedged PAP (PAWP) ≤15 mmHg and a PVR ≥3 Wood units [1]. PAH is idiopathic (IPAH) in approximately half of the cases [1]. In spite of therapeutic advances during the past decades, PAH remains incurable [2].
The histopathology of PAH is characterised by arteriolar intimal proliferation, evolving to aspects of concentric or eccentric laminar sclerosis, medial hypertrophy and adventitial proliferation, with variable inflammatory reactions and occasional aspects of fibrinoid necrosis [3, 4]. Advanced PAH may be associated with so-called plexiform lesions consisting of a proliferation of channels with an accumulation of endothelial and inflammatory cells in the vicinity of occluded arterioles. These aspects are illustrated in figure 1. Plexiform lesions are scattered; with a preference for supernumerary arteries, branches that arise perpendicularly from large muscular or even elastic pulmonary artery. They do not bear relationship to increased PVR. They cannot actually be found in approximately two-thirds of the patients [4]. Microthrombotic lesions may also occur, in up to one-third of PAH patients, also without clear relationship to increased PVR [4]. Medial hypertrophy is correlated to acute prostacyclin-induced decrease in PVR [5].
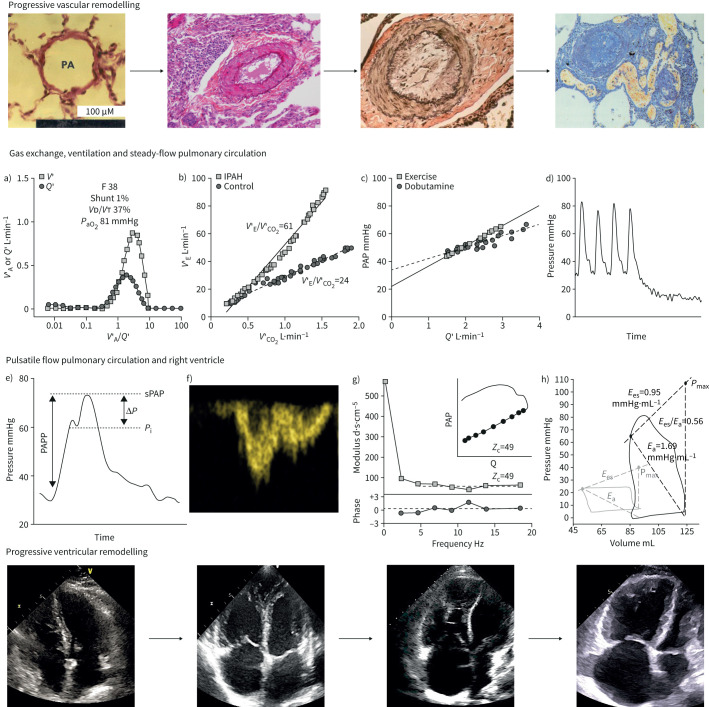
Progressive remodelling of the pulmonary circulation (upper row) and of the right heart (lower row) with, in-between, typical measurements of pulmonary ventilation and gas exchange, steady-flow and pulsatile-flow haemodynamics and right ventricular (RV) function in pulmonary arterial hypertension (PAH). Vascular remodelling was defined by microscopic views from normal (left) to medial hypertrophy, thickening of the three layers of vascular wall and plexiform lesions (upper right). Cardiac remodelling was defined by two-dimensional four-chamber echocardiographic views of right atrial and ventricular dilatation and septal shift ventricular dilatation, respectively. Arrows indicate hypothetical disease progression with increasingly dilating RV and right atrial dimensions. In between are measurements in typical patients with severe idiopathic PAH (IPAH): a) quasi-normal distribution of alveolar ventilation (V′A) and perfusion (Q′) as a function of V′/Q′ relationships, arterial partial pressure of oxygen (PaO2) and physiological dead space (dead space volume (VD)/tidal volume (VT)), but with increased V'A; b) increased ventilation (V′E) as a function of carbon dioxide output (V′CO2) during exercise; c) Poon-adjusted mean pulmonary artery pressure (PAP) as a function of cardiac output (Q′) increased by either exercise or dobutamine showing a decreased slope and increased extrapolated pressure intercept (n=7 patients); d) PAP decay curve after single arterial occlusion showing increased inflection point; e) RV pressure curve with increased pulse pressure, late systolic peaking and increased augmentation index; f) Doppler RV outflow tract flow with shortened acceleration time and mid-systolic deceleration; g) pulmonary artery impedance spectrum, or pressure/flow and phase as a function of frequency, showing an upward shift with increased 0 Hz and high-frequency impedances and low-frequency negative phase angle, with increased characteristic impedance (Zc) in either frequency- or time-domain; h) RV pressure–volume loops with increased end-systolic elastance (Ees) in the presence of increased arterial elastance (Ea), but decreased Ees/Ea and increased dimensions as compared to control measurements. PAPP: pulmonary arterial pulse pressure; sPAP: systolic pulmonary arterial pressure; Pi: inflection of the upstroke pressure. Histological views and echocardiographic images are courtesies from Andrew Peacock (Regional Heart and Lung Centre, Glasgow, UK) and Michele D'Alto (Monaldi Hospital, Naples, Italy). Panel c) is reproduced from [34], with permission.
While the pulmonary circulation is extensively remodelled in PAH, symptoms and outcome in these patients are largely determined by altered RV structure and function [6, 7]. The concept of PAH as a two-sided pulmonary/cardiac entity is summarised in the upper and lower rows of the central illustration (figure 1).
The physiological bases of both aspects of PAH are reviewed, with focus on the idiopathic form of the condition to avoid the confounding effects of comorbidities.
Lung mechanics, ventilation and gas exchange
Lung function tests in PAH show a mild restriction in volumes, and no or only a mild decrease in diffusing capacity of the lung for carbon monoxide (DLCO) is documented in registries of rigorously confirmed cases of IPAH [8]. A more important decrease in DLCO is reported in more contemporary PAH registries, which include older patients with associated conditions, smoking, clinically silent cardiovascular or respiratory conditions and less stringent haemodynamic definition [9, 10]. There may be an increase in small-airways resistance in advanced PAH as a cause of dynamic hyperinflation and exercise-induced dyspnoea [11, 12]. Decreased respiratory muscle strength has also been reported [13]. However, these alterations in lung mechanics and respiratory muscle function do not appear to limit aerobic exercise capacity [14, 15].
Arterial blood gas analysis in PAH is characterised by normal or decreased arterial partial pressures of oxygen (PaO2) and carbon dioxide (PaCO2) [8, 9, 16]. As illustrated in figure 2, either PaO2 or PaCO2 are below normal in approximately half of the patients, but severe hypocapnia is more common than severe hypoxaemia [16]. Hypocapnia, but not hypoxaemia, is an independent predictor of decreased survival in IPAH [17]. Arterial blood gases, spirometry and DLCO are similarly disturbed in IPAH and in chronic thromboembolic pulmonary hypertension (CTEPH), so that these measurements cannot be used to distinguish between the two conditions [18].
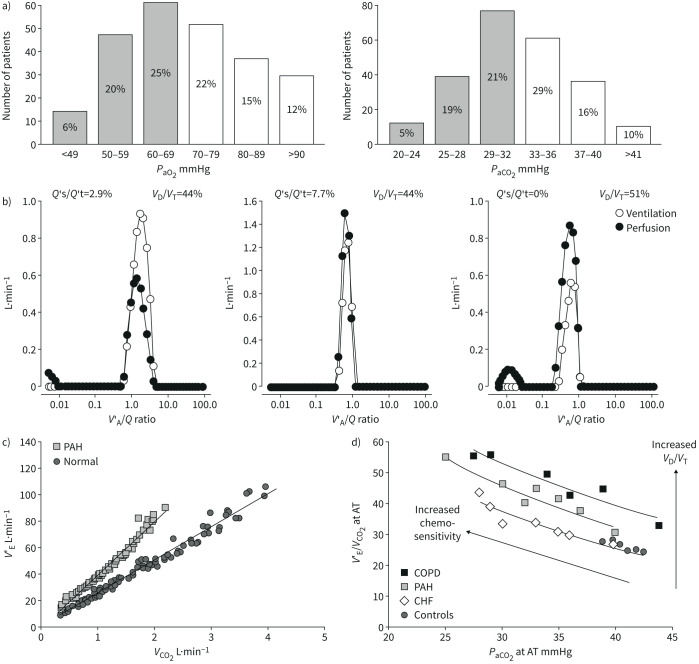
a) Distribution of arterial blood gases in 243 patients with idiopathic pulmonary arterial hypertension (IPAH). Most values are decreased, with 51% of PaO2 <70 mmHg, and 45% of PaCO2 <33 mmHg taken as lower limits of normal (shaded columns). b) Alveolar ventilation (V′A)/perfusion (Q′) distributions in a patient with IPAH before and after a normalisation procedure correcting for increased V′A and decreased Q′, and in a middle-aged control (from left to right). In the IPAH patient, V′A/Q′ distributions are shifted to higher V′A/Q′, but V′A and Q′ modes remain matched. Both the IPAH patient and the healthy control have a small amount of perfusion to low V′A/Q′. The IPAH patient has also a small amount of shunt (V′A/Q′=0) which was increased with correction for high V′A and low Q′. c) Ventilation (V′E) as a function of carbon dioxide (CO2) output adjusted for interindividual variability in 12 PAH patients and in 10 controls. V′E was increased at rest and more so at exercise. d) Plotting V′E/V′CO2 as a function of arterial carbon dioxide tension (PaCO2) at the anaerobic threshold during exercise (AT) uncovers increased dead space ventilation (dead space volume (VD)/tidal volume (VT)) and chemosensitivity as causes of increased ventilation in PAH and COPD, or only increased chemosensitivity in heart failure patients. The arterial to end-tidal oxygen tension gradient increased >5 mmHg (the upper limit of normal) in PAH and in COPD. Reproduced from [16] and [25] with permissions.
The physiology of abnormal blood gases in PAH was explored using the multiple inert gas elimination technique in the 1980s [19–21]. Alveolar ventilation (V′A)/perfusion (Q′) matching was found to be preserved, with no additional modes of ventilation or perfusion to higher or lower than normal V′A/Q′. Physiological dead space as calculated by the Bohr–Enghoff equation was increased. Hypoxaemia at rest and during exercise was explained by a decreased mixed venous oxygen tension (PO2) due to a low cardiac output, combined with a mild inhomogeneity of perfusion distribution [19–21]. Administration of the calcium channel blocker nifedipine in two of the patients increased perfusion to lower than normal V′A/Q′, but this alteration in gas exchange was not associated with a decrease in PaO2, because of increased cardiac output and mixed venous PO2 [20]. Occasional severe arterial hypoxaemia was explained by the addition of a right-to-left cardiac shunt through a patent with a foramen ovale [20]. There was no diffusion limitation of alveolar-to-arterial PO2 gradients [19–21]. Arterial hypoxaemia in PAH is a form of “haemodynamic hypoxaemia”, that is arterial hypoxaemia mainly caused by mixed venous hypoxaemia with a low cardiac output [16].
Distributions of V′A/Q′ in a healthy subject and in a patient with IPAH are illustrated in figure 2. The V′A/Q′ distributions in the IPAH patient were recalculated after correcting for increased ventilation and decreased cardiac output, as is possible using the mathematical model of the method [22]. It can be seen that mean V′A/Q′ shifted back to normal with tightening of both V′A and Q′ modes, but shunt (V′A/Q′=0) increased. The latter finding is explained by both increased Q′ and decreased V′A [16].
Patients with PAH hyperventilate at rest, during exercise and even during sleep, in relation to increased physiological dead space and chemosensitivity [16]. Increased chemosensitivity in PAH has been demonstrated by measurements of increased ventilatory responses to both hypoxaemia and hypercapnia [23]. Physiological dead space as calculated by the Bohr–Enghoff equation is sensitive to increased ventilation [24]. The respective contributions of increased chemosensitivity and dead space to hyperventilation in PAH can be sorted out by plotting ventilatory equivalents for carbon dioxide (CO2) (ventilation (V′E) versus CO2 output (V′CO2)) as a function of either end-tidal or PaCO2 [25] (figure 2). An upward shift of V′E/V′CO2 versus PaCO2 curves with an increase of the arterial to end-tidal CO2 tension gradient to above the upper limit of normal of 5 mmHg suggests an increased physiological dead space [16]. Only slightly higher than normal CO2 tension gradients are typically found in PAH [26]. Thus, hyperventilation in PAH is predominantly due to increased chemosensitivity.
The mechanisms of increased chemosensitivity in PAH remain incompletely understood [27]. Ventilation at rest and during exercise in PAH is unrelated to PaO2, PaCO2 or pH [28], but tightly correlated to RV diastolic stiffness [26]. This observation is consistent with increased sympathetic nervous system activity demonstrated by microneurographic studies in PAH patients [29, 30]. Both increased sympathetic activation and increased V′E/V′CO2 are of poor prognosis in PAH [30, 31].
Clinical relevance
Pulmonary gas exchange in PAH is surprisingly well preserved. Hyperventilation and altered blood gases in these patients are essentially explained by a combination of decreased cardiac output, increased physiological dead space and increased chemosensitivity.
Pulmonary circulation: steady-flow haemodynamics
Pulmonary vascular resistance
The definition of PAH rests on a determination of PVR [1]. However, PVR decreases with increased cardiac output because of flow- and pressure-induced vascular recruitment and/or distension [32, 33], Therefore, the resistive properties of the pulmonary circulation in PAH or pulmonary hypertension on left heart failure are better defined by multipoint pressure–flow relationships. This approach has been used to unravel the effects of prostacyclin therapy in PAH [34]. In that study, parenteral epoprostenol decreased the slope of mPAP–cardiac output relationships, while resting PVR remained unchanged (figure 3).
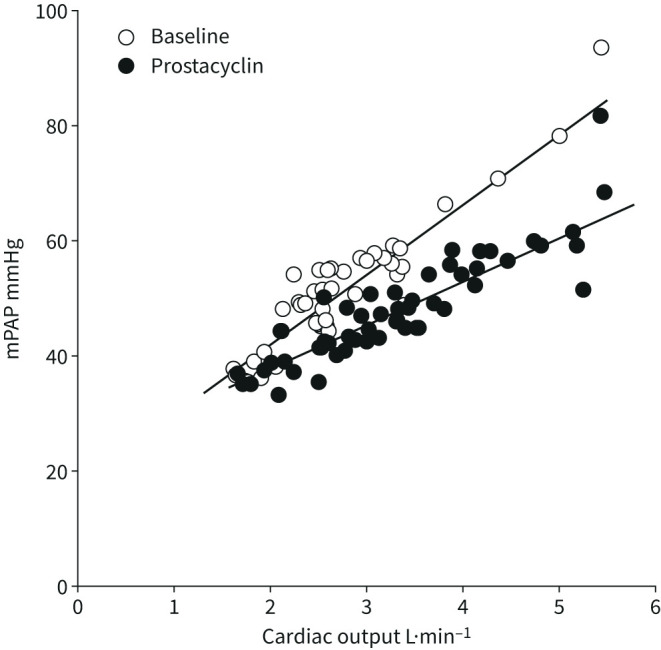
Mean pulmonary artery pressure (mPAP) as a function of cardiac output increased by exercise in seven patients before and after 6 weeks of prostacyclin therapy, which was associated with an improvement in the 6-min walk distance by an average of 80 m. Prostacyclin did not affect resting pulmonary vascular resistance (PVR), but decreased exercise PVR and the slope of mPAP as a function of cardiac output (data from [36]).
As illustrated in figures 1 and and3,3, the slope of the linear adjustment of mPAP–cardiac output relationships in PAH is less than predicted by the PVR equation [34, 35]. This is explained by an increased pulmonary vascular closing pressure [32, 33]. The slope of mPAP–cardiac output in pulmonary hypertension on heart failure during exercise is steeper than predicted by the PVR equation [36]. As discussed previously [35], this is to be explained by exercise-induced pulmonary vasoconstriction and increased PAWP.
In healthy individuals with fully recruited lung vessels, the decrease in PVR with increasing cardiac output is explained by resistive vessel distension, known from in vitro experiments to be a 2% change in diameter per mmHg of transmural pressure [37]. Accordingly, the PVR equation can be improved by the incorporation of a resistive vessel distensibility coefficient α (in %·mmHg−1) with R0 calculated as the ratio between mPAP and cardiac output (Q′) [38]

This equation allows the calculation of α from a set of pulmonary vascular pressure and flow measurements [37]. The derived distensibility factor α is normally 1.5–2%·mmHg−1; is lower in men compared to pre-menopausal women; and decreases with ageing and chronic, but not acute, hypoxic exposure [37, 39, 40]. It is reduced in early or latent pulmonary vascular disease [41, 42] and in heart failure with preserved ejection fraction (EF) [42, 43]. In PAH, mPAP–cardiac output relationships conform to a linear or quasi-linear model, and thus flow-induced decrease in PVR is mainly to be accounted for by a recruitment of closed resistive vessels [35]. As illustrated in figure 4, in normal fully recruited lungs, pulmonary vascular distension by only 1–2%·mmHg−1 markedly limits the increase in PAP at increased cardiac output during exercise [40, 41].
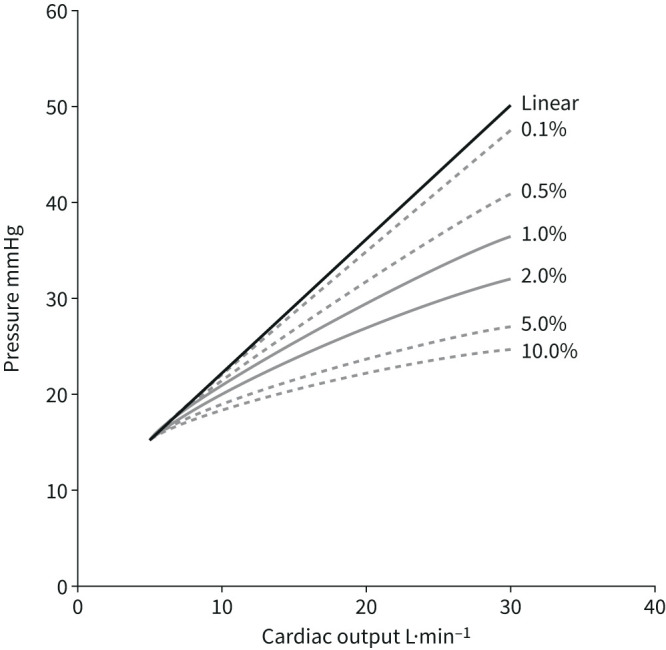
Modelled mean pulmonary arterial pressure (mPAP)–cardiac output relationships during dynamic exercise with progressively increased distensibility coefficients α from 0 to 10% of vessel diameter per mmHg transmural pressure. Normal values for α are between 1%·mmHg−1 and 2%·mmHg−1. Pulmonary vascular distension markedly decreases mPAP at high levels of cardiac output. Reproduced from [40] with permission.
Blood is not a Newtonian fluid, so that PVR increases linearly as a function of blood viscosity, which in turn is exponentially related to haematocrit. As illustrated in figure 5, the impact of haematocrit on PVR increases at high haematocrit, PVR and PAWP [44]. Measurements of PVR in anaemic or polycythaemic patients may markedly under- or over-estimate pulmonary vascular obstruction.
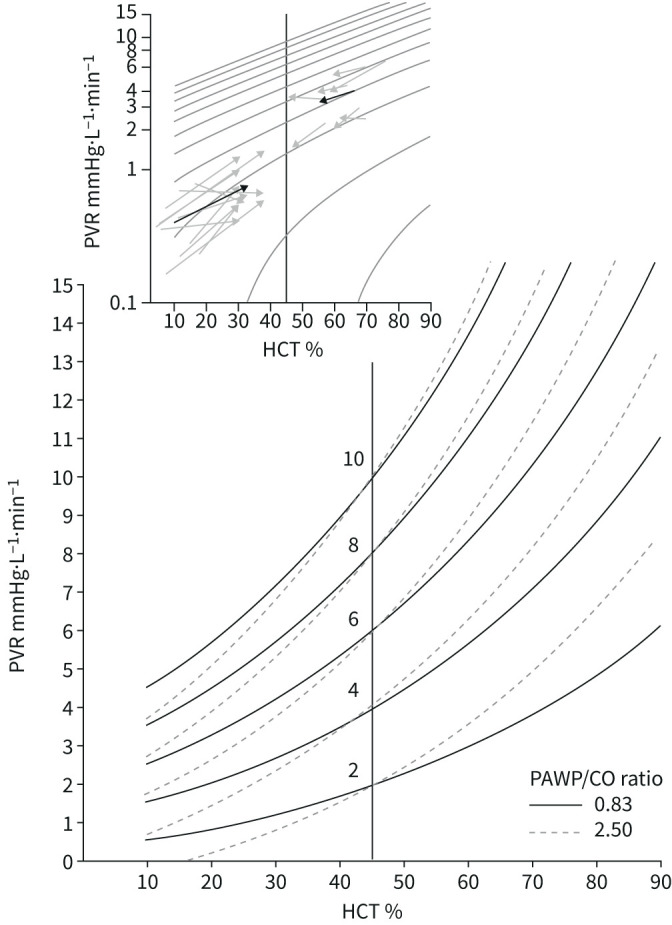
Pulmonary vascular resistance (PVR) as a function of haematocrit (HCT). Iso-PVR curves allow for a prediction of PVR “normalised” for HCT at 45% in anaemic or polycythaemic patients, at normal or increased pulmonary artery wedge pressures (PAWP) versus cardiac output (CO) relationships. Measured PVR in anaemic or polycythaemic patients at increased or decreased HCT by blood transfusion or haemodilution are shown by arrows in the upper window, with mean responses (thick arrows) showing conformance to predicted changes. Reproduced from [44] with permission.
Distensibility models of the pulmonary circulation allow the recalculation of the amount of pulmonary vascular obstruction from a given pair of mPAP and cardiac output measurements [45]. This is illustrated in figure 6. At a cardiac output of 5 L·min−1, a mPAP of 25 mmHg (former definition of pulmonary hypertension) corresponds to 50% obstruction (or resection of one lung), while a mPAP of 20 mmHg (new definition of pulmonary hypertension) correspond to 20–25% obstruction.
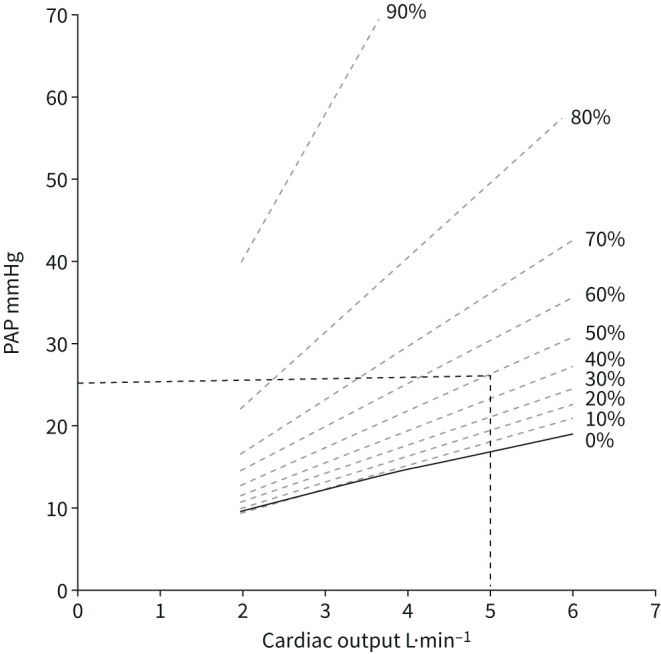
Model predictions of percentage of pulmonary vascular obstruction by linearised adjustments of mean pulmonary artery pressure (mPAP) as a function of cardiac output. mPAP 25 mmHg or 20 mmHg at a cardiac output of 5 L·min−1 correspond to 50% and 25% obstruction, respectively. Reproduced and modified from [45] with permission.
Clinical relevance
A refined definition of PVR by multipoint pulmonary vascular pressure–flow relationships may be useful to diagnose early pulmonary vascular disease and helps to understand the effects of interventions in clinically established PAH. Corrections for haematocrit are needed for anaemic or polycythaemic patients. Current definitions of PH at normal cardiac output correspond to pulmonary vascular remodelling with 25–50% of vascular obstruction.
Partitioning of PVR
The pressure decay curve after pulmonary artery balloon occlusion to measure PAWP presents with a fast portion, corresponding to an upstream arterial resistance, and a slow portion, corresponding to a downstream resistance which incorporates arterioles, capillaries and venules [46]. This is illustrated in figure 1. Upstream PVR increases in purely proximal CTEPH. Downstream PVR increases in PAH and pulmonary veno-occlusive disease (PVOD) [46].
The partitioning of PVR by arterial occlusion may identify patients with proximal CTEPH who are most likely to benefit from surgical or interventional des-obstruction [47–49]. The analysis is not helpful to differentiate PAH and PVOD, because of overlaps in pulmonary vascular remodelling [4, 50].
Clinical relevance
Single balloon occlusion pressure decay curves during a right heart catheterisation may reveal differences in the partitioning of PVR between proximal pulmonary arterial obstruction (proximal CTEPH) and distal arteriolar, capillary and or veinular obstruction (PAH, PVOD).
Pulmonary circulation: pulsatile-flow haemodynamics
Pulmonary vascular impedance
Hydraulic work, or “dynamic afterload”, of the RV is determined by an interaction between resistance, compliance and wave reflection [51]. These determinants of the opposition to pulmonary arterial flow can be quantified by a spectral analysis of PAP and flow waves [7, 52, 53]. The result is graphically represented as a pulmonary vascular impedance (PVZ) spectrum or PAP/flow (Q′) and phase angle as a function of frequency (figures 1 and and7).7). 0 Hz impedance (mPAP/Q′) is mainly determined by the small vessel resistance as well as by left atrial pressure. As frequency increases, impedance is affected by more proximal arterial resistance. A negative low-frequency phase angle shows that flow leads pressure. At high frequencies, the PAP/Q′ ratio is decreased and oscillates around a constant value called characteristic impedance (Zc). It is possible to calculate Zc in the time domain as the early systolic slope of PAP/Q′ [54]. Zc is a ratio of inertance to compliance, and thus measures proximal pulmonary artery stiffness.
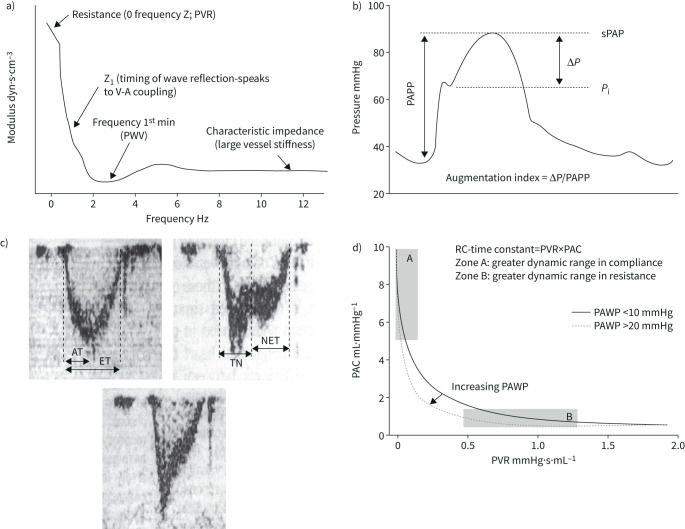
a) Pulmonary vascular impedance spectrum expressed as pulmonary artery pressure–flow ratio (“modulus”) as a function of frequency. For discussion of the relevant points, see indications on figure and comments in the text. b) Pulmonary artery pressure (PAP) curve in severe pulmonary hypertension showing an increased augmentation index, or gradient between systolic PAP (sPAP) and inflection of the upstroke pressure (Pi) divided by PA pulse pressure (PAPP). c) Doppler pulmonary artery flow waves in a normal subject (left panel) and in patients with severe PH (right and lower panels). Pulmonary hypertension was associated with a decreased acceleration time (AT) corrected for ejection time (ET) and mid-systolic deceleration of flow (notching) or late systolic deceleration of flow. TN: time to notching, NET: time from notching to end-ejection. d) Hyperbolic relationship between pulmonary artery compliance (PAC) and pulmonary vascular resistance (PVR) in patients with either a high or a normal pulmonary artery wedge pressure (PAWP). A high PAWP shifts the relationship to the left with decreased RC-time. Reproduced from [53], [64] and [77] with permissions.
Pulmonary vascular impedance determinations have been reported in a limited number of paediatric and adult patients with IPAH [55–58]. The general pattern has been that of an upwards shift of PVZ spectra, with the first minima and maxima of PAP-flow moduli shifted to higher frequencies, increased Zc and more negative low-frequency phase angle. Increased Zc was interestingly associated with RV–arterial uncoupling [57] and worse clinical outcome than predicted by PVR alone in paediatric pulmonary hypertension patients [58].
Clinical relevance
The measurement of PVZ in PAH allows for an assessment of RV afterload, but is limited by the complexity of frequency-domain analysis. The clinical relevance of determinants of PVZ other than Z0 and Zc remains an area of investigation.
Time-domain pulsatile haemodynamics
Severe pulmonary hypertension is characterised by increased pulmonary arterial pulse pressure (PP, or systolic PAP (sPAP) minus diastolic PAP (dPAP)), late systolic peaking of pressure and a short plateau in the upstroke of the pressure wave [53]. These aspects are determined by decreased pulmonary artery compliance (or stroke volume (SV) divided by PP) and delayed addition of the first reflected pressure wave [59]. Wave reflection can be quantified by the so-called augmentation index, or sPAP minus plateau pressure divided by PP initially proposed by Murgo et al. [60] for the systemic circulation. Pulmonary artery PP has been reported to be increased in proximal pulmonary artery obstruction like in CTEPH, as compared to distal small vessel obstruction like in PAH [61]. However, the discrimination between these two conditions based on PP or a Murgo index was not possible on an individual basis [62].
Pulmonary hypertension is also characterised by a late or mid-systolic deceleration of flow also called “notching” [63, 64] caused by earlier return of the first reflected flow wave [59]. Quantification of notching by measuring a “time to notching” from the onset of the flow wave to the moment of maximum mid-systolic deceleration has been proposed as an index of increased wave reflection, and thus of predominantly proximal CTEPH [65]. However, this approach has not gained acceptance, probably because of overlap with high-pressure PAH and common coexistence of distal small-vessel disease in CTEPH [66]. The presence of pulmonary artery flow notching is associated with a high likelihood of increased PVR [67].
Clinical relevance
There is interest in PAP and flow wave morphology analysis for the diagnostic work-up of pulmonary hypertension. High pulse pressure, late systolic peaking of pressure and mid-systolic deceleration of flow are indices of advanced pulmonary vascular disease and/or proximal pulmonary arterial obstruction. Proximal pulmonary artery stiffening increases Zc, which can be assessed in the time as well as in the frequency domain, and may be relevant to RV afterload.
The time constant of the pulmonary circulation
Pulmonary arterial compliance is mostly (>80%) distributed to the peripheral part of the arterial tree [68], in contrast to systemic arterial compliance, which is mostly (>80%) proximal, in the thoracic aorta [69]. While in the systemic circulation resistance and compliance are unrelated, the product of pulmonary arterial compliance and PVR, also called RC-time, remains constant, with a hyperbolic relationship that is maintained over a wide range of severities, aetiologies and treatments of pulmonary hypertension [68–73]. This property has two consequences. The first is that pulmonary arterial compliance becomes a more important determinant of RV afterload than PVR when PAP and PVR are only modestly elevated [73]. The second is that the oscillatory component of total hydraulic load (WTOT) of the pulmonary circulation is a constant fraction of ~23% [74] Accordingly, WTOT can be calculated from steady-flow hydraulic load (WST) or product of mPAP by SV:

The RC-time decreases in relation to pulmonary arterial proximal obstruction like in experimental pulmonary artery banding or in CTEPH [75, 76] or increased PAWP in patients with heart failure [77]. In these circumstances, pulmonary arterial compliance decreases out of proportion to increased PVR (figure 7), and therefore contributes proportionally more to RV afterload.
The RC-time is a small number exposed to amplification of errors on measurements of both pulmonary arterial compliance and PVR, so that it may vary considerably [78]. However, extreme reported changes in RC-time do not greatly affect the oscillatory component of total work [79].
It has been proposed that the stability of RC-time of the pulmonary circulation explains why sPAP, dPAP and mPAP are tightly correlated in normal subjects and in patients with pulmonary hypertension of all possible aetiologies and severities [80]. It has been repeatedly demonstrated that the sPAP/mPAP and mPAP/dPAP ratios are remarkably stable and actually match the golden ratio [81]. mPAP can be predicted from sPAP by the formula [82]:

The constant proportionality between sPAP and mPAP is useful in clinical practice, as sPAP is easily determined noninvasively from the maximum velocity of tricuspid regurgitation measured by Doppler echocardiography [83].
Clinical relevance
The tight hyperbolic relationship between pulmonary arterial compliance and PVR explains the relatively more important contribution of pulmonary arterial compliance to afterload in mild to moderate PAH, the stability of the prediction of mPAP from noninvasively estimated sPAP, and absent or limited impact of wave reflection on RV afterload load.
Right ventricular function
Ventriculo-arterial coupling
In spite of obvious embryological and structural differences, the mechanical properties of the right and left ventricles are similar [84]. The so-called “laws of the heart” apply to both equally [85]. The immediate ventricular adaptation to increased afterload is by increased dimensions following Starling's law of the heart. However, this “heterometric” response is in a few minutes replaced by a “homeometric” increased contractility following Anresp's law of the heart allowing for a preserved flow output without dilatation and increased filling pressures. Long-term homeometric adaptation is strengthened by ventricular hypertrophy. When the homeometric adaptation becomes exhausted, a heterometric adaptation is turned on again to preserve cardiac output, but at the price of ventricular dilatation and upstream congestion [6, 7, 85, 86].
These notions with analysis of left ventricular (LV) function by pressure–volume (PV) relationships were introduced by Suga et al. [87] in the 1970s. They have been revived along with increased interest into RV function as a main determinant of symptoms and outcome in PAH [6, 7, 53, 86].
The gold standard of the measurement of contractility in an intact ventricle is maximum or end-systolic elastance (Ees), or the ratio between end-systolic pressure (ESP) and end-systolic volume (ESV). A lumped afterload parameter can be defined by a ratio between ESP and SV.


Accordingly, the coupling of RV contractility to afterload can be assessed by the Ees/Ea ratio [6, 7, 53, 85, 86]. Mathematical modelling and experimental studies have established that the Ees/Ea ratio allowing for the ejection of a SV at minimal energy expenditure is optimally between 1.5 and 2.0 [85].
The left ventricular pressure–volume (PV) loop has a square shape with easily identifiable Ees at its upper left corner [87]. The normal RV PV loop has a rounded triangular shape with early systolic peaking of pressure, with Ees more difficult to discern (figure 5) [88]. Accurate definition of the RV Ees/Ea ratio requires a family of PV loops at several levels of pre-load decreased by a manipulation of systemic venous return [88], or a single-beat PV loop with analysis of the RV pressure curve [89]. The single-beat approach relies on an estimation of maximal pressure (Pmax) from a nonlinear extrapolation of the early and late isovolumic portions of the RV pressure curve. Maximal RV pressure corresponds to the pressure generated by a non-ejecting beat at end-diastolic volume (EDV) (figure 8).
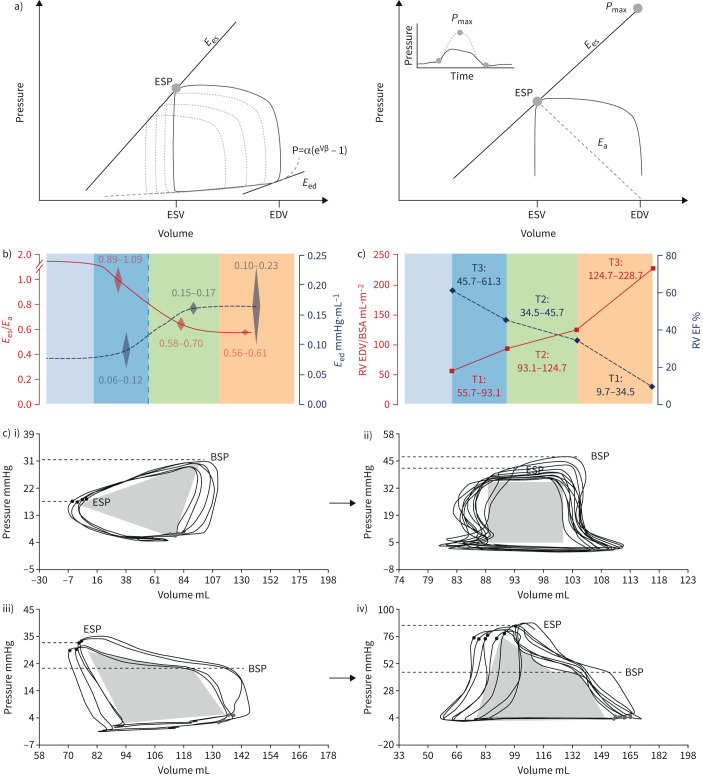
a) Multiple- and single-beat methods for calculating right ventricular (RV)–arterial coupling. In both methods, arterial elastance (Ea) is calculated from the ratio of end-systolic pressure (ESP) to stroke volume (SV). End-systolic elastance (Ees) as an approximation of maximum elastance is estimated by the ratio of ESP to end-systolic volume (ESV). In the multiple-beat method, Ees is defined by a tangent to a family of loops determined at decreasing venous return. In the single-beat method, a maximum pressure (Pmax) is estimated from the nonlinear extrapolation of the early systolic and diastolic portions of the RV pressure curve, and Ees defined by a straight line drawn from Pmax tangent to RV pressure to relative change in volume relationship. Diastolic stiffness (β) is calculated by fitting the nonlinear exponential, p=α (eVβ−1), to pressure and volume measured at the beginning and end of diastole. b) Evolution from normal to progressively more severe pulmonary arterial hypertension (PAH) (T1 to T3) of RV Ees/Ea, ejection fraction (EF) end-diastolic elastance (Eed) and RV end-diastolic volume (EDV) corrected for body surface area (BSA). The RV dilates with EDV above limits of normal when Ees/Ea and EF approximate 0.8 and 0.35, respectively. Increased Eed mirrors decreased Ees/Ea. c) RV pressure–volume loops from patients i) without pulmonary hypertension to iv) severe pulmonary hypertension, showing progressive change in shape with shift to late systolic peaking of pressure and “notching”, while ESP becomes higher than pressure at the onset of ejection (BSP). Reproduced from [86], [96] and [99] with permission.
The coupling of RV function to the pulmonary circulation by Ees and Ea measurements was first reported in six PAH patients in 2004 [90]. The study showed that Ees was approximately tripled compared to controls, but with a decreased Ees/Ea ratio indicating pending RV failure. These results have been confirmed in small cohorts of patients with either PAH or CTEPH [91–94]. In these studies, Ees/Ea was measured either by the single beat method [90, 92, 93] or on a family of PV loops at decreasing venous return [91, 94]. End-systolic elastance was constantly increased [90–94]. The Ees/Ea ratio was either maintained or decreased at rest [90–94], but constantly decreased during exercise [93, 94]. Decreased Ees/Ea on exercise was accompanied by an increase in EDV, corresponding to exercise-induced RV failure [94].
Measurements of the Ees/Ea ratio by single or multiple beat approaches produce on average the same results, but with individual variability [95]. The coupling of RV function to the hypertensive pulmonary circulation has reserve: RV dimensions increase when the Ees/Ea ratio is down to a critical value of 0.7–0.8, thus approximately half-normal [96] (figure 8). At similar severity of PH, the Ees/Ea is better preserved in female compared to male PAH patients [97]. The Ees/Ea ratio independently predicts outcome in PAH [95].
As illustrated in figure 8, the shape of RV PV loops changes with progression of pulmonary hypertension, from a triangular shape with early systolic peaking of pressure in subjects without PH, to trapezoid and triangular shapes with late systolic peaking of pressure and mid systolic dip of pressure (“notching”) [98, 99]. These morphological changes in RV PV loops have been shown to be of prognostic relevance [99].
Clinical relevance
Right ventricular function adaptation to increased afterload in PAH relies on increased contractility to match increased arterial elastance. RV–arterial coupling in PAH is decreased during exercise and either preserved or decreased at rest. RV–arterial uncoupling eventually results in RV dilatation, increased RV filling pressures and clinically manifest right heart failure. RV–arterial coupling is of prognostic relevance.
Simplified measurements of RV–arterial coupling at the bedside
Since the Ees/Ea ratio has pressure as a common term, it can be simplified to a ratio of volumes [100, 101]:


The cut-off value for the SV/EDV ratio below which RV dimensions increase above the upper limits of normal while preserving SV is theoretically 0.54 [102]. Since SV is equal to EDV − ESV, and thus

this corresponds to a RVEF of 35% [102]
Because the Ees/Ea ratio has built-in common volume terms, it can also be simplified to a ratio of pressures [101, 103]:


Based on these equations, RVEF can be derived from an RV pressure curve [104]:

Simplified measurements of RV–pulmonary artery coupling have limitations [105]. The volume method assumes Ees as a straight line crossing the origin, which is unrealistic, since ventricular end-systolic elastance curves are slightly curvilinear with a positive extrapolation to the volume axis defining an unstressed volume (V0) [106]. The pressure method requires the calculation of Pmax, for which several methods have been reported and which may not be equivalent [89, 93, 101, 104]. It has been proposed to replace ESP by the easier-to-measure mPAP during a right heart catheterisation [103]. However, mPAP underestimates ESP in proportion to increased PAP [107] following the equation:

The pressure-dependent discrepancy between mPAP and ESP is related to the changes in the shape of PV loops [98, 99] as shown in figure 8.
The best-validated simple imaging assessment of RV–pulmonary artery coupling in PAH is RVEF. Several studies have demonstrated that RVEF is an independent predictor of outcome in PAH, with a cut-off value of 35–40% down from normal values around of 60–70% [108–110]. A large-scale study has shown that RVEF <37%, 37–54% and >54% are significantly associated with high, intermediate and low risk of decreased survival in PAH [111]. A meta-analysis has estimated that any decrease in 1% of RVEF increases the risk of clinical deterioration at 2 years by 5% and the risk of death at 5 years by 2% (numbers rounded up) [112]. The fractional area change (FAC) or the ratio of the difference between end-diastolic and end-systolic areas to end-diastolic area of the RV assessed by two-dimensional echocardiography as a surrogate of RVEF has been shown to be predictive of outcome as well, also with a rigorously determined cut-off value of ~35% [113].
Reversing RV dimensions and increasing EF or FAC by targeted therapies restores PAH life expectancy to normal [114]. Reverse remodelling with improved EF or FAC is best achieved by a decrease in PVR by >40–50% [114–117]. Such a decrease in PVR requires the combination of at least two therapies targeting different pathways and may be more consistently achieved with parenteral prostacyclins [114–117].
Clinical relevance
Severe RV–arterial uncoupling in PAH is associated with RV dilatation, systemic congestion and shortened life expectancy. Right heart failure defined by increased RV dimensions occurs when EF or SV/ESV decrease to below 35% and 54% respectively, with variability dues to preserved or decreased stroke volume. Reverse remodelling of the RV improves the outcome of PAH, and is achieved with combined therapies to decrease PVR by at least 40–50%.
Diastolic function
Coupling of RV function to afterload has an inevitable diastolic component [6, 85, 86, 96, 101, 118, 119]. As illustrated in figure 8, diastolic function is described by a diastolic elastance curve, which can be determined by a family of pressure–volume loops at variable loading or by the fitting of end-systolic and end-diastolic pressure–volume relationships on a single PV loop [86]. The fitting consists of a nonlinear exponential curve through the origin and end-systolic and end-diastolic pressure–volume coordinates with the formula P=α (eVβ−1), where α is a curve fitting constant and β a diastolic stiffness constant [86].
There are data, but from a limited number of patients, suggesting that the diastolic stiffness constant β independently predicts of outcome in PAH [118, 119]. This will require confirmation. The biology of diastolic adaptation to afterload in PAH is being explored [118]. Diastolic stiffness simply quantified by a simple end-diastolic pressure–volume coordinate retains the prediction capability of more complex β calculation [119]. Both systolic and diastolic stiffness increase in PAH and decrease along with decreased RV volumes when PVR decreases sufficiently by the effect of targeted therapies [120].
Clinical relevance
RV diastolic and systolic elastances are both increased in PAH. The biology of diastolic dysfunction and its prognostic relevance in PAH are being explored.
Ventricular interactions
RV function has to be understood in the context of its direct and indirect interactions with LV function [84, 121]. A negative diastolic ventricular interaction (i.e. altered diastolic function of one ventricle by changed diastolic function of the other) occurs in PAH because of ventricular competition for space. This alters LV filling and may eventually be associated with a depression of LV systolic function, atrophic remodelling of the LV and impairment of cardiac output [121]. A negative systolic ventricular interaction may add to the effects of diastolic interaction as a consequence of decreased LV contractility [121]. It has been shown experimentally that aortic constriction to enhance LV contraction by homeometric adaptation, markedly improves RV function in animals with pulmonary arterial banding [122]. In intact experimental animal hearts, 20–40% of RV systolic pressure results from LV contraction and 4–10% of LV systolic pressure results from RV contraction [123].
Systolic ventricular interaction is essentially explained by a direct mechanical entrainment effect, as both ventricles have the septum in common and are furthermore encircled by common fibres [84, 121]. An added factor is decreased coronary perfusion pressure in case of systemic hypotension, which may render the RV relatively ischaemic with ensuing uncoupling from the pulmonary circulation, but with increased sensitivity to LV contraction [124]. Increased RV filling pressures and excessive decrease in blood pressure combine to cause RV ischaemia and decreased contractility [125].
Ventricular interactions play an important role in acute right heart failure, like in pulmonary embolism, or right heart failure in end-stage PAH. Correcting negative diastolic and systolic ventricular interactions is an essential part of treatment in these patients as they are hospitalised in critical-care settings [126].
An additional cause of negative ventricular interaction disclosed by imaging studies is regional and interventricular asynchrony with post-systolic contraction or “shortening”, which has been shown to develop in parallel to increased pulmonary artery pressures and contributes to altered RV systolic function and LV underfilling [127]. Right ventricular regional asynchrony (loss of interventricular synchrony of contraction) and dyssynchrony (loss of regional intraventricular synchrony of contraction) can now be identified and quantified by speckle tracking echocardiography [128, 129]. Dyssynchrony of RV contraction may already be present in early-stage or borderline PH [129]. Dyssynchrony of RV contraction in advanced PAH is associated with worse functional state and decreased survival [128].
Clinical relevance
Negative diastolic and systolic interactions are major determinants of RV–arterial coupling in right heart failure. Loss of intra- and interventricular synchrony of contraction contribute to altered RV–arterial coupling and are associated with a shortened survival rate.
Stressing the right ventricle
Stressing the RV to measure its “contractile reserve” may disclose borderline or latent functional uncoupling from the pulmonary circulation [95].
Exercise-induced increase in systolic RV pressure estimated from the maximum velocity of tricuspid regurgitation by Doppler echocardiography has been shown to be a strong predictor of survival in patients with PAH or CTEPH [130]. However, a single estimate of pressure does not adequately describe RV–pulmonary artery coupling [94]. Another approach is to assess exercise-induced increase in cardiac output [131]. Since the Ees/Ea ratio and EF are related, and are either maintained or increased during exercise [93, 94, 132], exercise-stress EF should be a valid challenge to detect early or pending RV failure. This approach was historically implemented using radionuclide angiography to identify RV dysfunction in COPD [133]. However, magnetic resonance imaging measurements of RV volumes during exercise are technically challenging and not generally available.
The possibility to replace the stress of exercise by low-dose dobutamine and measure the RV contractile response by a tricuspid annular plane systolic excursion (TAPSE) or tricuspid annulus S wave, is being considered [134]. There is experimental work showing that dobutamine-induced increase in these indices of RV systolic function reflects the resting state of RV–arterial coupling [135].
A measure of maximal oxygen uptake (V′O2max) can be considered as an indirect RV stress test as the main determinant of aerobic capacity in PAH is maximum cardiac output as determined by RV–PA coupling [134]. However, V′O2max in PAH, like in heart failure, is also influenced by extracardiac factors including neurohumoral changes and matching of muscle convectional and diffusional oxygen transport mechanisms [15].
Clinical relevance
Dynamic testing of the RV to assess its contractile reserve might disclose latent or borderline uncoupling of the RV from the pulmonary circulation. The optimal method to stress the RV has not yet been determined.
Perspective
Since RV function is the major determinant of symptoms and outcome in PAH, simple noninvasive methods for its evaluation are being developed. One of those is the ratio of TAPSE (to estimate Ees) to sPAP (to estimate afterload), which are easily measured during a standard Doppler echocardiography [136]. The TAPSE/sPAP ratio has been validated against invasive measurements of the Ees/Ea ratio [137, 138] and shown to be of prognostic relevance in heart failure [136, 137] and in PAH [139].
However, the physiological basis of PAH goes beyond RV dysfunction. Management of PAH patients requires a thorough understanding of the basic physiology of lung mechanics, pulmonary gas exchange, pulmonary vascular function and the coupling of the right heart to the pulmonary circulation. This knowledge is essential not only for the correct evaluation of therapeutic interventions, but also for the assessment of the clinical relevance of the rapidly growing understanding of the cellular and molecular biology of this disease.
Shareable PDF
Footnotes
Conflicts of interest: R. Naeije reports relationships including consultancies, speaker fees and membership of advisory boards with AOP Orphan Pharmaceuticals, Johnson & Johnson, Lung Biotechnology Corporation and United Therapeutics.
Conflicts of interest: M.J. Richter has received funding from the German Research Foundation (DFG, 413584448) and from the Collaborative Research Center (SFB) 1213 – Pulmonary Hypertension and Cor Pulmonale (grant number SFB1213/1, project B08; German Research Foundation, Bonn, Germany).
Conflicts of interest: L.J. Rubin reports consultancies with Actelion, SoniVie, Gossamer Bio and Bellerophon.
Support statement: M.J. Richter received funding from the JLU-CAREER programme (German Research Foundation, DFG, 413584448) and from the Collaborative Research Center (SFB) 1213 – Pulmonary Hypertension and Cor Pulmonale, grant number SFB1213/1, project B08 (German Research Foundation, Bonn, Germany).
References
Full text links
Read article at publisher's site: https://doi.org/10.1183/13993003.02334-2021
Read article for free, from open access legal sources, via Unpaywall:
https://erj.ersjournals.com/content/erj/59/6/2102334.full.pdf
Citations & impact
Impact metrics
Citations of article over time
Alternative metrics

Discover the attention surrounding your research
https://www.altmetric.com/details/129816763
Article citations
A comparative study of femoral artery and combined femoral and axillary artery cannulation in veno-arterial extracorporeal membrane oxygenation patients.
Front Cardiovasc Med, 11:1388577, 18 Sep 2024
Cited by: 0 articles | PMID: 39359639 | PMCID: PMC11445077
Identification and experimental verification of senescence-related gene signatures and molecular subtypes in idiopathic pulmonary arterial hypertension.
Sci Rep, 14(1):22157, 27 Sep 2024
Cited by: 0 articles | PMID: 39333589 | PMCID: PMC11437103
Pathophysiology of the right ventricle and its pulmonary vascular interaction.
Eur Respir J, 64(4):2401321, 31 Oct 2024
Cited by: 0 articles | PMID: 39209482 | PMCID: PMC11525331
Review Free full text in Europe PMC
Is pulmonary vascular remodeling an intermediate link between hyperglycemia and adverse outcomes in patients with idiopathic pulmonary arterial hypertension? Insights from a multi-center cohort study.
Cardiovasc Diabetol, 23(1):384, 28 Oct 2024
Cited by: 0 articles | PMID: 39468502 | PMCID: PMC11520901
Mechanisms and treatment of pulmonary arterial hypertension.
Nat Rev Cardiol, 07 Aug 2024
Cited by: 1 article | PMID: 39112561
Review
Go to all (48) article citations
Similar Articles
To arrive at the top five similar articles we use a word-weighted algorithm to compare words from the Title and Abstract of each citation.
Arterial load and right ventricular-vascular coupling in pulmonary hypertension.
J Appl Physiol (1985), 131(1):424-433, 27 May 2021
Cited by: 10 articles | PMID: 34043473 | PMCID: PMC8325619
Exercise cardiac MRI unmasks right ventricular dysfunction in acute hypoxia and chronic pulmonary arterial hypertension.
Am J Physiol Heart Circ Physiol, 315(4):H950-H957, 18 May 2018
Cited by: 15 articles | PMID: 29775415 | PMCID: PMC6230906
Sleep-Related Hypoxia, Right Ventricular Dysfunction, and Survival in Patients With Group 1 Pulmonary Arterial Hypertension.
J Am Coll Cardiol, 82(21):1989-2005, 01 Nov 2023
Cited by: 2 articles | PMID: 37968017
Right heart adaptation to pulmonary arterial hypertension: physiology and pathobiology.
J Am Coll Cardiol, 62(25 suppl):D22-33, 01 Dec 2013
Cited by: 478 articles | PMID: 24355638
Review

 1
1 


