Abstract
Free full text

Optimization of Higher-Energy Collisional Dissociation Fragmentation Energy for Intact Protein-level Tandem Mass Tag Labeling
Abstract
Isobaric chemical tag labeling (e.g., iTRAQ and TMT) is a commonly used approach in quantitative proteomics and quantification is enabled through detection of low-mass reporter ions generated after MS2 fragmentation. Recently, we have introduced and optimized a platform for intact protein-level TMT labeling that demonstrated >90% labeling efficiency in complex samples with top-down proteomics. Higher-energy collisional dissociation (HCD) is commonly utilized for isobaric tag labeled-peptides fragmentation because it produces accurate reporter ion intensities and avoids loss of low mass ions. HCD energies have been optimized for isobaric tag labeled-peptides but have not been systematically evaluated for isobaric tag-labeled intact proteins. In this study, we report a systematic evaluation of normalized HCD fragmentation energies (NCEs) on TMT-labeled HeLa cell lysate using top-down proteomics. Our results suggested that reporter ions often result in higher ion intensities at higher NCEs. Optimal fragmentation of intact proteins for identification, however, required relatively lower NCE. We further demonstrated that a stepped NCE scheme with energies from 30 to 50% resulted in optimal quantification and identification of TMT-labeled HeLa proteins. These parameters resulted in an average reporter ion intensity of ~4E4 and average PrSMs of >1000 per RPLC-MS/MS run with a 1% false discovery rate (FDR) cutoff.
INTRODUCTION
Top-down mass spectrometry (MS)-based proteomics analyzes intact proteins in complex samples, allowing for the characterization of intact proteoforms arising from genetic variation, alternative RNA splicing, and post-translational modifications (PTMs).1–3 Quantitative top-down proteomics enables measurement of variation in proteoform-level expression resulting from different biological conditions to better understand protein function, cellular mechanism, disease state, and to aid in biomarker discovery.1,4 Isobaric chemical tag labeling, such as isobaric tag for relative and absolute quantitation (iTRAQ)5, tandem mass tag (TMT)6,7, and N, N-dimethylleucine (DiLeu)8–10 has become one of the most popular approaches in quantitative bottom-up proteomics.11,12 These isobaric chemical tags may be used to quantify multiple samples (e.g., up to 18 samples with TMTpro 18-plex and 21 samples using 21-plex DiLeu9) in a single run allowing for simultaneous quantification and identification at the MS2 level. Isobaric chemical tag-based quantification has been extended to top-down proteomics for the analysis of standard proteins or simple protein mixtures13–16 but has remained limited with respect to complex samples due to the presence of protein precipitation and side products during the labeling.17,18 To overcome these challenges, our group recently developed and optimized an intact protein-level TMT labeling platform for the quantification of low molecular weight proteoforms (<35 kDa).17 Moreover, a systematic evaluation of protein labeling conditions was performed using top-down proteomics and >90% labeling efficiency was achieved in complex samples.17,18 Konrad et al. also applied thiol-directed isobaric labeling (e.g., cysteine labeling) for the quantification of E. coli and combined E. coli/yeast cell lysate using top-down proteomics.19
Protein quantification using isobaric chemical tag-based labeling relies on the efficient and accurate measurement of low-mass reporter ions generated in MS2 fragmentation; therefore, the selection and optimization of fragmentation techniques is essential to generate reporter ions and protein fragment ions simultaneously. Higher-energy collisional dissociation (HCD) fragments ions in a collision cell instead of an ion trap and operates at higher collisional energies than collision-induced dissociation (CID)20. HCD has been commonly utilized for isobaric-based quantification because HCD fragmentation resulted in high quality MS2 spectra by providing high resolution ion detection, no low-mass cutoff, and high intensity low-mass reporter ions that improve the accuracy and precision of isobaric-based quantification (e.g., iTRAQ and TMT).21,22
It has been reported that quantification precision and accuracy decreased for isobaric tag-labeled precursors if reporter ion signals are low due to low HCD fragmentation energy; however, over-fragmentation issues due to high HCD fragmentation energy can result in less confident identification.23 Therefore, a fine tuning of the collision energy for MS2 fragmentation is required for a balance between confident identification and highly sensitive and accurate quantification. Some groups have studied the influence of fragmentation energy on the reporter ion intensity for isobaric tag-labeled peptides, achieving a compromise between peptide identification and quantification.23–28 A normalized collision energy (NCE) of 40–45% is used in many laboratories for routine analysis of TMT-labeled peptides.26,29–31 There have also been reports for evaluation of MS2 fragmentation on isobaric tag-labeled intact protein using solutions of standard protein. Chien-Wen et al. evaluated reporter ion intensities from intact TMT-labeled myoglobin using different HCD energies and found that reporter ion signals increased as NCE increased and reached a maximum at 30% NCE using a LTQ-Orbitrap Velos mass spectrometer.16 Konrad and coworkers recently applied a combined fragmentation scheme for iodoTMTzero-labeled lysozyme (e.g., cysteine labeling) using an Orbitrap Fusion Lumos Tribrid mass spectrometer. This study found that different fragmentation energies were required for efficient backbone fragmentation and cleavage of reporter ions.19 Thus, they utilized a sequential scan approach with 80% HCD used for reporter ion quantification and electron-transfer dissociation (ETD) fragmentation or collision induced dissociation (CID) for intact protein fragmentation. To date, no systematic evaluation of HCD fragmentation energy on TMT-labeled intact proteins in complex sample such as cell lysate has been reported.
In this study, we systematically evaluated the effect of HCD normalized energy on fragmentation efficiency and reporter ion intensities of TMTzero-labeled HeLa cell lysate using an Orbitrap Exploris 240 mass spectrometer. Our results indicated that reporter ion intensities increased with increasing NCE, which provided improved quantification sensitivity and accuracy; however, high NCE (e.g., 50% or higher) often introduced over-fragmentation of intact proteoforms, resulting in poor identification confidence. Based on these observations, we proposed a stepped HCD strategy with three normalized HCD energies from 30 to 50%. With the optimized HCD strategy, we confidently identified >1000 PrSMs with an average reporter ion intensity of ~4E4 in TMT-labeled intact proteins from HeLa cell lysate with a single LC-MS/MS run.
EXPERIMENTAL
Chemicals and materials.
Tris (2-carboxyethyl) phosphine hydrochloride (TCEP), Pierce™ BCA Protein Assay Kit, molecular weight cutoff filters (10K and 100K MWCO), and TMT isobaric label reagents (both TMTzero and TMT10plex) were obtained from Thermo Fisher (Waltham, MA, USA). LC-MS grade acetonitrile (ACN), isopropanol (IPA), trifluoroacetic acid (TFA), water used for LC mobile phases, and other chemicals were purchased from Sigma-Aldrich (St. Louis, MO, USA) unless noted otherwise.
HeLa cell lysate preparation.
HeLa cells were grown in Dulbecco’s modified Eagle medium (DMEM), with 10% fetal bovine serum (FBS) and 2% penicillin-streptomycin under 5% CO2 at 37 °C until 80–90% density was achieved. Then HeLa cells were collected and cell lysate were prepared as previously reported.32 Protein concentration was measured by Pierce™ BCA Protein Assay Kit (Thermo Fisher). HeLa cell lysate was aliquoted and stored at −80 °C.
Protein-level TMT labeling.
Optimized protein-level TMT labeling protocol was reported here.18,33 Briefly, low molecular weight (<100 kDa) HeLa cell lysate proteins were enriched using 100 kDa MWCO spin filters and concentrated using 10 kDa MWCO spin filters. Low M.W. HeLa proteins were denatured by urea, reduced by TCEP, alkylated by IAA, buffer-exchanged to 100 mM TEAB buffer (pH 8.5), and concentrated to > 1 μg/μL using 10 kDa MWCO spin filters. TMTzero reagent was then added to the protein solution with a mass ratio of 8:1 (TMT-to-protein) and incubated for 1 hour at room temperature. Then, the same amount of TMTzero reagent was added for double labeling at room temperature for an additional hour, followed by quenching by hydroxylamine to a final concentration of 1.2% for 15 min. The TMT-labeled HeLa lysate was centrifuged at 12,000 × g and 4 °C for 30 minutes to remove any precipitation before LC-MS/MS analysis. Moreover, three aliquots of HeLa cell lysate proteins were individually labeled with TMT10plex tags (129C, 130C, 131) using the same conditions to evaluate the quantification. These TMT-labeled HeLa samples were then mixed with a mass ratio of 1:4:2 (129C:130C:131), centrifuged at 12, 000 × g and 4 °C for 30 minutes, and analyzed by nano-RPLC-MS/MS.
Top-down RPLC-MS/MS analysis.
All RPLC separations were performed on a modified Thermo Scientific (Waltham, MA, USA.) Accela LC system.17,34–36 Mobile phase A (MPA) consisted of 0.01% TFA, 0.585% acetic acid, 2.5% isopropanol, and 5% acetonitrile in water. Mobile phase B (MPB) consisted of 0.01% TFA, 0.585% acetic acid, 45% isopropanol, and 45% acetonitrile in water. 5 μg of TMT-labeled HeLa lysate was loaded onto a trapping column (150 μm i.d., 5 cm length, Jupiter particles, 5 μm diameter, 300 Å pore size), and then separated by a C2 capillary from CoAnn Technologies (100 μm i.d., 30 cm length, 3 μm diameter, 300 Å pore size) with a flow rate of 400 nL/min. The LC eluent was analyzed using an Orbitrap Exploris 240 mass spectrometer (Thermo Fisher Scientific, Bremen, Germany) equipped with a customized nano-ESI interface.14 A 60-min gradient from 10% to 70% of MPB was applied. MS parameters were set as follows: inlet capillary temperature was 275 °C; spray voltage was 3.0 kV; resolution for MS1 and MS2 was set to 120, 000 and 60, 000, respectively; AGC target was 1×10⁶ with 2 microscans for both MS1 and MS2 scans. Maximum injection time was 500 ms for MS1 and 300 ms for MS2 scans; the isolation window was set as 2 m/z. Dynamic exclusion was 90 s; top 6 most abundant precursor ion peaks (charge 4–50) in MS1 scans were selected for MS2 fragmentation. Normalized HCD energy was varied for MS2 fragmentation: single energies of 25%, 30%, 35%, 40%, 45%, 50% and 80%; stepped energies of 30/40/50% and 35/45/50%. TMT-labeled HeLa lysate was analyzed in triplicate for each selected energy scheme.
Data analysis.
An in-house python package (https://github.com/OUWuLab/Yanting_TMT-extraction.git) was utilized to extract reporter ion peaks. TopPIC Suite was used for proteoform search against human protein database (UniProt, 2020–07-11, 20368 species).37,38 Decoy database searching was used and the FDR cutoff was set as 0.01 for both spectrum and proteoform levels. The maximum number of mass shifts was 2 with TMTzero or TMT10plex at both N-terminal and lysine residues as the fixed modification. All the other parameters were set as default. MASH Suite39 and ProSight Lite40 were used for manual interpretation and spectrum presentation.
RESULTS AND DISCUSSION
The fragmentation energy used for multistage fragmentation has an important impact on the quality of fragmentation spectra. In top-down MS, isobaric chemical tag-based quantification normally requires higher fragmentation energy to produce intense reporter ion peaks for accurate and sensitive quantification.26 However, high fragmentation energy may also introduce over-fragmentation of intact proteoforms, resulting in low-quality MS2 spectra that do not result in confident proteoform identification.28 This is especially true for low abundance isobaric tag-labeled species in complex samples. Therefore, a balanced fragmentation energy is required to obtain both confident proteoform identification and highly sensitive and accurate quantification. Here, we systematically evaluated different normalized HCD energies for optimal proteoform identification and reporter ion intensity using an Orbitrap Exploris 240 mass spectrometer for TMT-labeled intact proteoforms in HeLa cell lysate.
Evaluation of normalized HCD energy for optimal reporter ion intensities
An in-house python package was developed to extract TMTzero reporter ion peaks from mzML files (converted from RAW using MSConvert41). The reporter ion intensities from all MS2 scans collected using various normalized HCD energies (NCEs) were plotted using a box plot, not including the scans that reporter ions were not detected, as shown in Figure 1A. As HCD fragmentation energy increased (25–80%), average reporter ion intensity increased from 4.6E3 at NCE=25% to 1.8E5 at NCE=80% (~38-fold increase). We also plotted the reporter ion intensities for all proteoform spectrum matches (PrSMs) (i.e., identified MS242 spectra, not including the scans that reporter ions were not detected) with different HCD energies in Figure 1B. The overall trend was consistent with Figure 1A, but there was less variation observed in HCD 45–80% after matching to PrSMs. In addition, the percentage of PrSMs without reporter ion detected in each NCE scheme was also evaluated. As shown in Figure 1C, the percentage of PrSMs without reporter ion detected decreased as NCE increased from 25% to 80% as expected. 47.84±5.20% PrSMs did not have reporter ions detected at NCE = 25%, while it decreased to 0% at NCE = 80% and close to 0% (0.47±0.20%) at NCE = 50%. In summary, our results suggested that higher HCD energies generally produced higher reporter ion intensities, which can be beneficial for TMT quantification.28
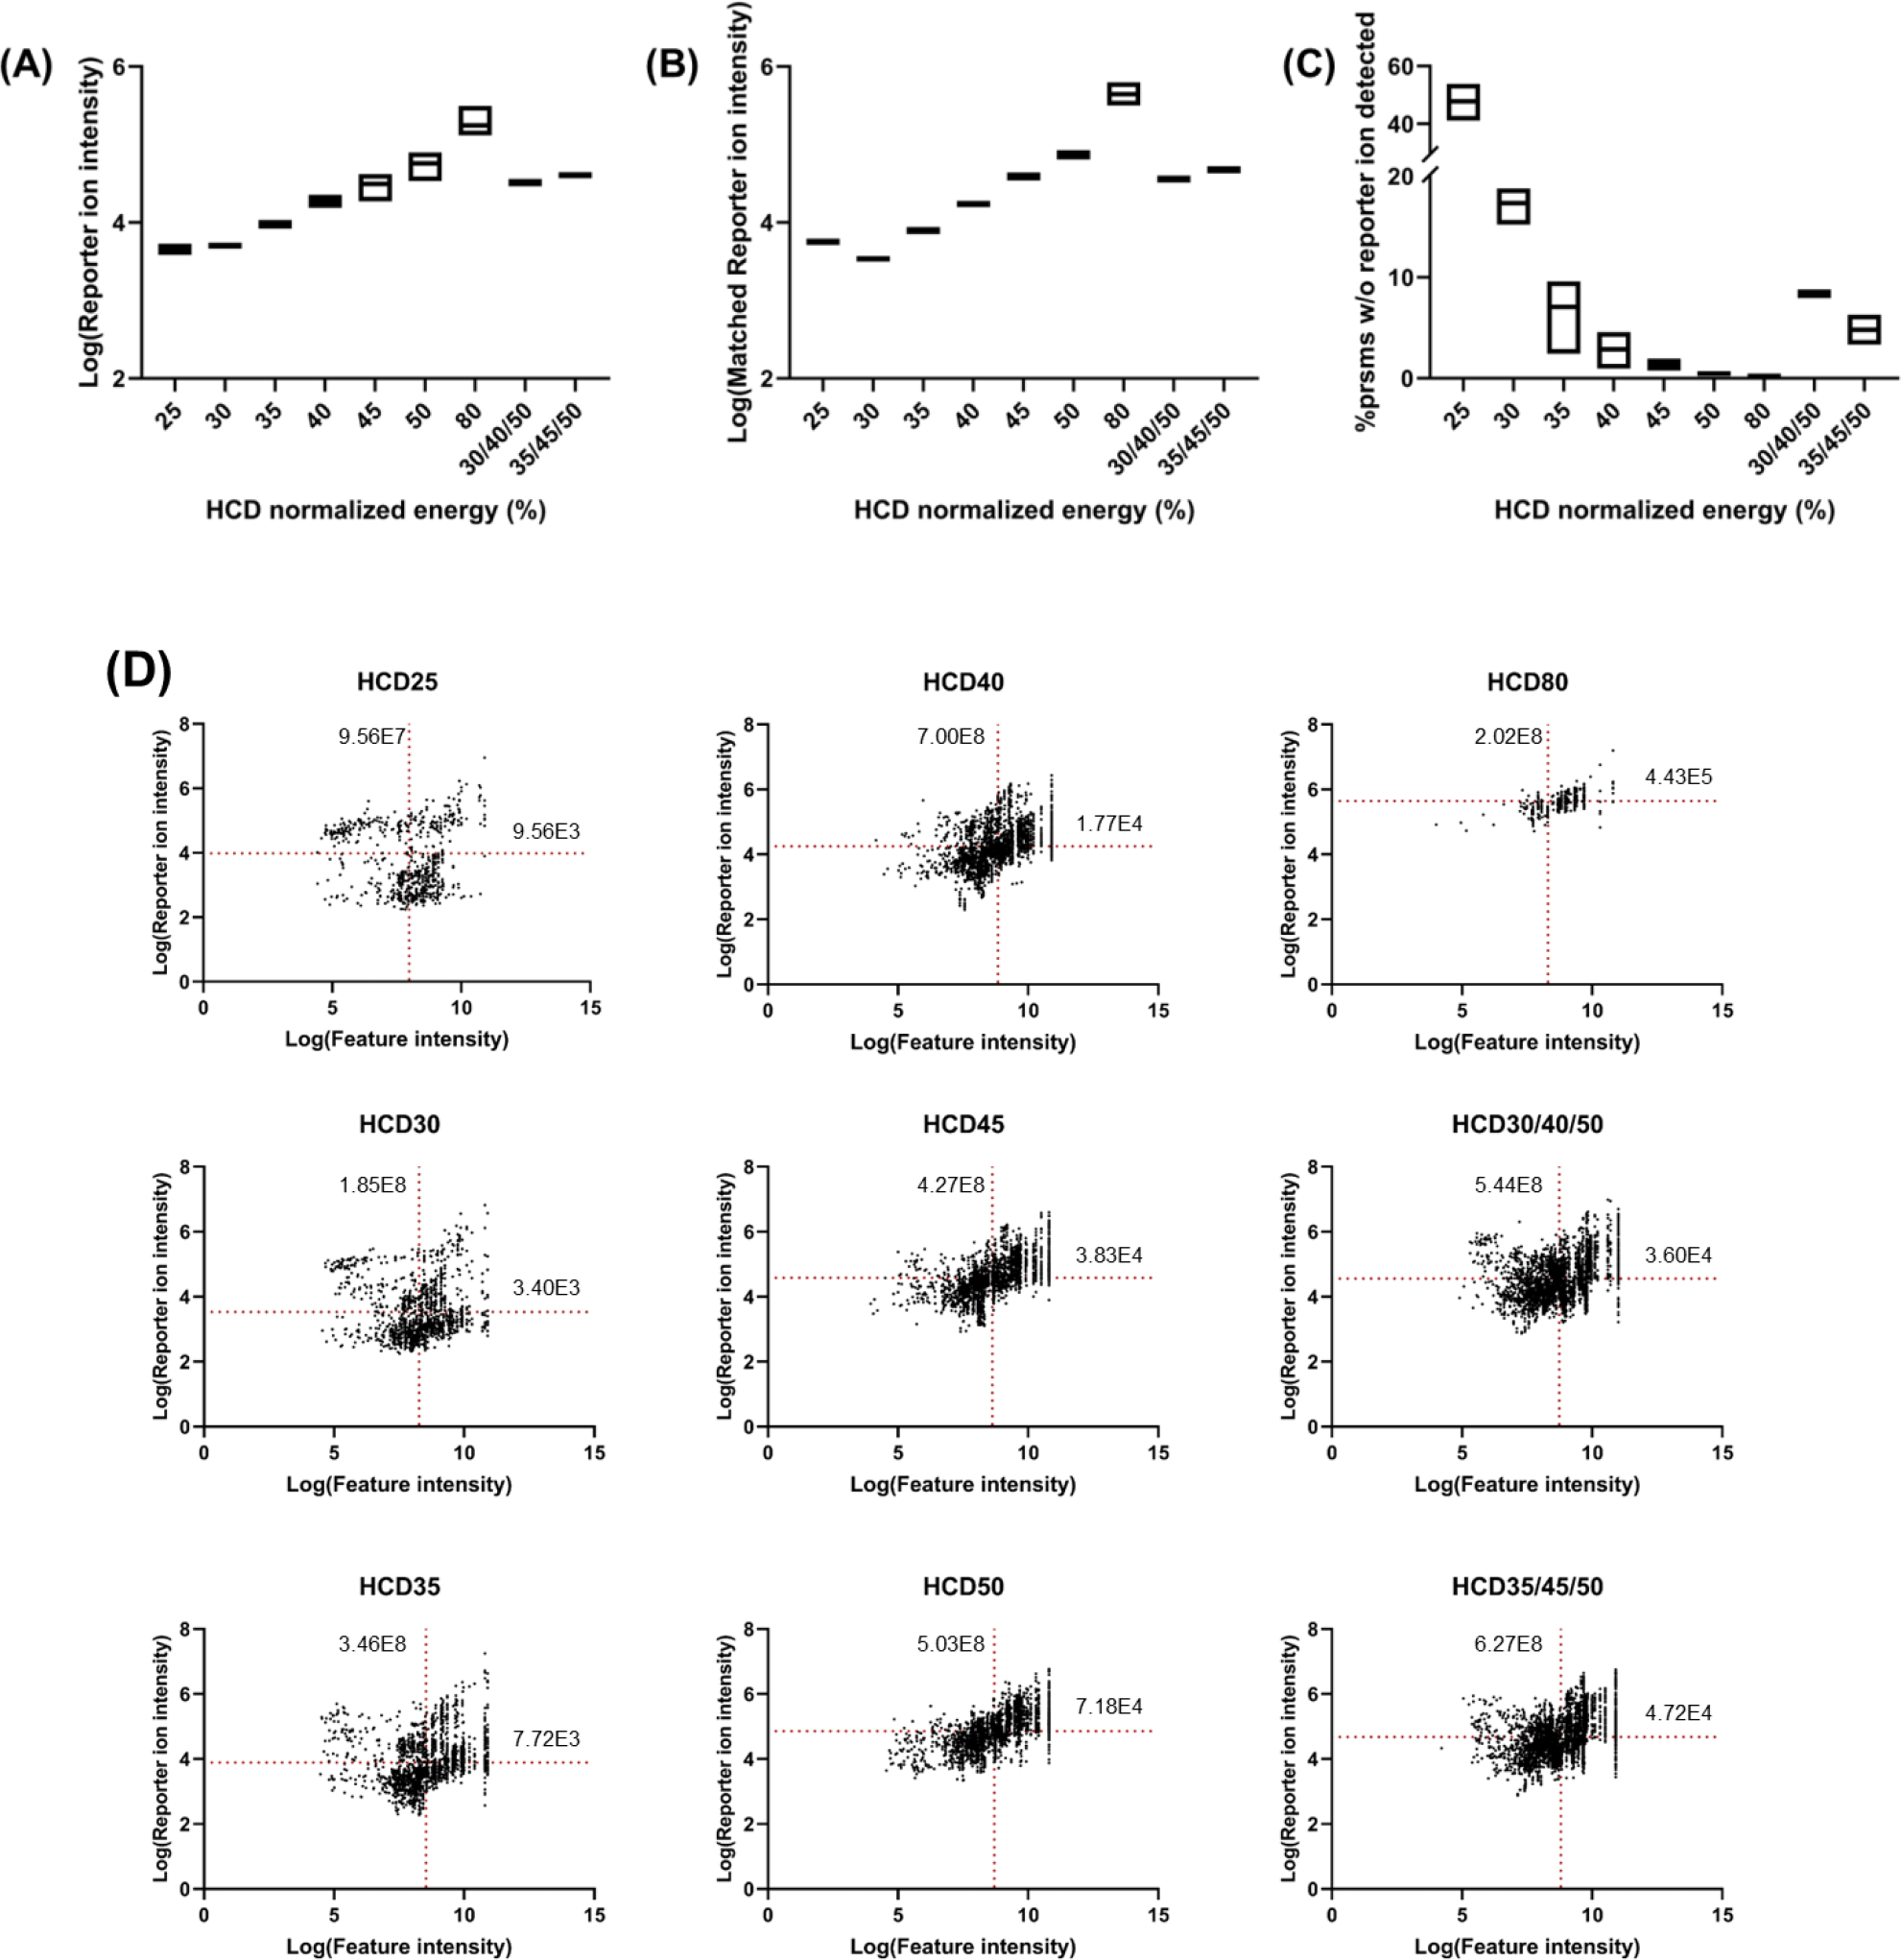
Box plot representation of (A) average reporter ion intensities for all MS2 scans (excluding scans with no reporter ions detected); (B) average reporter ion intensities for all PrSMs (excluding scans with no reporter ions detected); (C) percentage of PrSMs with no reporter ions detected; (D) scatter plots of precursor ion intensities versus reporter ion intensities in PrSMs (excluding scans with no reporter ions detected). The red dotted lines represent the mean values of log(reporter ion intensity) and log(feature intensity) for different NCEs. The intact parathymosin proteoform (Uniprot# P20962, Figure 2) demonstrated how the reporter ion intensity changed across different HCD energies. The observed monoisotopic mass was 14348.13 Da with 3.62 ppm difference to the theoretical monoisotopic mass of 14348.19 Da. As shown in Figure 2, for parathymosin with charge state = 15, no reporter ion was detected at NCE = 25% and the precursor ion peak (957.03 m/z, z = 15) was still the most abundant peak in MS2 spectra. The reporter ion intensities increased from 8.80E2 at NCE = 30% to 2.95E5 at NCE = 80%, suggesting a ~335-fold improvement. However, as mentioned above, when the normalized HCD energy is too high (e.g., NCE = 80%), over-fragmentation may be observed, which can be seen from the poor MS2 spectra quality at NCE = 80% where very few identifiable peaks were observed. In fact, when the NCE = 50%, we observed fewer fragment peaks, particularly for large MW fragment ions. Overall, higher normalized HCD fragmentation energy generated higher reporter ion intensities, which can be beneficial for improved accuracy and sensitivity of the quantification. However, high normalized HCD fragmentation energy may also lead to over-fragmentation, resulting in poor sequence coverage and identification. Therefore, for balanced identification and quantification, the effect of normalized HCD fragmentation energies on intact proteoform identification should also be evaluated.
The relationship between precursor intensity and reporter ion intensity in PrSMs was also explored by the scatter plots in Figure 1D, not including the scans that reporter ions were not detected. A slight trend was observed that indicated precursor intensity was proportional to reporter ion intensity. Overall, higher HCD energies produced reporter ions with higher intensities for mass features with similar intensities. For example, for features with intensities from 7.9E7 to1.3E8 (log value 7.9–8.1), average reporter ion intensities varied from 1.33E3 to 2.63E5 as NCE increased from 20% to 80% (~200-fold increase). However, even though 80% NCE generated the highest average reporter ion intensities (~2.63E5), a very small number of PrSMs were found. This is likely due to over-fragmentation of proteoforms caused by high fragmentation energy resulting in fewer identifiable terminal fragment ions. On the other hand, we noticed some PrSMs with relatively high reporter ion intensities at low NCEs (e.g., NCE <35%). Notably, most of these PrSMs are proteoforms with low MW (< 5 kDa) that are less likely to be identified using higher NCEs due to over-fragmentation (example in Figure 7).
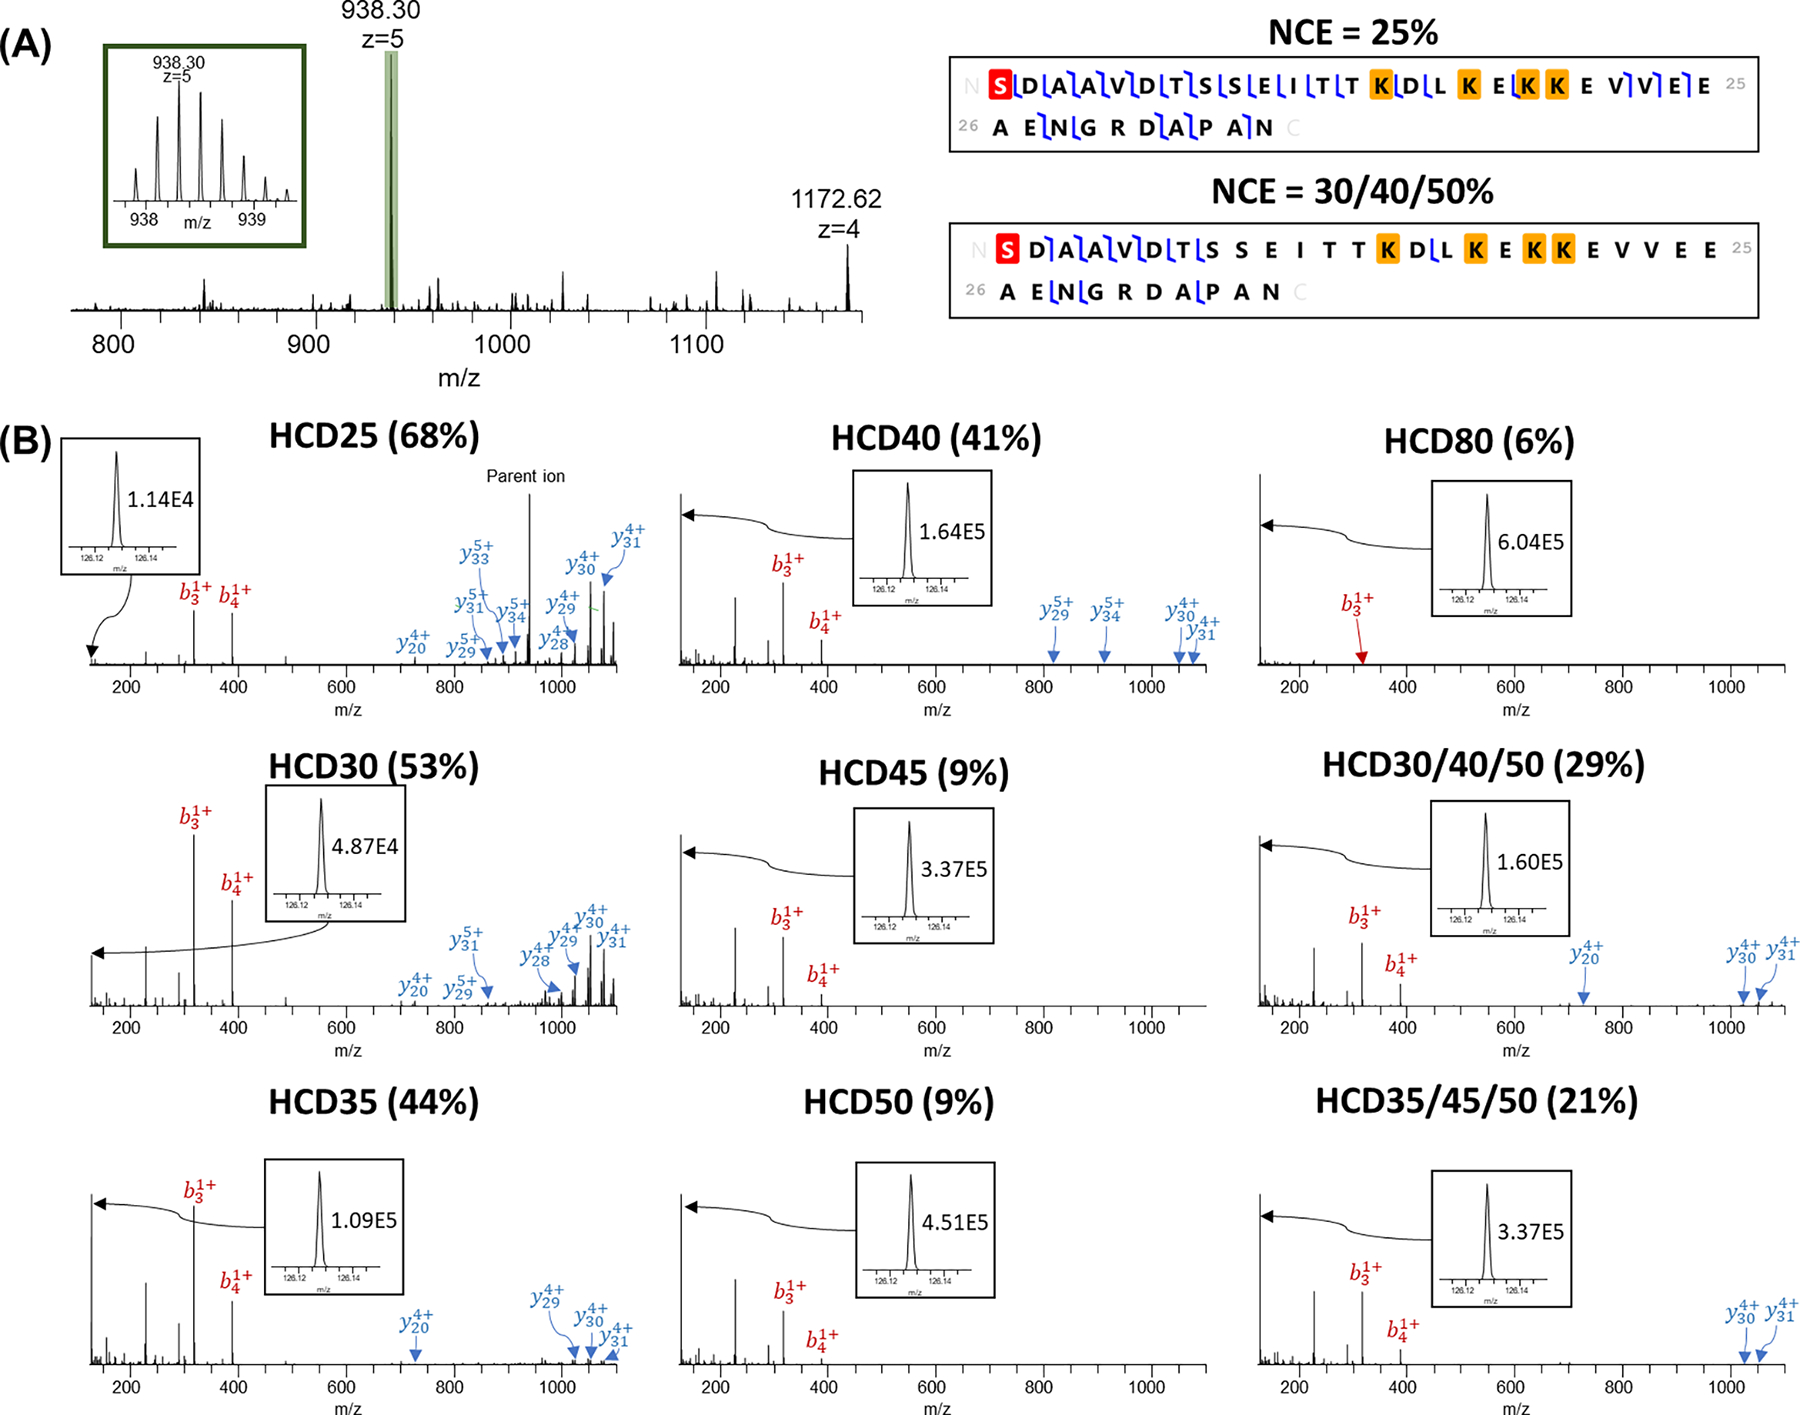
HCD analysis of Prothymosin alpha (PTMA, Uniprot#P06454) with different NCEs. (A) MS spectrum and representative fragmentation map using NCE = 25% and SNCE = 30/40/50%. Red highlight represents acetylation and yellow highlights represent TMT tags; (B) MS/MS spectra for +5 charge state precursor ions using single NCEs and SNCE schemes. Reporter ion peaks and the intensities are shown in the inset.
Evaluation of the effect of normalized HCD fragmentation energy on intact proteoform identification
To determine the optimal normalized HCD energy for proteoform identification, the number of PrSMs matched and unique proteoforms identified using each energy by TopPIC Suite were evaluated.38 As shown in Figure 3A, the number of PrSMs increased as NCE increased from 25–40% and remained approximately constant for NCE = 40–50% with approximately 800 PrSMs. However, PrSMs dramatically decreased to ~100 when NCE was increased to 80%. Figure 3B similarly demonstrated that for NCE <50% the number of unique proteoforms that were identified had a similar trend to the PrSMs and again the number of unique proteoforms identified with NCE = 80% decreased (~20 proteoforms) due to over-fragmentation.
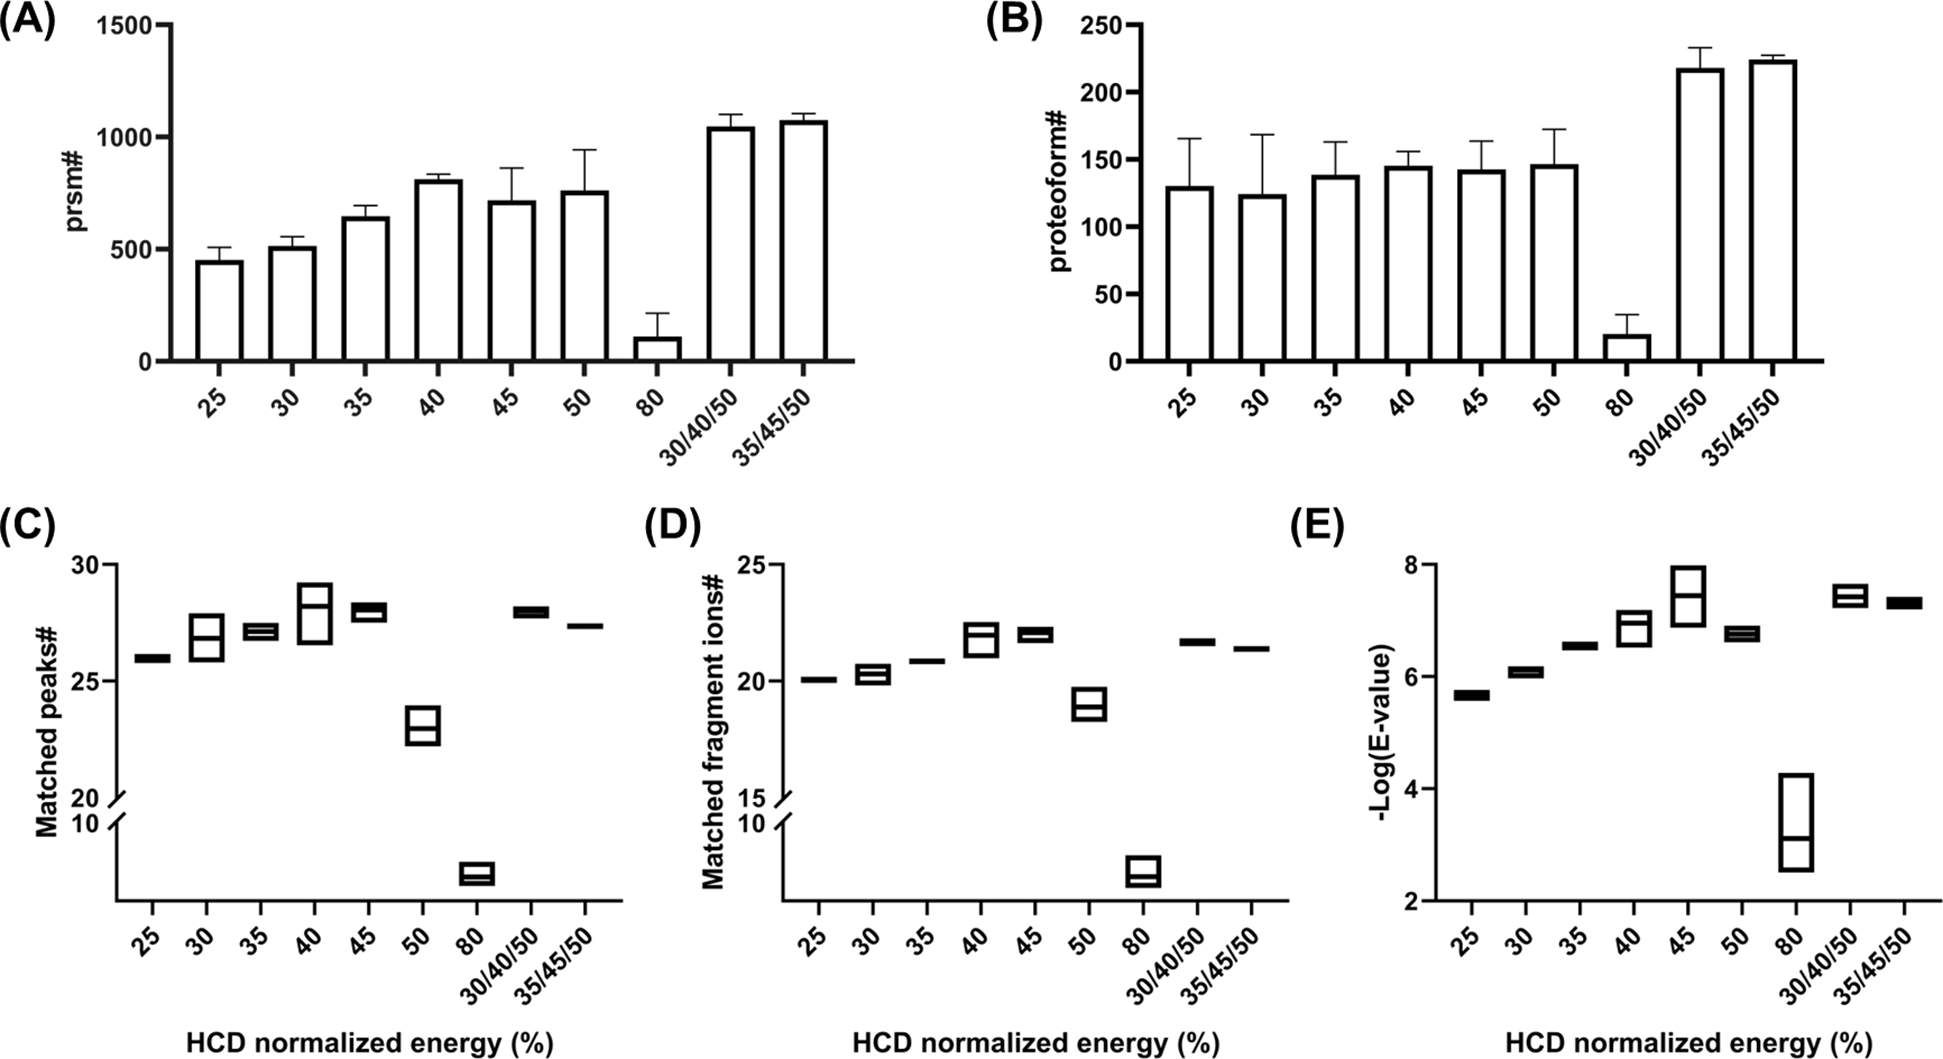
Identification of PrSMs and unique proteoforms using single NCEs and SNCE schemes. Bar graph representation of (A) matched PrSMs; (B) uniquely identified proteoforms. Box plot representation of the (C) average number of matched peaks for matched PrSMs; (D) average number of uniquely matched fragment ions for matched PrSMs; (E) average E-values for matched PrSMs. *Error bars represent the standard deviations.
Identified PrSMs and proteoforms alone cannot entirely gauge the quality of MS2; these spectra can be further evaluated using the matched fragment peaks (i.e., fragment peaks matched in MS2 spectra, one fragment ion may have multiple fragment peaks due to charge distribution). We plotted the average number of matched peaks for all PrSMs (Figure 3C) against different normalized HCD energies and found that the number of matched peaks increased as NCE increased from 25% to 45% but dramatically decreased for 50% and 80%. A similar trend was observed for the matched unique fragment ions (i.e., matched fragment ions counted only once regardless of the number of charge states matched) as shown in Figure 3D. Additionally, we examined the E-value (expected value, an indicator of statistical significance for database matching)for the PrSMs to determine the confidence of the identifications. The average -log(E-value) for all PrSMs were plotted against different normalized HCD energies, as demonstrated in Figure 3E, identification confidence increased as NCE increased from 25% to 45% but decreased at 50% and 80%. Overall, the results suggested that as NCE increased from 25% to 45%, the identification confidence level increased, but decreased when NCE = 50% and 80%.
We further evaluated the fragmentation efficiency using different normalized HCD energies as a function of proteoform molecular weight (Figure 4). For moderately sized proteoforms (10–20 kDa), the number of PrSMs generated and proteoforms identified increased with increasing NCE up to 45–50%. These proteoforms represented approximately 70% of all identified proteoforms. Interestingly, for higher molecular weight proteoforms (>20 kDa), higher normalized HCD energies (50% and 80%) generated more PrSMs than the lower energies. This suggested that larger proteoforms may need a higher energy for efficient backbone fragmentation.43 A 22 kDa intact proteoform of Stathmin (STMN1, Uniprot#P16949) was shown as an example in Figure 5. The observed monoisotopic mass was 22358.55 Da with a mass measurement accuracy of 5.96 ppm compared with the theoretical mass of 22358.42 Da. The reporter ion intensities increased from 5.12E2 at NCE = 30% to 4.62E5 at NCE = 80%. No protein fragments were observed at NCE = 25% and 30% (no reporter ion was detected at NCE = 25%). The highest sequence coverage was observed at NCE = 50%, which yielded a 13% sequence coverage with the reporter ion intensity of 2.14E5 (Supplementary Table 2). NCE = 80%, on the other hand, resulted in the highest reporter ion intensity (4.62E5), but no fragment ions were detected. We also noticed that the peak with the highest intensity at NCE= 50% was the precursor ion, which suggested that the optimal HCD NCE would be between 50% and 80%.

Bar graph depicting the number of (A) matched PrSMs and (B) proteoforms identified as a function of molecular weight for each single NCE and SNCE scheme. The legends show the NCE used for fragmentation and the error bars represent standard deviation.
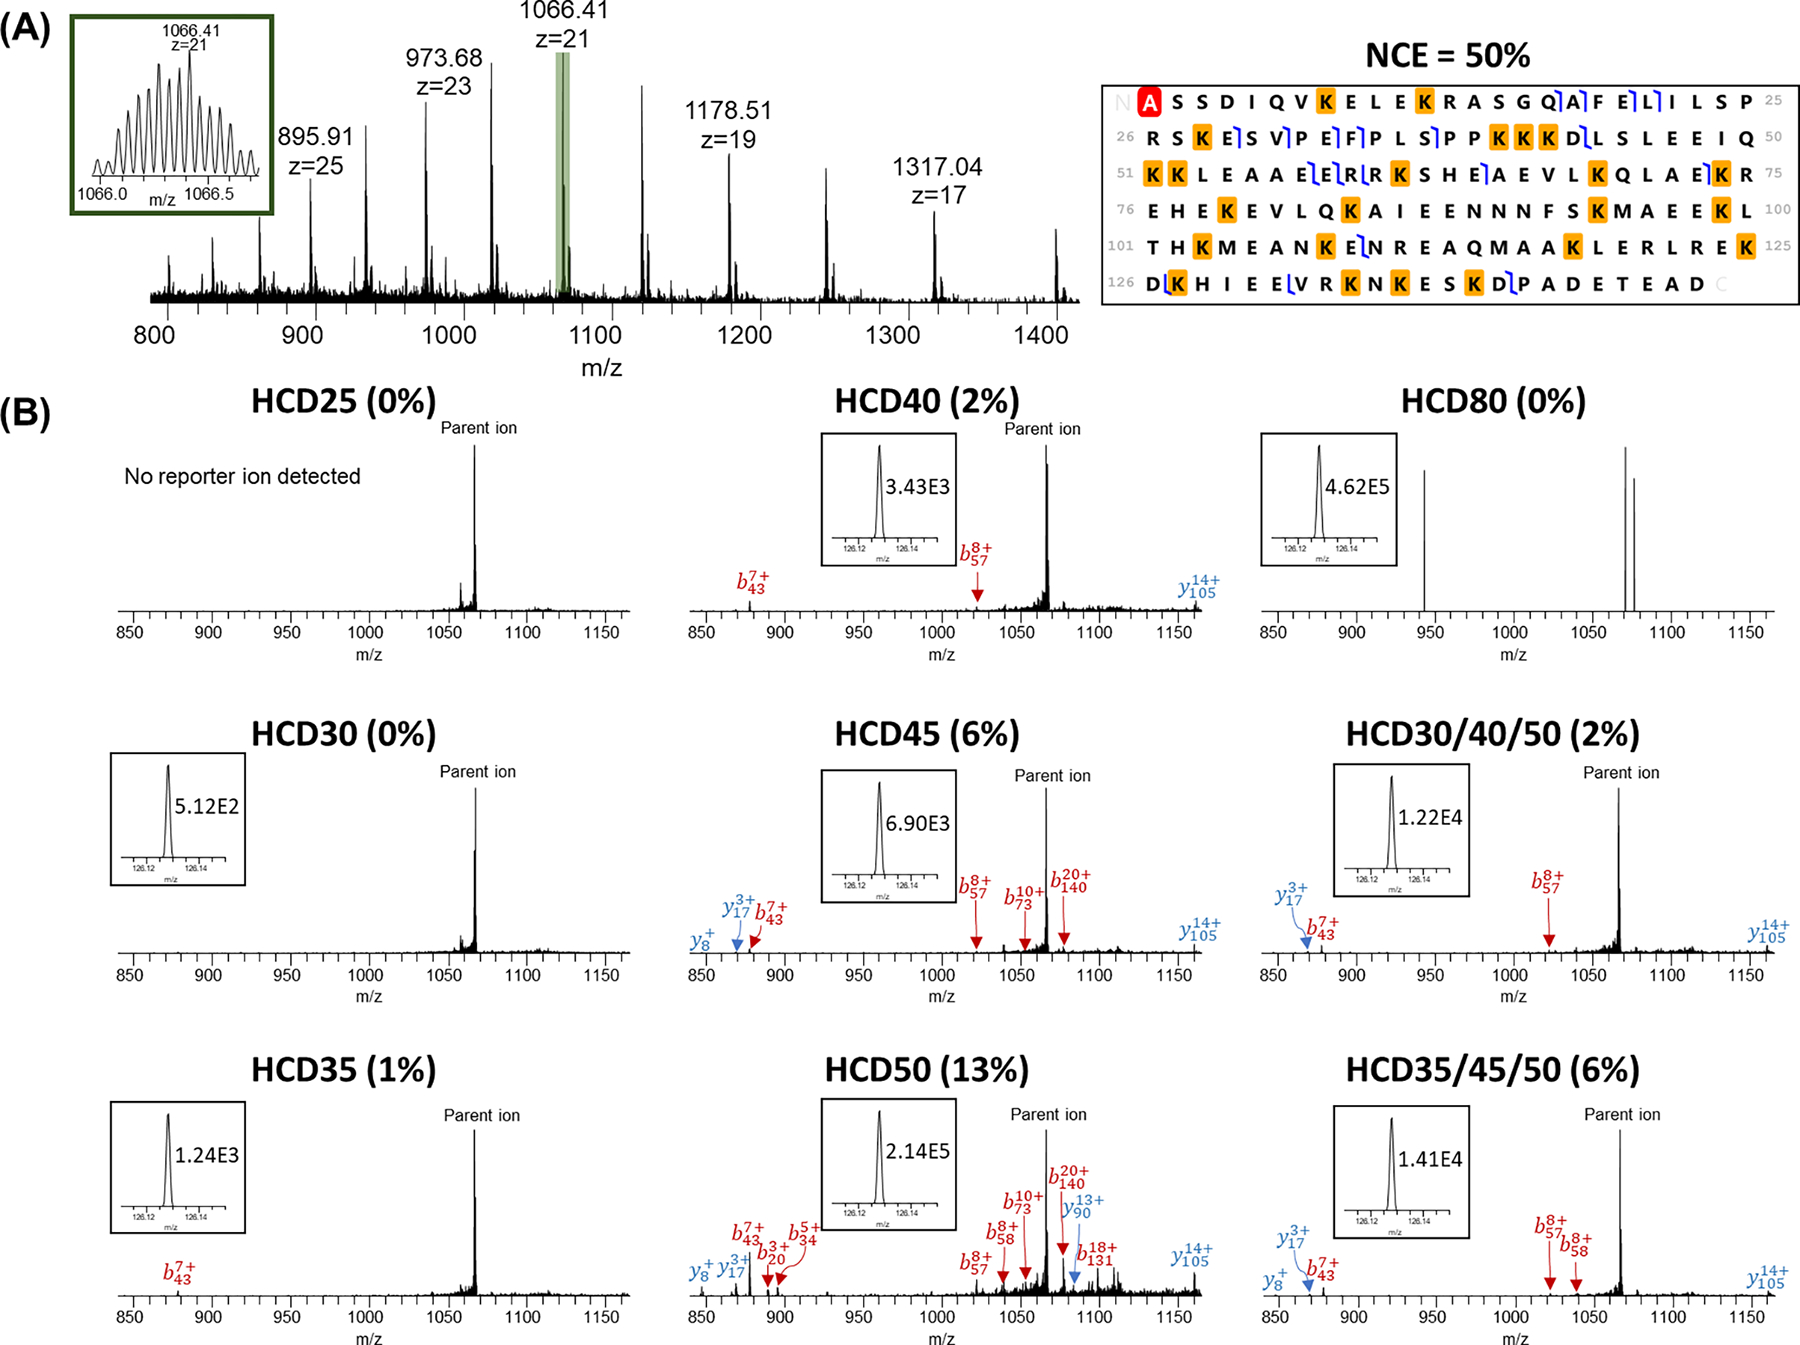
HCD analysis of Stathmin (STMN1, Uniprot#P16949) with different NCEs. (A) MS spectrum and representative fragmentation map using NCE = 50%. Red highlight represents acetylation and yellow highlights represent TMT tags; (B) MS/MS spectra for +21 charge state precursor ions using single NCEs and SNCE schemes. Reporter ion peaks and the intensities are shown in the inset.
Another 20 kDa intact proteoform of endothelial differentiation-related factor 1 (EDF1, Uniprot#O60869) was shown in Figure 6. The observed monoisotopic mass was 20752.89 Da with the mass measurement accuracy of 10.55 ppm to its theoretical monoisotopic mass. For this proteoform, no fragments (either protein fragments or reporter ions) were detected at the NCE = 25% and 30%. The reporter ion intensities increased from 1.00E3 at NCE = 35% to 9.54E4 at NCE = 80% (~95-fold). The precursor ion peak (903.80 m/z, z = 23) was the dominant peak when the NCE was below 45% with only a few fragment ions detected. The MS2 spectrum at NCE = 50% showed the highest number of detected fragment peaks and relatively high reporter ion intensity (1.37E4). NCE = 80% was too high for efficient terminal fragment detection, but this energy resulted in the highest intensity of reporter ion (9.54E4).
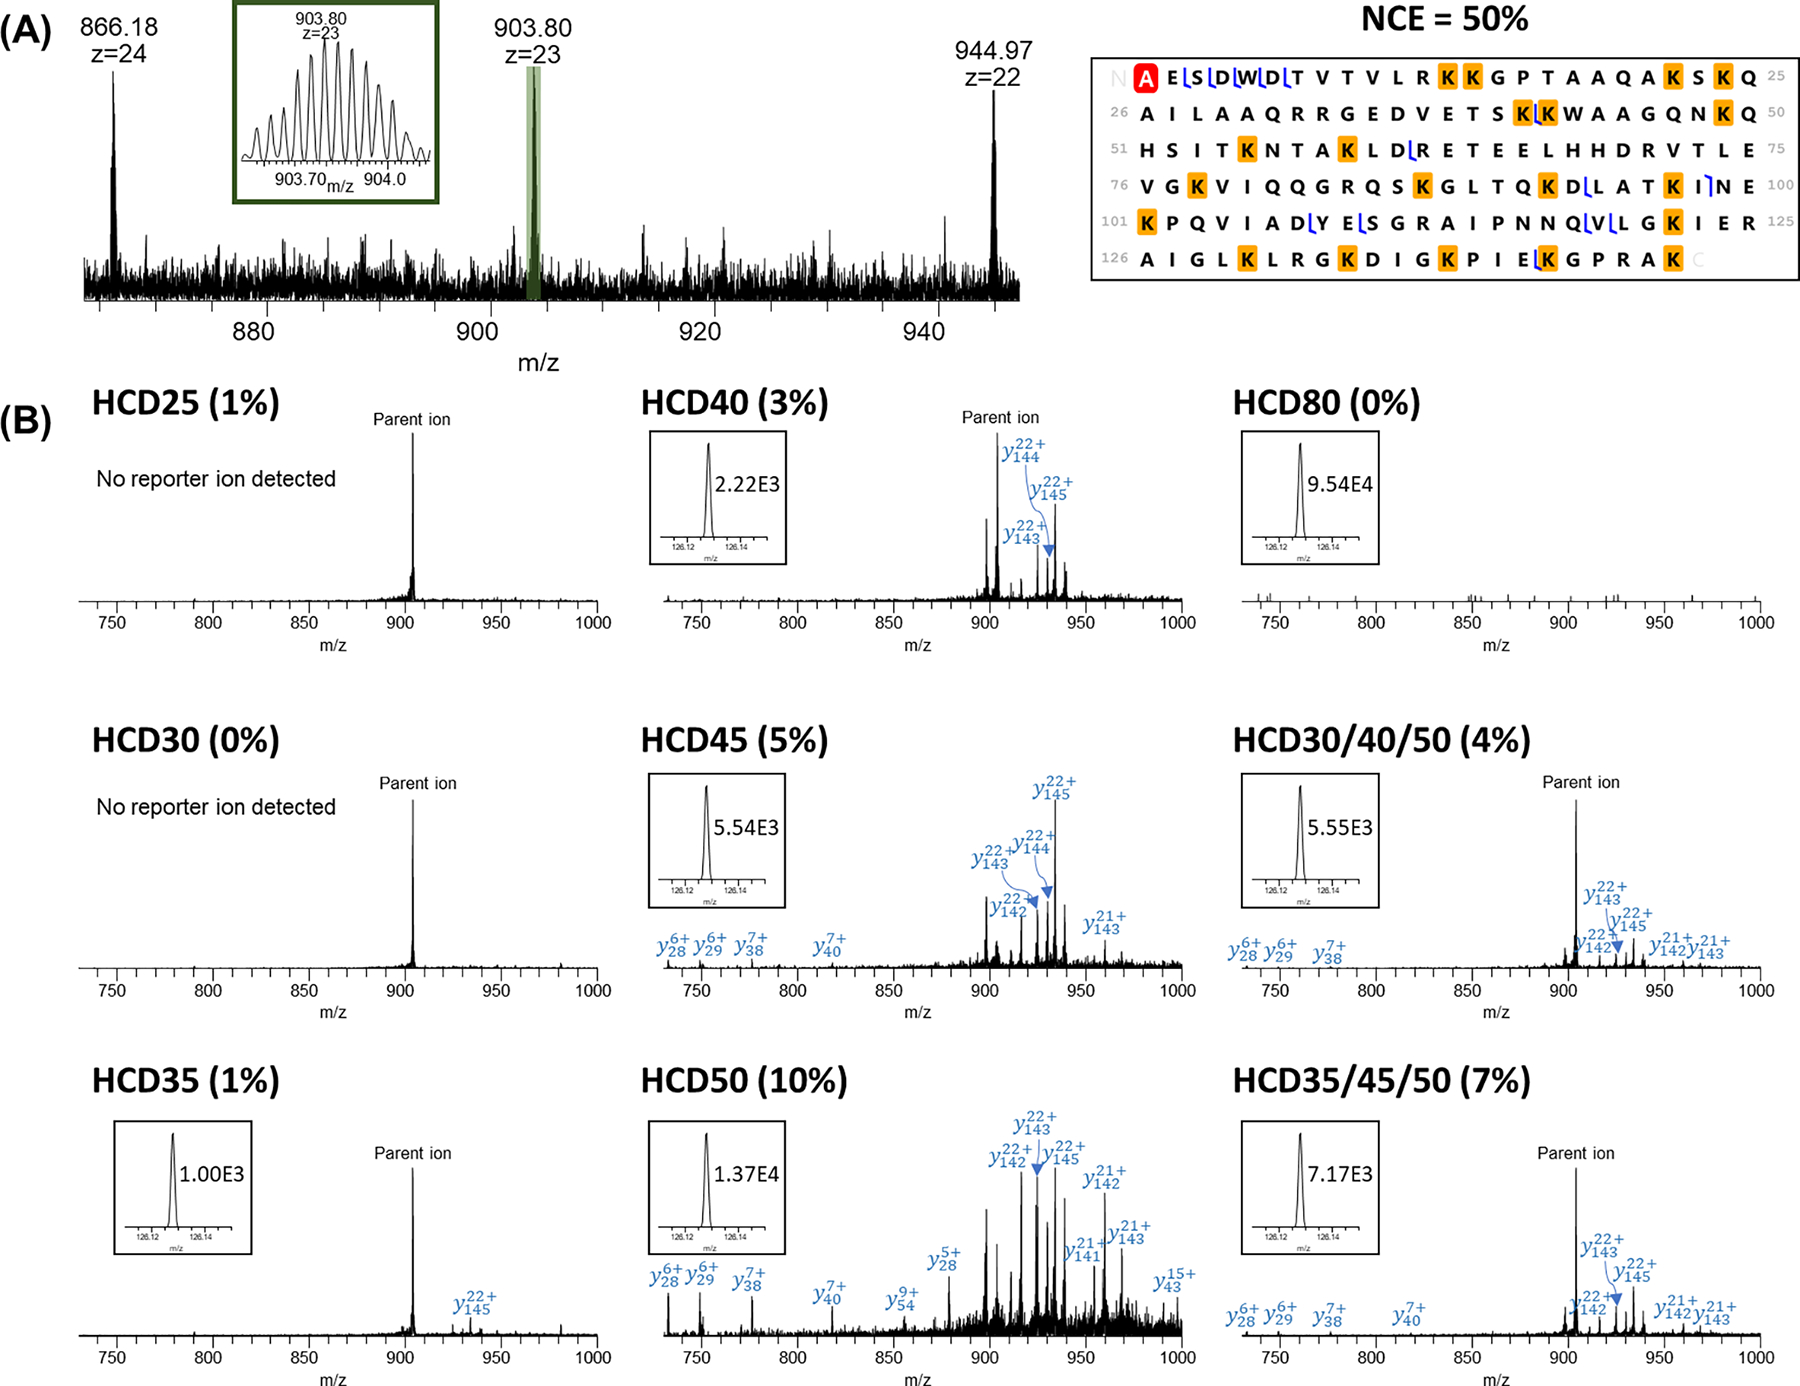
HCD analysis of Endothelial differentiation-related factor 1 (EDF1, Uniprot#O60869) with different NCEs. (A) MS spectrum and representative fragmentation map using NCE = 50%. Red highlight represents acetylation and yellow highlights represent TMT tags; (B) MS/MS spectra for +23 charge state precursor ions using single NCEs and SNCE schemes. Reporter ion peaks and the intensities are shown in the inset.
The trend was opposite for small proteoforms with M.W. < 5 kDa compared with large M.W. proteoforms. For these smaller proteoforms, the NCE = 25% identified the highest number of PrSMs. For example, MS2 spectra of a small intact protein prothymosin alpha (Uniprot#P06454, observed monoisotopic mass: 4684.43 Da; theoretical monoisotopic mass: 4684.46; mass measurement accuracy: 5.08 ppm, 938.30 m/z, z = 5) was evaluated as shown in Figure 7. As expected, reporter ion intensities increased as NCE increased from 1.14E4 at 25% to 6.04E5 at 80% (~53-fold). However, sequence coverage decreased from 68% at NCE = 25% to 3% at NCE = 80%, suggesting smaller proteoforms (<5 kDa) may need a lower fragmentation energy for better protein backbone fragmentation as opposed to larger proteoforms (>20 kDa).43 For most proteoforms with M.W. >5 kDa, NCE = 25% may not be sufficient for complete protein fragmentation while NCE = 50% or 80% may start to cause over-fragmentation. For example, as shown in Supplementary Figure 1, a fragmentation heatmap of parathymosin (Uniprot#P20962) at differing normalized HCD energies depicts all N- and C-terminal fragments (i.e., internal fragments that contain neither N- or C-termini were not considered44,45). Most of the fragments of parathymosin were located in the N-terminal and the middle of the sequence. ~30% sequence coverage was achieved when NCE was below 40%. Fewer large fragment ions were detected when higher NCEs were applied (e.g., NCE ≥ 40%). Bias against longer terminal fragment ions was previously reported to be linked with repeated backbone cleavage for internal fragment production, which increased with increased fragmentation energy.46
Optimization of stepped normalized HCD fragmentation scheme
Stepped normalized collisional energies (SNCE) fragments precursor ions at different energies (e.g., low, medium, and high) and then all fragment ions are combined and detected simultaneously.20 The use of SNCE is particularly helpful for TMT-labeled intact proteoforms in complex sample due to the high sample complexity and large range of proteoform size. Our results suggested that the SNCE fragmentation schemes with NCEs between 30% and 50% can efficiently fragment intact proteoforms with an extensive range of molecular weights (e.g., lower than 30 kDa) with reasonable reporter ion intensities. We selected 3 energies in this range for the SNCE schemes (NCE = 30/40/50% and 35/45/50%). The NCE = 80% was not included in the initial test because very few fragment ions were detected for protein identification. NCE = 25% was not included because of low reporter ion intensities and the presence of intense peaks representing unfragmented precursor ions. Use of SNCE aims to improve both broad proteoform identification and TMT reporter ion quantification.
Overall, both fragmentation schemes generated relatively high reporter ion intensities, an average intensity of 3.24E4 for SNCE = 30/40/50% and an average intensity of 4.03E4 for SNCE = 35/45/50%, respectively (Figure 1). These results were similar to the average reporter ion intensity from the NCE = 45% run but with lower variation. No significant difference was observed between these two schemes but the average reporter ion intensity with the 35/45/50% scheme was slightly higher since relatively higher average NCE was used. As shown in Figure 1D, many low abundance proteoforms showed high reporter ion intensities with stepped HCD energies. For example, for features with intensities from 7.9E7 to1.3E8 (log value 7.9–8.1, ~10E3 fold lower than the highest proteoforms intensity), average reporter ion intensities were 3.14E4 at SNCE = 30/40/50% and 2.87E4 at SNCE = 35/45/50%.
Also, the fragmentation schemes with stepped HCD energies (30/40/50% and 35/45/50%) in general identified more PrSMs and unique proteoforms compared to other energies (Figure 3A&B). In 30/40/50% scheme, 1047±44 PrSMs and 218±12 unique proteoforms were confidently identified with an average E-value of 3.8E-8. In 35/45/50% scheme, 1076±24 PrSMs and 224±3 unique proteoforms were confidently identified with an average E-value of 5.0E-8. For experiments using single NCE values, the NCE = 40% provided the highest number of PrSMs (811±19), NCE = 50% provided the highest number of unique proteoforms (146±21), and the NCE = 45% demonstrated the lowest average E-value as 3.6E-8. Overall, the stepped schemes allowed for improved proteoform identification with higher confidence. In addition, SNCE = 35/45/50% provided slightly higher reporter ion intensities and identified more PrSMs and proteoforms compared to SNCE = 30/40/50%, but the average E-value was slightly higher in NCE 35/45/50%, suggesting slightly better identification confidence in NCE = 30/40/50%. The SNCE schemes significantly improved the identification of proteoforms with molecular weight <20 kDa and especially for proteoforms from 5–10 kDa, there was a >2-fold improvement of the number of identified PrSMs and proteoforms compared with all schemes using single NCE value. For high M.W. proteoforms (>20 kDa), higher NCE energy (e.g., larger than 50%) resulted in improved fragmentation, so the current stepped scheme may not outperform a scheme using a single NCE value (50% or 80%).
As shown in Figure 2, parathymosin (charge state = 15) showed reporter ion intensities of 1.02E4 at SNCE = 30/40/50% and 2.18E4 at SNCE = 35/45/50%. Although these reporter ion intensities were similar to the reporter ion intensities at NCE = 45% (8.42E3) and 50% (2.46E4), there were more matched fragment peaks in the MS2 spectra (142 for NCE = 30/40/50% and 101 for 35/45/50%) when compared with NCE = 45% and 50% (35 and 33, respectively). A higher number of matched fragment peaks result in improved MS2 spectra quality using SCNE schemes. A similar trend was observed for charge state = 13 (1105.41 m/z) (Supplementary Figure 1B–D), higher sequence coverage was achieved in the SNCE runs (34% and 32% for 30/40/50% and 35/45/50%, respectively) compared to runs using single NCEs. Reporter ion intensities increased from 0 to 9.33E5 as NCE increased from 25% to 80%, similar to those detected for charge state = 15.
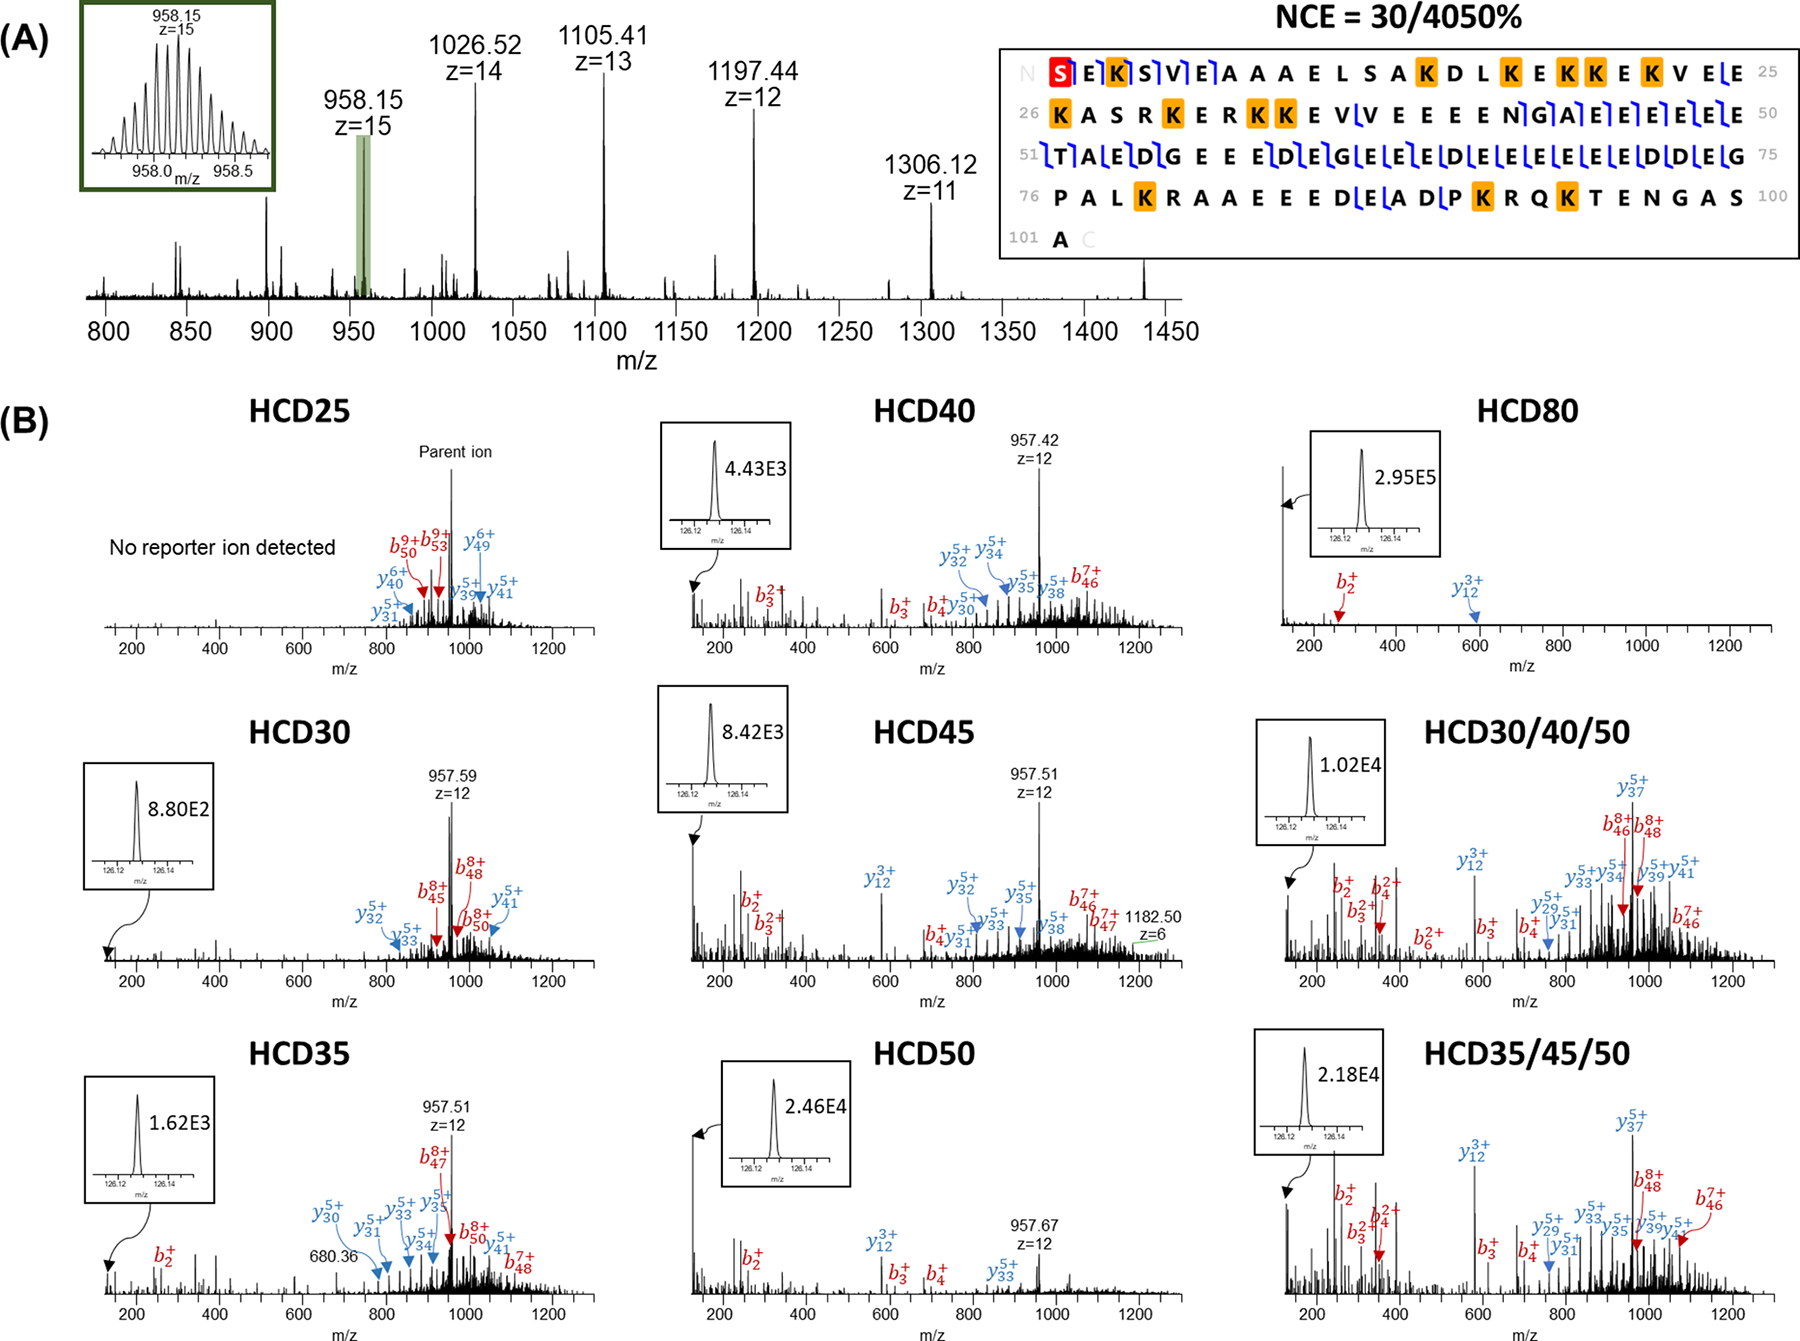
Parathymosin protein (Uniprot#P20962): (A) MS spectrum (inset: isotopic distribution of charge state 15) and representative protein sequence fragmented using SNCE = 30/40/50%. Red highlight represents acetylation and yellow highlight represent TMT tags. (B) MS/MS identification spectra for charge state = 15 using single HCD energies and SNCE schemes. Reporter ion peak and intensity are shown in the inset for each energy in which a reporter ion was detected.
In addition, the largest fragment was 10333.81 Da at SNCE = 30/40/50%, and 8742.64 Da at SNCE = 35/45/50% compared with 7882.33 Da at NCE = 45% and 7495.21 Da at NCE = 50%, suggesting SNCE performed better to maintain large fragments compared with the schemes using single NCE values (Supplementary Table 1). We also evaluated the largest fragment detected using different NCEs as well as SNCEs in other protein examples (Supplementary Table 2–4). Our results suggested that SNCEs were able to maintain large fragments for a variety of proteoforms with different molecular weights (e.g., 5–22 kDa). As shown in Supplementary Figure 1A, higher sequence coverage was observed in the SNCE runs (41% and 35% for 30/40/50% and 35/45/50%, respectively for parathymosin (charge state = 15, 958.09 m/z). Sequence coverage decreased to 22% for NCE = 45% and 17% for NCE = 50% due to relatively poor MS2 spectra. Although NCE = 80% provided the highest reporter ion intensity (2.95E5), over-fragmentation resulted in only 2 matched fragment peaks and 2% sequence coverage. When NCE < 45%, the reporter ion intensity was < 5E3 (no reporter ion peak was detected at NCE = 25%) and fewer fragment peaks (<100) were matched, resulting in approximatedly30% sequence coverage.
Overall, the results suggested the SNCE scheme outperformed schemes using single HCD energy to balance accurate quantification and confident identification.
Evaluation of the effect of normalized HCD fragmentation energy on TMT-based quantification
To verify the labeling accuracy, the intensity ratios among each pair of samples were compared (130C/129C, 131/129C) for all the scans in which all reporter ions were detected (Figure 8A). In all single NCE runs (e.g., from 25% to 80%), the average reporter ion ratios were similar to the theoretical ratios for both sample ratios. For example, the average reporter ion ratios between 130C/129C were between 3.37 ± 1.41 (NCE =25%) and 3.93 ± 2.13 (NCE=50%), which is consistent with the theoretical ratio of 4. In both SNCE schemes, the average reporter ion ratios were also close to the theoretical ratio (e.g., 3.94 ± 2.31 for SNCE 30/40/50% and 3.89 ± 2.21 for SNCE 35/45/50%). However, the average reporter ion intensities were much lower (3.24E3 for 130C tag) in NCE of 25% compared with higher NCE values (e.g., 8.02E4 for 130C tag at NCE = 50%). A similar trend was observed when the average reporter ion ratios were calculated for only scans that produced PrSMs, as shown in Figure 8B. Our results suggested that MS/MS scans in which all report ions were detected provided good quantification accuracy, even with low reporter ion intensities. However, when NCE value was too low, many MS/MS scans contained missing reporter ions (shown in Figure 8C). ≥ 50% of the scans showed missing reporter ions using NCE ≤ 30%, while most MS/MS scans at NCE ≥ 50% had no missing reporter ions (e.g., <1 % in NCE =50%). Overall, our results indicated that when single NCEs are used, higher NCE (i.e., ≥ 40%) was required for a relatively accurate quantification with no missing reporter ions. The SNCE schemes (30/40/50% and 35/45/50%) provided good quantification accuracy compared to single NCEs.
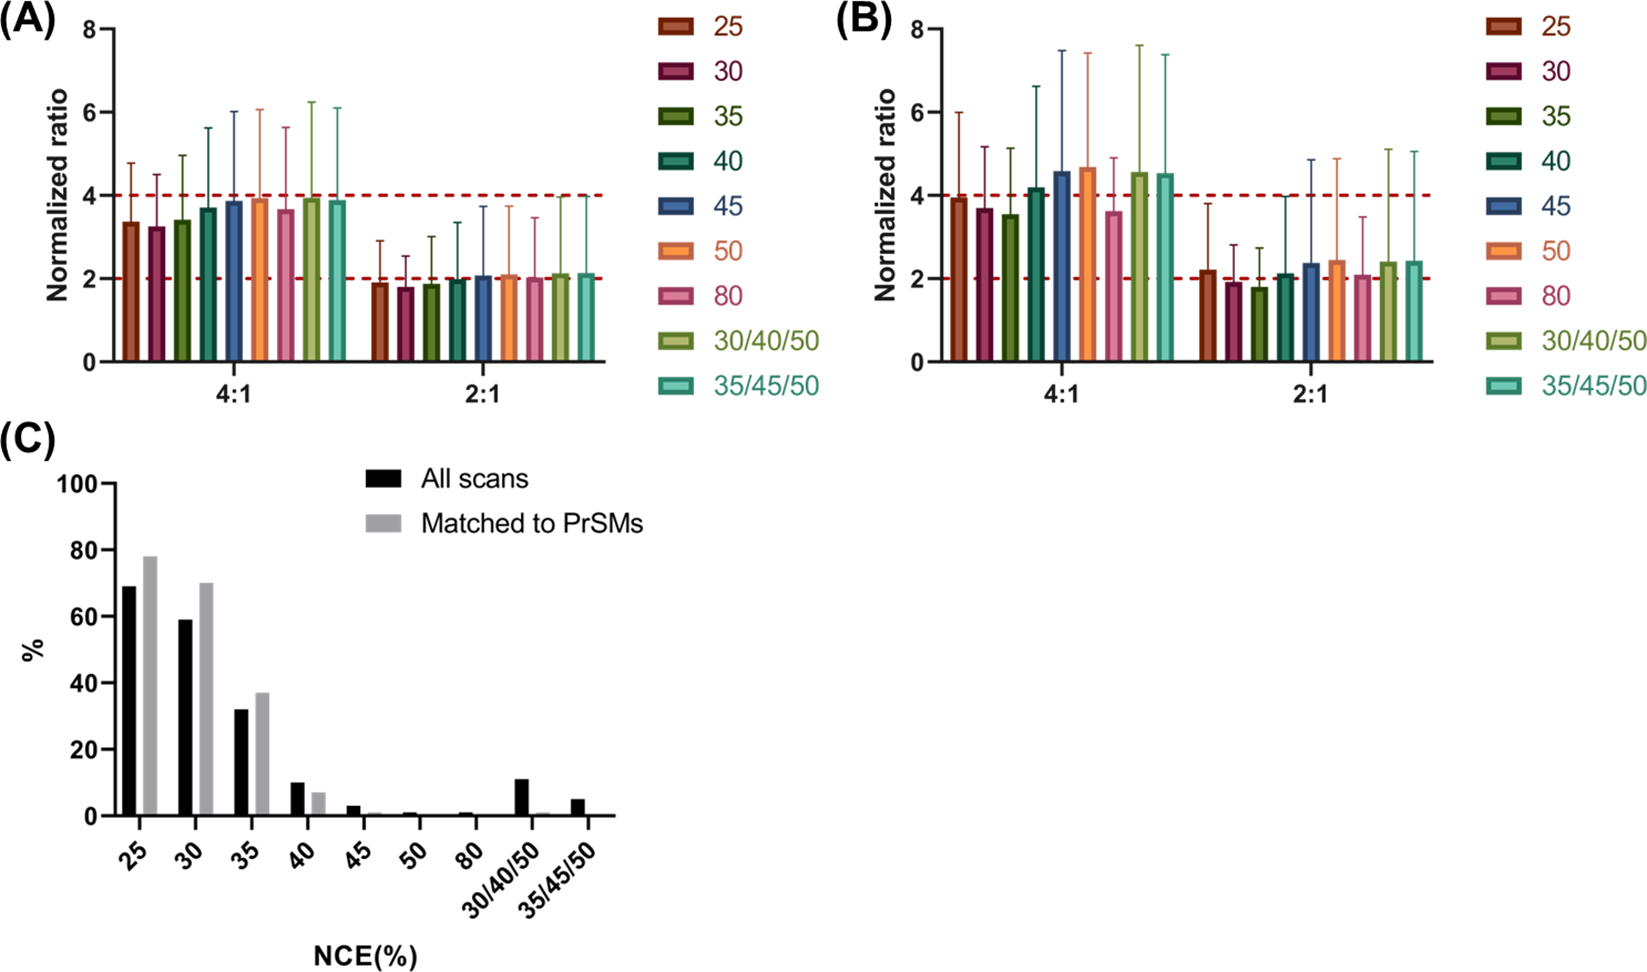
Evaluation of quantification accuracy using different NCEs. Bar graph representations of the normalized intensity ratio (130C/129C, 131/129C) of (A) all MS/MS scans and (B) all PrSMs. In these graphs, scans with any missing tags were not included. Error bars represent the standard deviation of reporter ion ratios from all scans. Red lines represent theoretical normalized ratios, 4:1 and 2:1. (C) Percentage of MS/MS scans (black) or PrSMs (grey) with missing detection of reporter ions at different NCEs.
We further evaluated the identification and quantification of multiple proteoforms of the same protein. Supplementary Figure 2 shows two fully labeled proteoforms of heterogeneous nuclear ribonucleoprotein U (HNRNPU, Uniprot#Q00839) using SNCE = 30/40/50%. The initiator methionine was removed for both proteoforms. Proteoform 1 contained an acetylation at the N-terminal serine, and proteoform 2 included the addition of an unlocalized phosphorylation. Our results demonstrated similar fragmentation patterns between these two proteoforms using the SNCE schemes. No neutral loss peaks were detected for the phosphorylated proteoform, consistent with previous reports.47 Quantification accuracy was evaluated by calculating normalized ratios of reporter ion intensities (130C/129C, 131/129C) for all the scans that matched to PrSMs of these HNRNPU proteoforms. The quantification accuracy between the two proteoforms was similar, with normalized ratios of 3.53 ± 0.20 and 1.95 ± 0.13 for proteoform 1 and 3.73 ± 0.28 and 2.04 ± 0.12 for proteoform 2. Similar results were observed for two Calmodulin-1 (CALM1, Uniprot#P0DP23) proteoforms using SNCE = 30/40/50% (Supplementary Figure 3). The initiator methionine was removed for both proteoforms. Proteoform 1 had 1 acetylation at the N-terminal alanine and 1 trimethylation at K116; proteoform 2 had 1 acetylation and 1 unlocated phosphorylation. Similar quantification accuracy was achieved for the two proteoforms. In summary, similar quantification accuracy and fragmentation patterns were observed for the same protein with different PTMs.
CONCLUSION
Here, we have explored the effect of variation in HCD fragmentation energies on reporter ion intensity and proteoform identification for TMT-labeled intact proteoforms in HeLa cell lysate. Our results indicated that although SNCE energies did not provide the highest reporter ion intensity, SNCEs outperformed single NCEs by providing a balance between high reporter ion intensity that was sufficient for accurate and sensitive quantification and confident identification leading to more PrSMs and identified proteoforms More matched fragment peaks (including some large fragments) and relatively low E-values were also observed using SNCEs. In this study, we evaluated two SNCE schemes with NCEs between 30% and 50%. The development and optimization of new stepped schemes may be required for different biological samples with different applications. For example, single cell proteomics (SCP) may require the inclusion of higher NCE (e.g., 80%) to generate sufficient reporter ion intensities in each cell channel. Higher NCE may also be beneficial for high MW proteins. On the other hand, the inclusion of lower NCE, such as 25%, may increase the sequence coverage for identification of site-specific modifications.26
Quantification accuracy was also evaluated at different NCEs, and the results suggested that when lower NCEs were applied, quantification accuracy was significantly skewed due to the missing detection of reporter ions. NCE ≥ 40% was required to obtain good quantification accuracy. SNCEs provided good overall quantification accuracy. The effect of PTMs on identification and quantification of the same protein was also evaluated and similar quantification accuracy was observed. Future work should be done to systematically evaluate the effect of PTMs on identification and quantification in a proteome-wide range.
We also observed that optimal NCE was dependent on the proteoform size and larger proteoforms (>20 kDa) require higher NCE (e.g., NCE = 50%) for better quantification and identification. SNCE schemes, however, significantly improved the identification for proteoforms with molecular weight <20 kDa.43 Thus, molecular weight-based fractionation methods such as Gel-Eluted Liquid Fraction Entrapment Electrophoresis (GELFrEE)48,49, Passively Eluting Proteins from Polyacrylamide gels as Intact species for MS (PEPPI-MS)50,51, and size exclusion chromatography (SEC)52–54 may be considered for prefractionation so that single NCEs or more targeted SNCEs may be used for improved proteoform identification in a narrow M.W. range for a better balance between quantification sensitivity and identification confidence. As mentioned previously, the TMT labeling protocol was optimized for quantification of low molecular weight proteoforms18, thus sample preparation to observe larger proteins such as IgG (~150 kDa) need to be optimized in the future using MS compatible detergent (e.g., Azo)1,18,55. In this case, the optimization of NCE used for TMT-labeled larger intact proteoforms may also need to be optimized. In addition, some multidimensional separation approaches (e.g., high-pH/low-pH RPLC)32,56–58 can also be implemented to reduce sample complexity for improved identification while maintaining high quantification sensitivity and accuracy. Furthermore, the optimal collision energy may vary depending on the instruments and samples, therefore, the optimization of fragmentation energy may be is necessary before the MS analysis. Other instrument parameters such as maximum injection time and auto gain control (AGC) can also be optimized. Some other combined fragmentation approaches may also be considered, such as EThcD (combined electron-transfer dissociation, ETD and HCD) for a balance between identification and quantification.19
Supplementary Material
Supplementary
Supplementary Figure 1. Fragment ion heatmaps of parathymosin protein (Uniprot#P20962) with (A) +15 charge state and (B) +13 charge state using different NCEs. Color scale represents the detection of b, y, and b/y ions; (C) MS/MS spectra of parathymosin with +13 charge state using different NCEs; (D) representative fragment maps at different NCEs. Red highlight represents acetylation, and yellow highlights represent TMT tags.
Supplementary Figure 2. Evaluation of the effect of PTMs on quantification and identification. (A) Sequence and MS/MS spectra for two proteoforms of heterogeneous nuclear ribonucleoprotein U (HNRNPU, Uniprot#Q00839) at SNCE = 30/40/50%. (B) Bar graph showing quantification of the two proteoforms. Error bars shows the standard deviation of reporter ion intensities among all identified PrSMs for HNRNPU.
Supplementary Figure 3. Evaluation of the effect of PTMs on quantification and identification. (A) Sequence and MS/MS spectra for two proteoforms of Calmodulin-1 (CALM1, Uniprot#P0DP23) at SNCE = 30/40/50%. (B) Bar graph showing quantification of the two proteoforms. Error bars shows the standard deviation of reporter ion intensities among all identified PrSMs for CALM1.
Supplementary Table 1. Largest fragment mass for parathymosin (PTMS, Uniprot# P20962) with different charges at different NCEs.
Supplementary Table 2. Largest fragment mass for Stathmin (STMN1, Uniprot#P16949) at different NCEs.
Supplementary Table 3. Largest fragment mass for endothelial differentiation-related factor 1 (EDF1, Uniprot#O60869) at different NCEs.
Supplementary Table 4. Largest fragment mass for prothymosin alpha (PTMA, Uniprot#P06454) at different NCEs.
ACKNOWLEDGMENTS
This work was partly supported by grants from NIH NIAID R01AI141625, NIH NIGMS R01GM118470, and NIH NIAID- 2U19AI062629.
Footnotes
The following supporting information is available free of charge at ACS website http://pubs.acs.org
DATA AVAILABLITY
All MS raw files (.mzML) and TopPIC Suite search results (.xlsx for PrSMs and Proteoforms) have been deposited to the ProteomeXchange Consortium (http://www.proteomexchange.org) via PRIDE partner repository with dataset identifier as PXD037491.
REFERENCE
Full text links
Read article at publisher's site: https://doi.org/10.1021/acs.jproteome.2c00549
Read article for free, from open access legal sources, via Unpaywall:
https://www.ncbi.nlm.nih.gov/pmc/articles/PMC10164041
Citations & impact
Impact metrics
Citations of article over time
Alternative metrics

Discover the attention surrounding your research
https://www.altmetric.com/details/140870049
Smart citations by scite.ai
Explore citation contexts and check if this article has been
supported or disputed.
https://scite.ai/reports/10.1021/acs.jproteome.2c00549
Article citations
Characterizing age-related changes in intact mitochondrial proteoforms in murine hearts using quantitative top-down proteomics.
Clin Proteomics, 21(1):57, 30 Sep 2024
Cited by: 0 articles | PMID: 39343872 | PMCID: PMC11440756
Mass spectrometry-intensive top-down proteomics: an update on technology advancements and biomedical applications.
Anal Methods, 16(28):4664-4682, 18 Jul 2024
Cited by: 0 articles | PMID: 38973469 | PMCID: PMC11257149
Review Free full text in Europe PMC
Top-down proteomics.
Nat Rev Methods Primers, 4(1):38, 13 Jun 2024
Cited by: 2 articles | PMID: 39006170
Pilot Evaluation of the Long-Term Reproducibility of Capillary Zone Electrophoresis-Tandem Mass Spectrometry for Top-Down Proteomics of a Complex Proteome Sample.
J Proteome Res, 23(4):1399-1407, 28 Feb 2024
Cited by: 1 article | PMID: 38417052 | PMCID: PMC11002928
Very Low-Pressure CID Experiments: High Energy Transfer and Fragmentation Pattern at the Single Collision Regime.
Molecules, 29(1):211, 30 Dec 2023
Cited by: 0 articles | PMID: 38202794 | PMCID: PMC10780993
Go to all (7) article citations
Data
Data behind the article
This data has been text mined from the article, or deposited into data resources.
BioStudies: supplemental material and supporting data
Genes & Proteins (Showing 6 of 6)
- (5 citations) UniProt - P20962
- (3 citations) UniProt - P16949
- (3 citations) UniProt - O60869
- (3 citations) UniProt - P06454
- (2 citations) UniProt - P0DP23
- (2 citations) UniProt - Q00839
Show less
Similar Articles
To arrive at the top five similar articles we use a word-weighted algorithm to compare words from the Title and Abstract of each citation.
A benchmarking protocol for intact protein-level Tandem Mass Tag (TMT) labeling for quantitative top-down proteomics.
MethodsX, 9:101873, 07 Oct 2022
Cited by: 4 articles | PMID: 36281278 | PMCID: PMC9587358
Improving data quality and preserving HCD-generated reporter ions with EThcD for isobaric tag-based quantitative proteomics and proteome-wide PTM studies.
Anal Chim Acta, 968:40-49, 16 Mar 2017
Cited by: 15 articles | PMID: 28395773 | PMCID: PMC5509462
Improved precision of iTRAQ and TMT quantification by an axial extraction field in an Orbitrap HCD cell.
Anal Chem, 83(4):1469-1474, 28 Jan 2011
Cited by: 27 articles | PMID: 21275378 | PMCID: PMC3270567
Trends in the Design of New Isobaric Labeling Reagents for Quantitative Proteomics.
Molecules, 24(4):E701, 15 Feb 2019
Cited by: 25 articles | PMID: 30781343 | PMCID: PMC6412310
Review Free full text in Europe PMC
Funding
Funders who supported this work.
NIAID NIH HHS (2)
Grant ID: U19 AI062629
Grant ID: R01 AI141625
NIGMS NIH HHS (1)
Grant ID: R01 GM118470
National Institute of Allergy and Infectious Diseases (2)
Grant ID: 2U19AI062629
Grant ID: R01AI141625
National Institute of General Medical Sciences (1)
Grant ID: R01GM118470
