Abstract
Free full text

In vivo evaluation of complex polyps with endoscopic optical coherence tomography and deep learning during routine colonoscopy: a feasibility study
Abstract
Standard-of-care (SoC) imaging for assessing colorectal polyps during colonoscopy, based on white-light colonoscopy (WLC) and narrow-band imaging (NBI), does not have sufficient accuracy to assess the invasion depth of complex polyps non-invasively during colonoscopy. We aimed to evaluate the feasibility of a custom endoscopic optical coherence tomography (OCT) probe for assessing colorectal polyps during routine colonoscopy. Patients referred for endoscopic treatment of large colorectal polyps were enrolled in this pilot clinical study, which used a side-viewing OCT catheter developed for use with an adult colonoscope. OCT images of polyps were captured during colonoscopy immediately before SoC treatment. A deep learning model was trained to differentiate benign from deeply invasive lesions for real-time diagnosis. 35 polyps from 32 patients were included. OCT imaging added on average 3:40 min (range 1:54–8:20) to the total procedure time. No complications due to OCT were observed. OCT revealed distinct subsurface tissue structures that correlated with histological findings, including tubular adenoma (n =
= 20), tubulovillous adenoma (n
 =
= 10), sessile serrated polyps (n
 =
= 3), and invasive cancer (n
 =
= 2). The deep learning model achieved an area under the receiver operating characteristic curve (AUROC) of 0.984 (95%CI 0.972–0.996) and Cohen’s kappa of 0.845 (95%CI 0.774–0.915) when compared to gold standard histopathology. OCT is feasible and safe for polyp assessment during routine colonoscopy. When combined with deep learning, OCT offers clinicians increase confidence in identifying deeply invasive cancers, potentially improving clinical decision-making. Compared to previous studies, ours offers a nuanced comparison between not just benign and malignant lesions, but across multiple histological subtypes of polyps.
Supplementary Information
The online version contains supplementary material available at 10.1038/s41598-024-78891-5.
Introduction
Colorectal polyps are known precursors to most colorectal cancers (CRCs), a leading cause of cancer-related deaths worldwide1. The invasion of dysplastic elements beyond the mucosa is a critical factor in determining the appropriate treatment strategy. Endoscopic treatments, such as endoscopic mucosal resection (EMR), endoscopic submucosal dissection (ESD), and endoscopic full thickness resection (EFTR), are curative for neoplasms confined to the mucosa or superficial submucosa (< 1 mm of submucosal invasion). However, owing to an increased risk of lymph node metastasis, neoplastic lesions with deeper submucosal invasion (>
 1 mm) should be referred for surgical resection2,3. Therefore, the ability to accurately assess, in real-time, the presence and extent of submucosal invasion in colorectal lesions is of clear clinical importance4.
Despite significant advances in colorectal lesion diagnosis, current methods still face substantial challenges, particularly in accurately assessing lesions with potential submucosal invasion5. Current endoscopic assessment tools, such as white light colonoscopy (WLC) and narrow-band imaging (NBI), fall short in accuracy, partly due to their inherent reliance on surface morphology and inability to see under the surface. NBI classification systems, such as the Japan NBI Expert Team (JNET) and Kudo pit pattern classification3, have accuracies of < 80% for lesions with superficial submucosal invasion6. Although computeraided diagnosis (CAD) and advanced imaging techniques have achieved diagnostic accuracies of a little over 90% (e.g., WLC, 91.1%4,7,8; magnifying endocytoscopy, 94.1%9; endoscopic ultrasound elastography, 93.3%10; laser endomicroscopy, 91.0%11), they can require exogenous contrast agents and special training.
Optical coherence tomography (OCT), a non-invasive imaging technique with high spatial and temporal resolutions, offers a solution to these challenges. Unlike most other modalities, which are designed for surface imaging, OCT enables clinicians to discern subtle differences in tissue architecture below the surface. Compared to endoscopic ultrasound, OCT provides higher resolution. Additionally, unlike confocal laser endomicroscopy, OCT does not require the administration of fluorescent contrast agents. With an imaging depth of 1–2 millimetres and a resolution of several microns, this non-invasive technique is broadly applied in biomedical imaging, including diagnosing diseases in the human gastrointestinal (GI) tract, such as Barrett’s esophagus, Crohn’s disease, and ulcerative colitis12–14.
To provide an automated and accurate diagnosis, our group has previously developed and tested the application of neural networks to ex vivo images of colorectal specimens15,16. Zeng et al. utilized a pattern recognition network, RetinaNet, on OCT B-scan images acquired from a benchtop OCT system15 and achieved 100% sensitivity and 99% specificity in differentiating normal and malignant colorectal specimens. Moving one step closer to clinical application, Luo et al. developed a miniaturized OCT catheter coupled with a deep neural network, ResNet, to acquire and classify endoluminal OCT images as normal or malignant ex vivo in real time, achieving an accuracy of 92.9% and an area under the receiver operating characteristic (ROC) curve (AUC) of 0.97516.
This pilot clinical study evaluates the feasibility and diagnostic accuracy of an endoscopic OCT catheter for complex polyp assessment in vivo during routine colonoscopy. Feasibility is defined as OCT imaging adding no more than 5 min to over 75% of colonoscopies, addressing the need for efficient and minimally disruptive diagnostics, while the diagnostic accuracy of a deep learning model trained on OCT images is evaluated against the gold standard, surgical pathology. Integrating non-invasive in vivo OCT imaging with AI could markedly improve diagnostic accuracy in real-time, potentially enhancing clinical decision-making about polyps suspicious for deep invasion. This study, to the best of our knowledge, is the first in vivo OCT imaging coupled with a deep-learning diagnostic model for the evaluation of complex polyps.
Results
Clinical characteristics and feasibility
36 consented patients (mean age, 64 years; range, 46–84) were imaged with endoscopic OCT during colonoscopy. Four patients were excluded from analysis due to absence of polyps (n =
= 1), probe malfunction (n
 =
= 1), or poor image quality (n
 =
= 2). Consequently, 32 subjects contributed a total of 35 polyps for OCT image analysis. The subsequent histopathological diagnoses of the lesions included invasive cancer (n
 =
= 2; one T1 and one T3), tubular adenoma (TA, n
 =
= 20), tubulovillous adenoma (TVA, n
 =
= 10), and sessile serrated polyps (SSP, n
 =
= 3). The average maximum dimension of the polyp was 27.5 mm (range, 5–65 mm). Our OCT catheter imaged lesions throughout the colon, from the rectum to the cecum (see Supplementary Table 1 for the location distribution). Lesions displayed various morphologies, with approximately 1/3 pedunculated, 1/3 sessile, and 1/3 flat (see Supplementary Table 2 for Paris class distribution).
Endoscopic OCT imaging increased the colonoscopy procedure time by 3:40 min on average (range, 1:54–8:20 min). The endoscopist’s increasing proficiency with the OCT catheter reduced this duration over time. In 82.9% of cases (29/35), lesions were imaged within 5 min, exceeding the study’s 75% feasibility criterion. No complications associated with OCT imaging were reported.
OCT subsurface visualization of colorectal polyps
In vivo OCT effectively delineated morphological features consistent with H&E-stained micrographs, as illustrated in Fig. 1, where representative OCT images are shown alongside their corresponding WLC and H&E micrograph images. Tubular adenomas exhibited characteristic “teeth-like” patterns paralleling tubular structures in histology (Fig. 1a). Tubulovillous adenomas displayed a greater abundance of “finger-like” villous projections (Fig. 1b). Sessile serrated polyps showed a thinner mucosal layer and a distinct submucosal interface, suggesting crypt basal dilation and horizontal growth along the basement membrane, in agreement with histological observations (Fig. 1c). In contrast to the structured patterns seen in benign/precancerous lesions, invasive cancer (adenocarcinoma, Fig. 1d) presented homogenous and poorly differentiated structures, a key indication of malignancy and potential deep submucosal invasion.
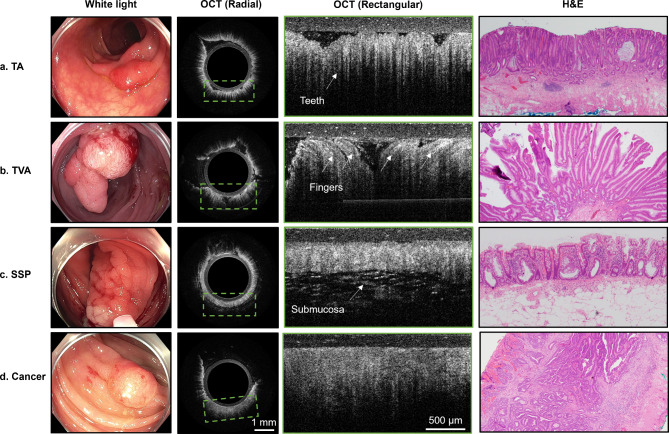
Representative images of non-invasive pre-malignant lesions (TA, TVA, SSP) and malignant (cancer) lesions under white light endoscopy, OCT (radial and rectangular zoomed), and hematoxylin & eosin (H&E) staining from fourin vivo lesions. In OCT images, the layer above tissue is the PTFE tubing. The radial OCT image includes a green bounding box showing the approximate location of the rectangular zoomed OCT image (a) TA demonstrates elongated vertical teeth patterns, indicating the presence of tubular structures observed in the H&E images. (b) In TVA, the presence of villous structures shows on OCT as elongated finger-like projections projecting in all directions. (c) SSP generally displays a thinner mucosa layer with patterns of high intensity without the characteristic teeth patterns, and the submucosa layer is often visible. (d) Malignant lesions lacked distinct teeth or layered structures, presenting irregular shapes with low contrast and are relatively homogenous compared to other lesions. Note: in white light images, the ring around the image is the distal attachment cap commonly used in colonoscopy to facilitate observation and maintain a clear field of view.
Deep learning classification
After ROI cropping, we analyzed a total of 11,351 images, combining 7,250 in vivo images (Table 1) from this study and 4,101 ex vivo images acquired from five colorectal cancer tissue samples acquired within 1 h of resection using a similar catheter probe16. The ex vivo images were added to the training set only, while the in vivo cancer cases were reserved for the testing set. Examples of ROIs are presented in Supplementary Fig. 3. The ViT classifier was trained at an initial learning rate of 3e-5 for ~ 10 min on an RTX 4090 GPU. In distinguishing malignant from benign lesions, the custom ViT classifier achieved robust testing performance, with a ROC-AUC score of 0.984 (95% CI: 0.972– 0.996) and an accuracy score of 0.950 (95% CI: 0.929–0.972). Furthermore, a Cohen’s Kappa score of 0.845 (95% CI: 0.774–0.915) suggests strong agreement with gold standard histopathology.
Table 1
Lesion characteristics and number of OCT images. TA, TVA, SSP, and Cancer indicate in vivo images of the corresponding class. Cancer (ex vivo) indicates ex vivo images of adenocarcinoma acquired in Luo et al., 202116.
| No. of lesions | No. of images | No. of ROIs | |
|---|---|---|---|
| TA | 20 | 3625 | 17,303 |
| TVA | 10 | 2507 | 14,358 |
| SSP | 3 | 594 | 4877 |
| Cancer | 2 | 524 | 3167 |
| Cancer (ex vivo) | 5 | 4101 | 21,353 |
Table 2 summarizes testing results for 11 in vivo lesions from 10 subjects, stratified by histology. The means and standard deviations of the predicted probabilities of malignancy over the test cases, stratified by histology, are shown in Fig. 2a, while the ROC curve for the testing set is shown in Fig. 2b.
Table 2
The calibrated probability of malignancy predicted by our custom ViT classifier on the testing set, stratified by histology.
| Histology | Predicted probability (mean) | Predicted probability (std) | Number of ROIs |
|---|---|---|---|
| TA | 0.00869 | 0.0649 | 1005 |
| TVA | 0.0137 | 0.0640 | 613 |
| SSP | 0.00668 | 0.0664 | 205 |
| ADC | 0.679 | 0.383 | 198 |
| SCC | 0.933 | 0.201 | 320 |
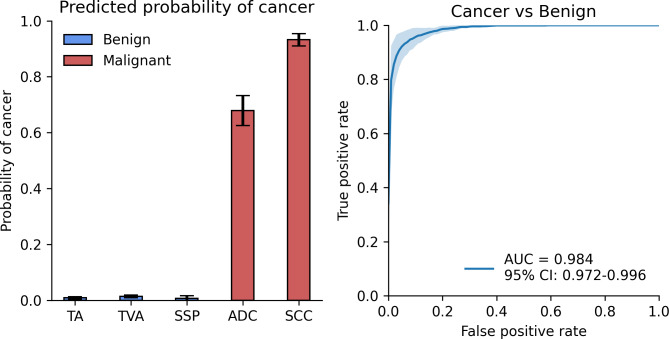
Benign vs. malignant binary classification results. (a) Predicted probability of cancer on the test set, stratified by histology type. (b) ROC curve for cancer vs. benign on the test set with AUC score of 0.984 and 95% confidence interval of 0.972–0.996.
Discussion
Our pilot study of 32 patients with large polyps undergoing OCT imaging during colonoscopy represents a step forward in the non-invasive assessment of colorectal polyps and the clinical translation of OCT. By leveraging a custom-built OCT probe and an advanced ViT classifier, we demonstrated not only OCT’s feasibility and safety but also its ability to reveal distinct subsurface structures in complex polyps in vivo. Our custom ViT classifier augmented real-time diagnostic capabilities, distinguishing benign from malignant polyps with high accuracy (AUC of 0.984, accuracy of 0.95, and Cohen’s Kappa of 0.845 when compared to histopathology). These results are a significant advance in the in vivo characterization of colorectal polyps, potentially surpassing the diagnostic capabilities of other advanced imaging techniques.
Previous investigations in OCT imaging of colorectal polyps were either ex vivo or limited their scope to basic differentiation between adenomatous and hyperplastic polyps16–19. In an ex vivo study, Wang et al.17 found that the mean scattering coefficient of colorectal polyps fell between the values for normal and malignant tissue, with adenomatous polyps having a lower scattering coefficient than inflammatory polyps. In an in vivo study of differentiating normal tissue, adenoma, and hyperplastic polyps, Pfau et al.18 found that, compared to normal tissue, adenomas tend to display less structure and lower light scattering, while hyperplastic polyps exhibit patterns and scattering properties more closely resembling those of normal tissue. Ding et al.19 used ex vivo OCT to classify inflammatory granulation tissue, hyperplastic polyps, adenomas, and cancerous tissue samples immediately after resection for rapid, non-destructive diagnosis. Further, in an ex vivo study, Luo et al.16 found that for normal colonic mucosa, OCT can discern clear layers, including the mucosa, muscularis mucosae, and submucosa, while for cancer, the structures are distorted.
Our study not only corroborates earlier studies in differentiating tissue types but also extends the in vivo application of OCT during colonoscopy to complement other optical modalities and aid clinical decision-making. Our patient study offers a nuanced comparison not only between benign and malignant tissues but also across multiple histological subtypes of adenomatous and malignant polyps. The use of a custom ViT classifier further enhances this capability, allowing real-time, high-accuracy differentiation that surpasses the diagnostic information provided by previously reported advanced imaging techniques.
Despite the clinical promise of OCT in assessing complex polyps, we readily acknowledge several challenges and limitations. First, our pilot study has a limited number of lesions and patients, specifically a low number of malignant lesions, which may introduce potential biases and limit the generalizability of our findings. However, considering that the patient population had been referred for evaluation of complex colorectal polyps, which has a known malignancy rate of 7.8%20, the relatively low rate of malignancy is not unusual. Future studies with a larger cohort would strengthen our results. Second, a primary constraint of OCT imaging is depth. OCT has a theoretical imaging depth of 1–2 mm, and although our OCT catheter achieved ~
~ 1.4 mm depth in vitro, we could only achieve
 ~
~ 800 μm in vivo. Although our OCT imaging in this study may not completely visualize the full invasion depth of thicker lesions, given that neoplasia originates in the most superficial layer, the mucosa, and invade downwards and/or laterally, OCT can at least capture high-resolution depth-wise images of the mucosal neoplasm, and as we’ve demonstrated, this imaging carries sufficient information for machine learning to differentiate malignant from benign lesions. As more patients’ data are collected, we will identify more robust imaging features from in vivo OCT scans of colorectal lesions for screening and diagnosis.
Another potential issue for the implementation of OCT widely in clinical practice is cost. OCT is a low-cost imaging modality. As an example, OCT is widely used in ophthalmology and a good commercial system can be purchased for ~ 25k USD. Overall, the OCT system would cost much less than the video endoscopy system. Furthermore, we envision every endoscopy division would only have one or a few OCT systems and be requested on a per case basis, similar to current clinical usage of endoscopic ultrasound.
In terms of improvements to our OCT system, by utilizing a high-speed light source the in vivo imaging depth of OCT can be enhanced by performing averaging and reducing motion artifacts. Additionally, with a high-speed light source, we can implement OCT angiography which can visualize blood vessels at the capillary level21. This microvascular contrast can add additional functional information to the diagnosis of malignant and benign colorectal lesions.
In summary, our study demonstrates the feasibility and safety of integrating catheter-based OCT imaging into routine colonoscopy to effectively characterize and differentiate malignant and benign polyps. Our pilot data show that endoscopic OCT should be further investigated as a diagnostic tool for use during colonoscopy. Ultimately, prospective studies evaluating clinical outcomes, such as the need for surgical resection and the success of endoscopic procedures, will best assess the utility of this technology in clinical practice.
Materials and methods
Patients and imaging
The study was approved by the institutional review board of Washington University School of Medicine, was Health Insurance Portability and Accountability Act (HIPAA) compliant, and was registered with ClinicalTrials.gov (Identifier: NCT05179837, 05/01/2022). Written informed consent was obtained from all participants, and all procedures were performed in accordance with the relevant guidelines and regulations. From July 2022 to April 2023, a total of 36 patients referred for endoscopic resection of large polyps were imaged at the Washington University School of Medicine (Saint Louis, MO). Inclusion criteria were at least 40 years of age and undergoing SoC colonoscopy for the evaluation of colonic polyps.
Patients received SoC treatment for colorectal polyps in the outpatient setting from experienced endoscopy physicians using an adult colonoscope. After the endoscopist examined the lesions with WLC and NBI, the OCT probe was inserted through the instrument channel and positioned in contact with the lesions while cross-sectional B-scans were acquired and displayed in real-time in both radial and rectangular formats. No exogenous contrast agents were used and all lesions were evaluated with the same endoscopic OCT procedure, regardless of whether they were elevated or superficial types. The time added to the SoC colonoscopy was recorded, and the imaged lesions were biopsied for histopathology analysis.
OCT catheter and system
A portable OCT system and a custom catheter probe were designed and fabricated for this study. For use with adult colonoscopes, the side-viewing OCT catheter (Fig. 3a,b) featured a 3.1 mm diameter and 2.5 m length to fit the 3.7 mm instrument channel and reach the full length of the colon. The probe head included a single-mode optical fiber, a 1 mm gradient-index (GRIN) lens (Edmund Optics, #64–529) for focusing, and an epoxy spacer, all encapsulated inside 3 layers of SAE 304 stainless steel tubes (McMaster-Carr, 8988K531, 8988K523, and 8987K522). A 0.5 mm aluminium-coated prism (Edmund Optics, #66–771) deflected the laser beam for side-view scanning. To transmit motor rotation efficiently, the optical fiber probe was enveloped within a three-layer stainless steel helical hollow strand tube with a 0.05-inch inner diameter and a 0.082-inch outer diameter (Fort Wayne Metals). The proximal end of the catheter was connected to a rotary joint (Princetel, MJXA-155-28T-004-FA), where a DC motor rotated the probe at 10 Hz via a belt-and-pulley mechanism. Single-use, sealed PTFE tubing encapsulated the probe during imaging to protect the patient and facilitate the reuse of the rotating probe.
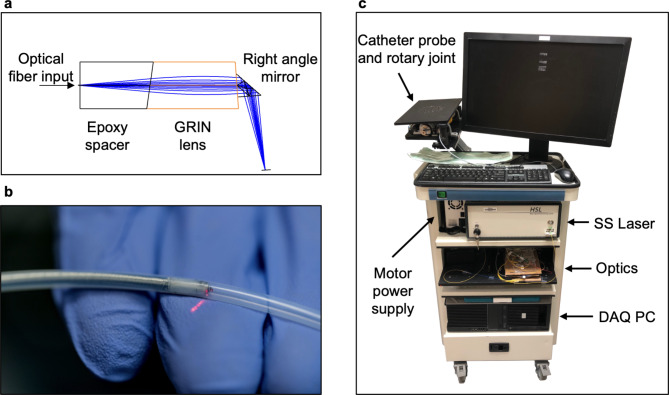
Portable endoscopic OCT imaging system. (a) Focusing assembly at the tip of the fiber optic OCT probe. The surface of the GRIN lens is polished at ~ 9 degrees. (b) Close-up photograph of the encapsulated probe tip. (c) Assembled OCT system. The laser, optical components, and PC are housed in different levels within the cart. The rotary joint and the probe are mounted on a monitor arm extending from the rear of the cart.
The portable OCT system (Fig. 3c) used a swept-source laser (Santec, HSL-2100) with a 1310 nm center frequency, 180 nm bandwidth, and 20 kHz sweep rate. The OCT signal was detected through a balanced detector (Thorlabs, PDB450C) and digitized by a high-speed data acquisition card (AlazarTech, ATS 9462) at 180 MS/s and 16-bit resolution. The system was mounted on a mobile endoscopy cart (Karl Storz, OfficeKart 9801).
OCT imaging
To achieve a target resolution of 10 μm in tissue, we acquired 2000 A-scans per B-scan. However, due to nonuniform rotational distortion (NURD) artifacts introduced by the combination of proximal rotation and the long catheter length, slight variations in the rotational period occurred between B-scans. To compensate, we acquired 2200 A-scans per B-scan, used subpixel phase correlation22 at the B-scan edge to estimate the offset, and performed bilinear interpolation to resize the image to the 2000 A-scan number. Further, between consecutive B-scans, we used phase correlation to estimate the inter-scan offset, then rotated the new image by the offset to stabilize the real-time display.
The OCT catheter had a theoretical axial resolution of ~ 6 μm and lateral resolutions of ~
 8.5 μm and ~
 11 μm in the x and y directions respectively, as measured by the edge-spread function. The imaging depth of the system was ~
 1.4 mm (Fig. 4).
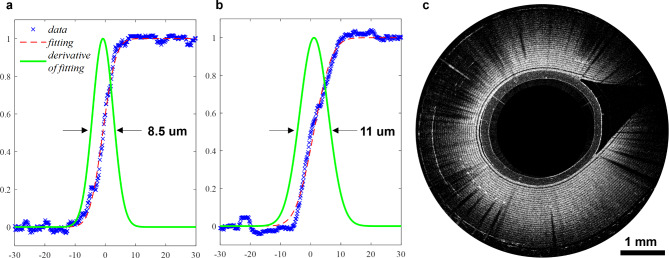
OCT system resolution and depth. (a) Lateral resolution of the OCT catheter in the x direction. (b) Lateral resolution in y direction. (c) B-scan image of a segment of Scotch™ tape wrapped around OCT probe. 28 tape layers can be discerned, corresponding to a 1.4-mm imaging depth in tape.
OCT image classification with a vision transformer
The ground truth classification label was determined through surgical pathology of the imaged lesions. The worst diagnosis for the lesion of interest was annotated on the OCT image dataset with an in-house labelling software (Supplementary Fig. 1). To streamline OCT image analysis for deep learning classification, we cropped B-scan images into 256 ×
× 256 pixel regions of interest (ROIs) along the probe surface, detected via an automated algorithm (Supplementary Fig. 2). Briefly, the algorithm binarized the image with a fixed threshold and identified the tubing surface through connected component analysis, which was smoothed using median and Gaussian filters.
We adopted a vision transformer (ViT) model for image classification, wherein images are divided into patches, encoded with positional information, and processed through a transformer encoder for extracting features and learning spatial relationships (Fig. 5a). A 2-layer multilayer perceptron (MLP) served as the classification head. Initially, the ViT backbone was frozen to focus on optimizing the MLP head during training. Due to the scarcity of in vivo cancer subjects and to more rigorously evaluate the model’s performance, we placed all the in vivo cancer cases in the testing set and the ex vivo cancer cases obtained in a previous study16 in the training set (Fig. 5b). To address class imbalance, we used weighted cross-entropy loss and standard data augmentation techniques.
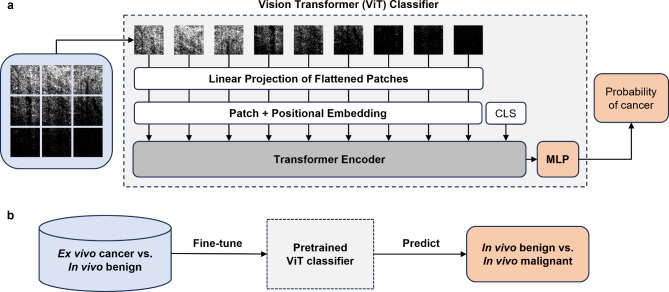
Deep learning image classification strategy. (a) ViT model architecture for transfer learning. Images are projected into patches, combined with a positional embedding, and passed through the transformer encoder for feature extraction. A special CLS token is appended to the patch embeddings as the classification token. The transformer encoder output from the CLS token is passed through the MLP classification head. The output from the MLP is converted to the predicted probability of a class with a softmax activation function. (b) Transfer learning pipeline. The ViT model pretrained on ImageNet using self-supervised learning is fine-tuned on ex vivo cancer vs. in vivo benign complex polyp data and evaluated on in vivo only data.
For our custom ViT model, hyperparameter tuning was performed to minimize weighted cross-entropy loss using the Adam optimizer, starting with pretrained ImageNet weights. For malignancy prediction, we used a sigmoid function on the MLP output, and we further calibrated the output probabilities using Platt’s logistic regression23,24. The maximum calibrated probability across ROIs was used for malignancy prediction from OCT B-scans. The model was implemented in PyTorch and trained on an RTX 4090 GPU.
Statistical analysis
Statistical analyses were performed using Python 3 and SciPy. To assess the diagnostic performance of the deep learning model, the AUC-ROC score, accuracy score, and Cohen’s kappa score were reported. The 95% confidence intervals were estimated using 3-fold cross-validation.
Electronic supplementary material
Below is the link to the electronic supplementary material.
Acknowledgements
Research in this publication was partially supported by NCI R01CA237664 and R01EB034398.
Author contributions
Author ContributionsConception and design: H. Nie, H. Luo, V. Lamm, V. Kushnir, Q. Zhu. Development of methodology: H. Nie, H. Luo, V. Lamm, S. Li, C. Zhou, Q. Zhu. Data acquisition: H. Nie, H. Luo, V. Lamm, S. Thakur, T. Hollander, D. Cho, E. Sloan, P. Navale, A. Bazarbashi, J. Reyes Genere, V. Kushnir. Analysis and interpretation of data: H. Nie, H. Luo, V. Lamm, P. Navale, Q. Zhu, Statistic Review J. Liu, Writing, review of manuscript: all authors.
Data availability
Data sets generated during the current study are available from the corresponding author on reasonable request.
Footnotes
Publisher’s note
Springer Nature remains neutral with regard to jurisdictional claims in published maps and institutional affiliations.
Haolin Nie, Hongbo Luo and Vladimir Lamm contributed equally to this work.
References
 –
– enhanced white-light colonoscopy with attention guidance predicts colorectal cancer invasion depth. Gastrointest. Endosc.94, 627–638e1 (2021).
[Abstract] [Google Scholar]
enhanced white-light colonoscopy with attention guidance predicts colorectal cancer invasion depth. Gastrointest. Endosc.94, 627–638e1 (2021).
[Abstract] [Google Scholar]Articles from Scientific Reports are provided here courtesy of Nature Publishing Group
Citations & impact
This article has not been cited yet.
Impact metrics
Alternative metrics

Discover the attention surrounding your research
https://www.altmetric.com/details/170403134
Funding
Funders who supported this work.
NIH USA (1)
Grant ID: NCI R01CA237664 and R01EB034398

 1,2,6
1,2,6

