Abstract
Objective
Hepatocellular carcinoma (HCC) is a prevalent malignancy with poor survival. Different cell types in the tumor microenvironment participate in the tumorigenesis and progression of HCC. This study aimed to analyze the immune microenvironment of HCC and its relationship with clinical outcomes.Methods
We analyzed HCC RNA-seq for cell type identification and prognosis by estimating relative subsets of RNA transcripts using CIBERSORTx. The interaction between B cells and macrophages in HCC was analyzed using a Hepa1-6 orthotopic transplantation mouse model and flow cytometry. The effect of Zinc finger protein 296 (ZNF296) on the interaction of B cells and macrophages was verified using human HCC tissues analyzed through western blot, quantitative real-time polymerase chain reaction (qPCR), and multiplex immunofluorescence. A comparative analysis of immune cells associated with HCC prognosis was performed using RNA-seq data from The Cancer Genome Atlas (TCGA), bulk multimodal data, and single-cell transcriptomic data from existing HCC single-cell transcriptomic data employing the Single Cell Inferred Site Specific Omics Resource for Tumor Microenvironments (SCISSOR).Results
Liver hepatocellular carcinoma (LIHC) RNA-seq analysis of TCGA showed that high eosinophil infiltration promoted HCC progression. The proportion of B cells correlated with that of macrophages (r=-0.24) and affected the infiltration and programmed death ligand 1 (PD-L1) expression of macrophages in HCC. ZNF296 may participate in the interaction between B cells and macrophages to accelerate the HCC progression by regulating PAFAH1B3 and H2AFX. Moreover, ZNF296 expression positively correlated with LAG3 (r=0.27) and CTLA4 (r=0.31) expression levels. Among the immune cell phenotypes related to survival and death identified by SCISSOR analysis, T cells correlated with an excellent prognosis of HCC. The normal function of liver and dendritic cells was also associated with a good prognosis in HCC.Conclusions
This study analyzed the interaction of the immune microenvironment with HCC prognosis, identifying ZNF296 as a promising diagnostic and therapeutic target for HCC.Free full text

Zinc finger protein 296 promotes hepatocellular carcinoma progression via intervening interaction between macrophages and B cells
Associated Data
Abstract
Objective
Hepatocellular carcinoma (HCC) is a prevalent malignancy with poor survival. Different cell types in the tumor microenvironment participate in the tumorigenesis and progression of HCC. This study aimed to analyze the immune microenvironment of HCC and its relationship with clinical outcomes.
Methods
We analyzed HCC RNA-seq for cell type identification and prognosis by estimating relative subsets of RNA transcripts using CIBERSORTx. The interaction between B cells and macrophages in HCC was analyzed using a Hepa1-6 orthotopic transplantation mouse model and flow cytometry. The effect of Zinc finger protein 296 (ZNF296) on the interaction of B cells and macrophages was verified using human HCC tissues analyzed through western blot, quantitative real-time polymerase chain reaction (qPCR), and multiplex immunofluorescence. A comparative analysis of immune cells associated with HCC prognosis was performed using RNA-seq data from The Cancer Genome Atlas (TCGA), bulk multimodal data, and single-cell transcriptomic data from existing HCC single-cell transcriptomic data employing the Single Cell Inferred Site Specific Omics Resource for Tumor Microenvironments (SCISSOR).
Results
Liver hepatocellular carcinoma (LIHC) RNA-seq analysis of TCGA showed that high eosinophil infiltration promoted HCC progression. The proportion of B cells correlated with that of macrophages (r=−0.24) and affected the infiltration and programmed death ligand 1 (PD-L1) expression of macrophages in HCC. ZNF296 may participate in the interaction between B cells and macrophages to accelerate the HCC progression by regulating PAFAH1B3 and H2AFX. Moreover, ZNF296 expression positively correlated with LAG3 (r=0.27) and CTLA4 (r=0.31) expression levels. Among the immune cell phenotypes related to survival and death identified by SCISSOR analysis, T cells correlated with an excellent prognosis of HCC. The normal function of liver and dendritic cells was also associated with a good prognosis in HCC.
Conclusions
This study analyzed the interaction of the immune microenvironment with HCC prognosis, identifying ZNF296 as a promising diagnostic and therapeutic target for HCC.
Introduction
Hepatocellular carcinoma (HCC) is the fifth most diagnosed cancer and third leading cause of cancer-related mortality worldwide (1,2). The prognosis of HCC is poor and represents a major global healthcare challenge. To improve the outcomes of patients with HCC, it is essential to decipher how key clinical and molecular characteristics influence disease course and treatment response (3). Therefore, robust tools for prognostic prediction and therapeutic response assessment in patients with HCC are urgently needed.
Cancer immunotherapy leverages the body’s immune response against tumors to identify and eradicate cancer cells by stimulating the host immune system (4). Immune checkpoint inhibitors, including nivolumab and pembrolizumab, hampered the programmed death 1/programmed death ligand 1 (PD-1/PD-L1) pathway, marking a significant advancement in immunotherapy for HCC (5). Nonetheless, only a small fraction of patients with cancer benefit from immune checkpoint inhibitors (6). Although immunotherapy for HCC is promising, it poses unique challenges owing to the distinct immunological environment and diversity of immune cells in the liver (7). These cells can either augment or inhibit the anticancer immune response and may either contribute to or hinder cancer immunotherapy.
Therefore, it is essential to analyze the immune microenvironment of HCC to improve its prognosis. Thus, CIBERSORTx, a popular tumor-infiltrating immune cells (TIICs) prediction method, was used in this study to analyze the immune microenvironment of HCC (8,9). SCISSCOR, a method that identifies cell subpopulations from single-cell data, was performed to further investigate the correlation of TIICs and HCC prognosis (10). In the present study, we used two algorithms to determine the immune landscape of HCC and its association with prognosis to provide the basis for improving the diagnosis and treatment of HCC through immunotherapy.
Materials and methods
Cell-type identification by estimating relative subsets of RNA transcripts (CIBERSORTx)
HCC RNA-seq data were downloaded from The Cancer Genome Atlas (TCGA) database. The proportions of the 22 TIICs from each sample were determined using the CIBERSORTx (11), which analyzed the relative expression levels of 547 genes in individual tissue samples according to their gene expression profiles (GEPs) to predict the proportion of 22 types of TIICs in each tissue, namely: naive B (Bn) cells, memory B (Bm) cells, plasma, CD8+ T cells, naive CD4+ T (CD4+ Tn) cells, CD4+ resting memory T (CD4+ Tmr) cells, CD4+ memory-activated T (CD4+ Tma) cells, T-follicular helper (Tfh) cells, regulatory T cells (Tregs), γδT cells, resting natural killer (NKr) cells, activated natural killer (NKa) cells, monocytes, M0 macrophages (M0), M1 macrophages (M1), M2 macrophages (M2), resting dendritic cells (DCr), activated dendritic cells (DCa), resting mast cells (Mr), activated mast cells (Ma), eosinophils, and neutrophils. Normalized liver hepatocellular carcinoma (LIHC) GEPs were transformed into the proportion of 22 TIICs. The relative expression levels of the 22 TIICs in each sample were determined. Significant results (P<0.05) were selected for subsequent analysis.
Single-cell identification of subpopulations with bulk sample phenotype correlation (SCISSOR)
The proportions of each cluster from each sample were determined using the SCISSOR R package (V4.1.2; R Core Team 2021, https://github.com/sunduanchen/Scissor). HCC RNA-seq data were downloaded from the TCGA database. Human HCC single-cell sequence data (GSE151530) were downloaded from the Gene Expression Omnibus (GEO) database, and the three-input data for Scissor were the single-cell expression matrix, batch expression matrix, and target phenotype. The correlation matrix and cell-cell similarity network were then calculated according to the input source, and their phenotypes were further integrated into the network regularization sparse regression model to select the most relevant cell subsets. According to the estimated sign of the regression coefficient, the cells were divided into scissor-positive (Scissor+) and scissor-negative (Scissor−) cells, indicating a positive and negative correlation with the target phenotype, respectively. Subsequently, significance reliability testing was conducted to determine whether the selected data were suitable for phenotypic cell associations. Finally, cells selected using scissors were further characterized by downstream analysis.
Cell culture
Hepa1-6 cells were purchased from the American Type Culture Collection (ATCC) authenticated by short tandem repeat (STR) profiling and tested for Mycoplasma contamination before the experiments. Hepa1-6 cells were cultured in Dulbecco’s Modified Eagle medium supplemented with 10% foetal bovine serum (FBS), 100 IU/mL penicillin, and 100 μg/mL streptomycin at 37 °C under a humidified 5% CO2 atmosphere.
Animal experiments and ethics statement
Six-to-eight-week-old C57BL/6 mice were purchased from Hangzhou Medical College (Hangzhou, China). All the mice were male. All animal experiments were performed in accordance with the Institutional Animal Care and Use Committee of the Zhejiang Center of Laboratory Animals (No: ZJCLA-IACUC-20020166). A total of 25 μL mixture of PBS and matrigel (Corning, New York, USA) (1:1) containing 5×10⁵ Hepa1-6 cells were injected into the left liver lobe of C57BL/6 mice to establish the HCC orthotopic model. For inhibitors experiments, mice were intraperitoneally injected with CD20 antibody (100 μg/each, BP0356, Bio X Cell, New Hampshire, USA) or clodronate liposomes (CL) (200 μL/each, 40337ES, Yeasen, Shanghai, China) every other day.
Mouse tissue-derived lymphocytes isolation
Liver tissues were excised from HCC orthotopic model mice. Liver-derived lymphocytes were isolated from the HCC tissues using collagenase II/IV (Solarbio, Beijing, China) and Lymphocyte Separation Medium (Dakewe Biotech, Shenzhen, China).
Flow cytometric analysis
For cytometric analysis, nonspecific binding of the cells was blocked using an Fc receptor block (clone 2.4G2, BD Biosciences, New Jersey, USA). The cells were stained with surface antigen-antibodies for 30 min at 4 °C, after incubated with Fc receptor block for 10 min at 4 °C. After washing twice with PBS, the cells were analyzed using a BD FACS Canto II. The data were analyzed using FlowJo X software (Version 10.8; Tree Star, https://www.flowjo.com/solutions/flowjo/downloads). The following antigens were used: CD20 (152108, BioLegend, California, USA), FVS780 (565388, BD), CD45 (147710, BioLegend), PD-L1 (124334, BioLegend), F4/80 (157303, BioLegend), and CD206 (141734, BioLegend).
Human sample and ethics statement
Patient-derived HCC tissues were collected from patients who underwent hepatic surgery between September 2021 and June 2022. Human samples were collected under the supervision of the ethics committee of Hangzhou First People’s Hospital (No. 2024-022) and adhered to the principles of the Declaration of Helsinki. All participants signed an informed consent form.
Western blot
After harvesting, HCC and normal tissues were lysed using a cell lysis buffer (9803, Cell Signaling Technology, Boston, USA). The supernatant was taken after 12,000 r/min centrifugation for 15 min (BECKMAN COULTER Microfuge 20R Centrifuge, USA). After measuring the protein concentration using a BCA kit (P0010, Beyotime, Shanghai, China), 5× loading buffer was added, and the mixture was boiled for 10 min 95 °C, ran through 4%−20% sodium dodecyl sulfate-polyacrylamide gel, and transferred onto polyvinylidene fluoride (PVDF) membranes (Millipore, Massachusetts, USA). The membranes were incubated with indicated primary antibodies at 4 °C overnight, washed three times with TBST buffer (1× TBS, 0.05% V/V TWEEN 20) for a total of 30 min, and incubated with secondary antibodies (1:2,000) for 1 h at room temperature. After washed three times with TBST buffer (1× TBS, 0.05% V/V TWEEN 20) for 30 min, the signal was detected using an ECL kit (Pierce). The primary antibodies used were anti-GAPDH (1:1,000, ab213480; Abcam, Cambridge, UK) and anti-Zinc finger protein 296 (anti-ZNF296) (1:1,000, PA5-69042; Invitrogen, California, USA).
RNA isolation and quantitative real-time polymerase chain reaction (qPCR) analysis
Total RNA from HCC tissues was extracted using TRIzol reagent (Invitrogen). Reverse transcription of RNA and qPCR were performed using Prime ScriptTM Trimester Mix (Takara, Bio, Shiga Prefecture, Japan) and SYBR Premix Ex TaqTM11 (Yeasen, Shanghai, China) with a StepOnePlus qPCR system (Life Technologies, California, USA), according to the manufacturer’s instructions. GAPDH was used as an endogenous control. Primers for qPCR were synthesized by Tsingke Biotech (Beijing, China). The following primer sequences were used: ZNF296 forward primer, ACCCCGAACTATCCCGACC, and ZNF296 reverse primer, AGGCAGTGATGGCCTCCAA. GAPDH forward primer, GGAGCGAGATCCCTCCAAAAT; GAPDH reverse primer, GGCTGTTGTCATACTTCTCATGG.
Multiplex immunofluorescence
The multiplex immunofluorescence assay was performed as follows: after heating, antigen retrieval, and rinsing, the slides were incubated with 3% hydrogen peroxide to remove endogenous peroxidase. After multiplex staining, signal amplification, and fluorescence signal capture, the slides were placed in a microwave oven to remove the antibody complex. A second round of multiplex staining was performed. Finally, DAPI staining and image acquisition were performed using Pannoramic MIDI. The primary antibodies used were anti-CD20 (1:1,000, GB14030, Servicebio, Wuhan, China), anti-CD68 (1:200, GB113150, Servicebio), anti-E cadherin (Ecad, 1:200, GB12083, Servicebio), and 4’,6-diamidino-2-phenylindole (DAPI) (G1012, Servicebio).
Statistics analysis
Data were analyzed using GraphPad Prism 9.0 (GraphPad Software Inc., La Jolla, USA) and expressed as 
Results
Higher infiltration of eosinophil cells is correlated with a worse prognosis of HCC in tumor microenvironment (TME)
To analyze the tumor immune microenvironment of HCC, we used CIBERSORTx to evaluate the infiltration of immune cells. As shown in Figure 1A, M2 macrophages and resting CD4 memory T and CD8+ T cells were highly infiltrated in TME compared with other cells. The other immune cells exhibited low levels of infiltration. Immune contribution to the survival hazard ratio showed that the infiltration of CD8+ T cells was a protective factor, and the infiltration of M2 macrophages was a risk factor (Figure 1B). The immune contribution to the disease process indicates that the infiltration of Bm, CD8+ T, and CD4+ T cells was protective factors. Still, the infiltration of M0 macrophages was a risk factor (Figure 1C), probably because they were prone to differentiate into M2 macrophages in HCC (12). The correlation analysis of 22 types of immune cells infiltrating in LIHC showed that the infiltration of Bn cells was negatively correlated with the infiltration of M0 macrophage (r=−0.24), monocytes (r=−0.26), and mast cells (r=−0.26) (Figure 1D). The infiltration of CD8+ T cells was positively correlated with the infiltration of activated memory CD4+ T cells (r=0.33) and Tfh cells (r=0.26) and negatively correlated with NKr cells (r=−0.27). TCGA database analysis indicated that patients with HCC with a higher infiltration of CD8+ T cells had a relatively prolonged overall survival (OS) (P=0.006) (Figure 1E). In comparison, patients with HCC and lower eosinophil infiltration had a somewhat longer OS (P=0.015) (Figure 1F). These results indicate that CD8+ T cells are essential for the prognosis of HCC, and that B cells may play a crucial role in HCC.
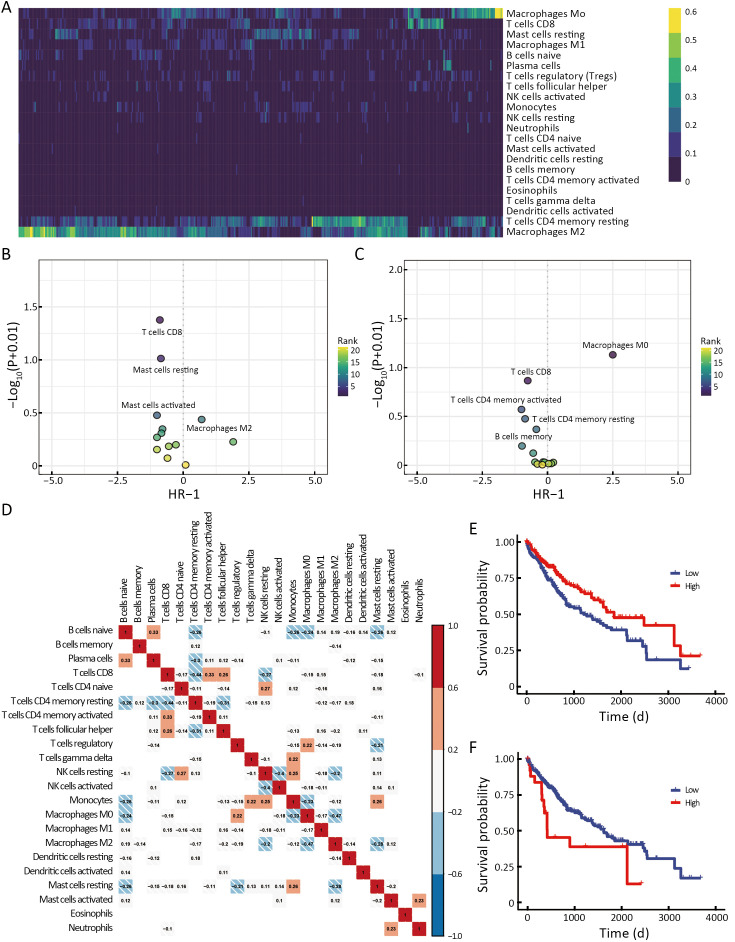
High infiltration of eosinophils is associated with poor prognosis of HCC. (A) Heatmap showing the CIBERSORT immune score for all TCGA-LIHC patients of 22 immune cell subsets; (B,C) Dot plot of the immune contribution to the survival hazard ratio (B) and the disease process (C); (D) Correlation of 22 types of immune cells in LIHC. Red, positive correlation; blue, negative correlation; (E,F) Kaplan-Meier analysis from the TCGA database of OS for patients with high or low infiltration of CD8+ T cells (P=0.006) (E) and eosinophils (P=0.015) (F). HCC, hepatocellular carcinoma; LIHC, liver hepatocellular carcinoma; TCGA, The Cancer Genome Atlas; OS, overall survival.
Interaction of B cells and macrophages affects HCC progression
To further investigate the correlation between B cells and macrophages in HCC progression, we first constructed a Hepa1-6-Luc orthotopic transplantation mouse HCC model (Luc-HCC). We evaluated the effect of CL, a specific inhibitor for the depletion of macrophages, and the effect of a CD20 antibody, a specific antibody for the depletion of CD20+ B cells. CL treatment did not affect tumor progression or extend the survival of HCC mouse models (Figure 2A,BB) (13). Unexpectedly, CD20 antibody treatment accelerated tumor progression and shortened the survival of HCC mouse models (P<0.05) (Figure 2C,DD). Notably, the depletion of CD20+ cells promoted the infiltration of macrophages and the expression of PD-L1 in macrophages under gating in flow cytometry (P<0.05) but did not promote their differentiation into M2 macrophages (Figure 2E−G, Supplementary Figure S1). Overall, these results indicate that B cells suppress the expression of PD-L1 in macrophages and inhibit HCC progression.
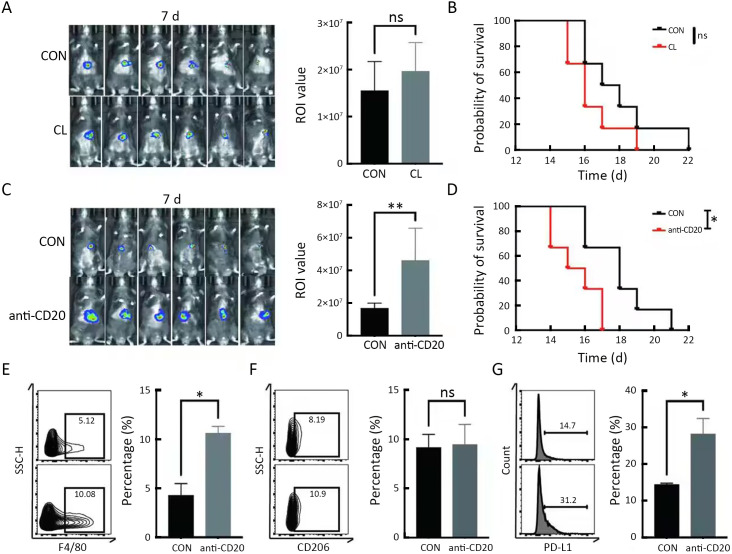
Deletion of B cells increases the expression of PD-L1 in macrophages. (A,B) Luc reporter-carrying Hepa1-6 HCC cell line orthotopic transplantation mouse models were constructed, and CL was injected every 3 d. In vivo imaging was performed on 7 d (A) as well as during the survival analysis (B); (C,D) Luc reporter-carrying Hepa1-6 HCC cell line orthotopic transplantation mouse models were constructed, and CD20 antibody was intraperitoneally injected every 3 d. In vivo imaging was performed on 7 d (C) as well as during the survival analysis (D); (E) Percentages of F4/80+ cells in CD45+ cells were detected by flow cytometry in tumor-infiltrating immune cells; (F,G) Percentages of CD206+ (F) and PD-L1+ (G) cells were detected by flow cytometry in F4/80+ cells isolated from mouse HCC tissues. PD-L1, programmed death ligand 1; HCC, hepatocellular carcinoma; CL, clodronate liposomes. *, P<0.05; **, P<0.01; ns, no significant.
ZNF296 intervenes interaction of B cells and macrophages to promote HCC progression
To explore the different immune response clusters in patients with HCC, they were divided into nine clusters of immune responses via CIBERSORTx analysis (Figure 3A). The OS of patients with HCC in cluster 2 was the worst, while that of patients in cluster 7 was the best (Figure 3B). We investigated the possible reasons for the differences in OS by analyzing the infiltration of different immune cells in HCC. As shown in Supplementary Figure S2A, for cluster 2 and 6, M0 and M2 macrophages were highly infiltrated, which is correlated with HCC progression (14). M1 macrophages were more abundant and M0 macrophages showed lower infiltration in luster 7 than those in lusters 2 and 6 (15). Clusters 2 and 6 were mainly at stages T3/T4 of HCC, and cluster 7 was mainly at an early stage of HCC (Supplementary Figure S2B). Transcription factors (TFs) enrichment analysis showed that ZNF296 was enriched in clusters 2 and 6, but not in cluster 7 (Figure 3C). Compared with other tumors, ZNF296 was highly correlated with immune subtypes in LIHC (Supplementary Figure S3A). Patients with high ZNF296 expression had poor prognosis and were associated with the stage of LIHC (Supplementary Figure S3B,C). We detected the protein ZNF296 in HCC and adjacent normal human tissues by western blot. ZNF296 was more highly expressed in HCC tissues than that in normal tissues (P<0.01) (Figure 3D). We used qPCR to distinguish the expression of different HCC tissues and performed multiplex immunofluorescence between ZNF296 high-expression HCC and ZNF296 low-expression HCC (Figure 3E). Using multiplex immunofluorescence, we found that the interaction between B cells and macrophages was significantly higher in ZNF296 low-expression HCC tissues compared with ZNF296 high-expression HCC tissues (P<0.0001) (Figure 3F,GG). Correlation analysis revealed that the upregulation of ZNF296 expression was closely related to the upregulation of PAFAH1B3 and H2AFX (Supplementary Figure S3D). PAFAH1B3 is a platelet-activating factor acetyl hydrolase (PAF-AH), which is involved in glycolysis and lipid synthesis signaling pathway of HCC progress (16). In addition, histone H2AFX is highly correlated with immune cell infiltration by tumor-associated macrophages (TAMs), and neutrophils, which may promote HCC (17). Moreover, the downregulation of ZNF296 expression was closely related to the upregulation of MPDZ and ALDH6A1, which might suppress HCC progression (Supplementary Figure S3E) (18,19). In addition, correlation analysis indicated that the expression of lymphocyte-activation gene 3 (LAG3) (r=0.27) and cytotoxic T-lymphocyte associated antigen 4 (CTLA4) (r=0.31) was also related to the expression of ZNF296 (Supplementary Figure S4), which might be a potential target for patients with HCC and high expression of ZNF296 (20). Moreover, the small neutral L- and D-amino acid translocator SLC7A10 was highly expressed in cluster 2, whereas the pH regulator SLC9A11 was mainly enriched in cluster 7, indicating that clusters 2 and 7 may have differential biological activities (Supplementary Figure S2C). All in all, these results suggest that ZNF296 intervenes the interaction of B cells and macrophages to promote HCC progression.
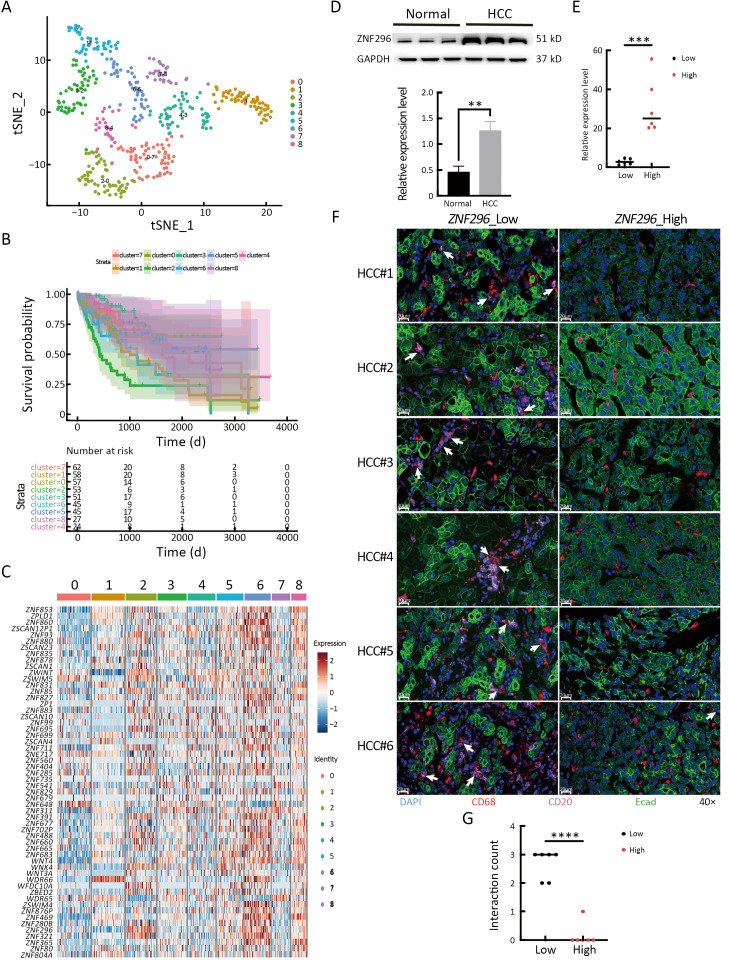
High expression of ZNF296 promotes the progression of HCC by intervening interaction between macrophages and B cells. (A) t-SNE plot shows 9 immune infiltration subtypes of LIHC; (B) Kaplan-Meier analysis of OS for 9 immune infiltration subtypes of LIHC; (C) Transcription factors heatmap of 9 immune infiltration subtypes of LIHC; (D) ZNF296 and GAPDH protein level were detected using western blot of HCC and adjacent normal tissue. The protein was normalized to GAPDH expression levels (n=3/3); (E) mRNA expression levels of ZNF296 and GAPDH were examined through qPCR analysis of HCC tissues with high and low expression of ZNF296 (n=6/6). The genes were normalized to GAPDH mRNA levels in each sample; (F) Multiplex immunofluorescence of Ecad+ (HCC cells), CD68+ (macrophages) and CD20+ cells (B cells) are shown for HCC tissues with high and low expression of ZNF296 (n=6/6); (G) Interaction counts of macrophages and B cells in ZNF296 high-expression HCC and ZNF296 low-expression HCC were shown. HCC, hepatocellular carcinoma; t-SNE, t-distributed stochastic neighbor embedding; LIHC, liver hepatocellular carcinoma; OS, overall survival; qPCR, quantitative real-time polymerase chain reaction. **, P<0.01; ***, P<0.001; ****, P<0.0001 .
Immune analysis of infiltrated immune cells in HCC by SCISSOR
To mine the prognostic information correlated with infiltrated immune cells in HCC, we performed SCISSOR analysis by combining HCC scRNA-seq and TCGA bulk RNA-seq (21) (Figure 4A). As shown in Figure 4B, 18 cell subsets were observed, including CD8+ T cells, CD4+ T cells, DCs, endothelial cells, neutrophils, liver cells, and myeloid cells (Figure 4B). Furthermore, dead and survival phenotype-associated cells were distributed across cell subsets (Figure 4C). Two types of T cells (T1 and T2), myeloid, and liver cells, were associated with the survival phenotype, whereas two types of DCs (DC1 and DC2) were associated with the dead phenotype (Figure 4D). Differential gene enrichment analysis indicated that GZMK, GZMA, KLRB1, and NKG7 were enriched in T1; HLA-DRA/DRB1/DPB1 and CXCL8 were enriched in T2; cathepsin B (CTSB) was explicitly expressed in DC2 (Figure 4E). Differentially expressed genes (DEGs) analysis suggested that T1 is activated cytotoxic T lymphocytes (CTLs) and T2 is migrated T effector cells (Teff), and these T cell subsets are related to a better prognosis. However, CTSB+ DC2 is associated with worse prognosis, which may contribute to CTSB-promoting cancer metastasis (22).
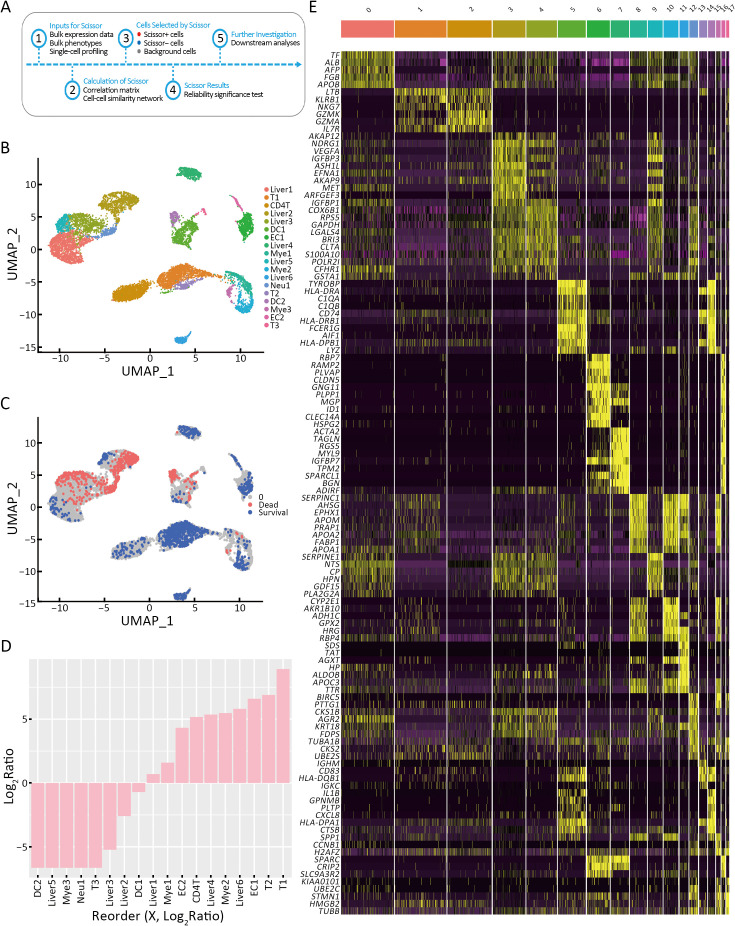
T cells are related to survival of patients with HCC. (A) Flow diagram of the analysis process of SCISSOR; (B) UMAP visualization of 10,000 cells in HCC; (C) UMAP visualization of scissor-selected cells. The red and blue dots are dead phenotype cells (bad survival) and survival phenotype cells (good survival); (D) Bar chart shows the cell ratio of 18 cell clusters in LIHC; (E) Heatmap of the top ten gene expression of 18 cell clusters in LIHC. HCC, hepatocellular carcinoma; UMAP, uniform manifold approximation and projection; LIHC, liver hepatocellular carcinoma; T, CD8+ T cell; CD4T, CD4+ T cell; DC, dendritic cell; EC, endothelial cell; Neu, neutrophil; Liver, liver cell; Mye, myeloid cell.
DEGs analysis by survival phenotype-associated cells and dead phenotype-associated cells
Compared to the dead phenotype-associated cell subsets, the survival phenotype-associated cells had 42 significant DEGs (21 upregulated and 21 downregulated) (Figure 5A). As shown in Figure 5B, immunoglobulin kappa C (IGKC), which was highly expressed in survival phenotype-associated cells, was highly expressed in normal tissues compared to tumor tissues (P<0.05) (Figure 5B). Growth differentiation factor 15 (GDF15), which was highly expressed in dead phenotype-associated cells, was highly expressed in tumor tissues compared to that in normal tissues (P<0.05) (Figure 5C). TCGA database analysis indicated that patients with HCC with higher CD69 expression had relatively longer OS (Log-rank P=0.037) (Figure 5D). In comparison, patients with HCC and lower BRI3 and NDRG1 had relatively more prolonged OS (Log-rank P=0.026 and P=0.015) (Figure 5E,FF). CD69 is a type 2 transmembrane protein that is rapidly expressed on the surface of T lymphocytes after T cell receptor (TCR)/CD3 conjugation to activate cytokines and stimulate polyclonal mitosis. CD69 expression significantly and positively correlated with T cells. The increased expression of CD69 may change the immunosuppressed TME into an immune state with a better prognosis, which may explain why patients with HCC and high CD69 expression had a better prognosis (23,24). In addition, recent research has shown that BRI3 is identified as a new downstream target of the Wnt/β-catenin signaling, which may be related to the poorer prognosis of HCC. NDRG1 regulates the expression of genes related to transmembrane transporter activity, immune response, cell adhesion, and cell proliferation. NDRG1 is associated with HCC metastasis and promotes EpCAM protein stability to enhance the cancer stem cell characteristics of HCC (25). Differential gene expression analysis of the immune cell subtypes was performed to identify the differential genes of survival and dead phenotype-associated cells. Compared with the slow phenotype associated with liver 1 cells, the survival phenotype related to liver 1 cells had 49 significantly differential genes (35 upregulated and 14 downregulated DEGs) (Supplementary Figure S5A). Compared to the dead phenotype associated with liver 2 cells, the survival phenotype associated with liver 2 cells had 45 significantly DEGs (24 upregulated and 21 downregulated DEGs) (Supplementary Figure S5B). ALB, HGF, APOE, and APOC were highly expressed in liver 1 and 2 cells. The survival phenotypes associated with liver cell protein synthesis, lipid metabolism, and hepatocyte proliferation were normal. Compared with the dead-associated phenotype of DC1 cells, the survival phenotype associated with DC1 cells had 31 significantly DEGs (12 upregulated and 19 downregulated DEGs) (Supplementary Figure S5C). Among the survival phenotypes associated with DC1 cell genes, antigen presentation is highly expressed, which indicates normal antitumor function of DC and a better prognosis (26). TFs enrichment analysis showed that KLF6 and BATF related to T-cell activation were enriched in T1 cells, indicating that T1 cells play a positive role in antitumor activity (Supplementary Figure S5D) (27,28).
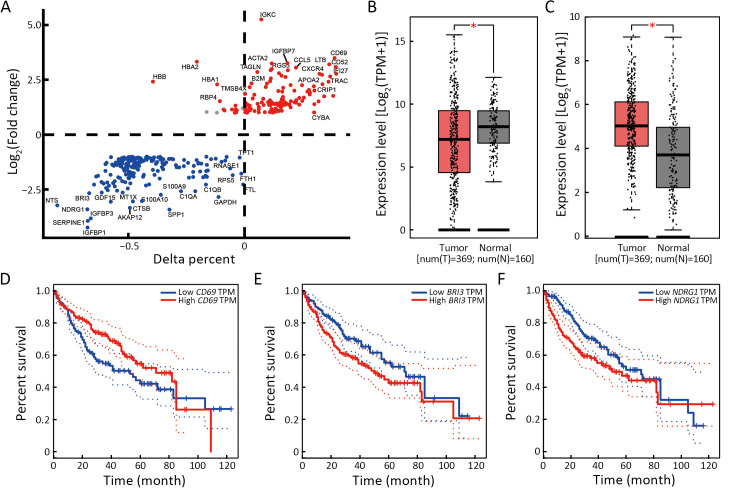
High expression of CD69 in T cell infiltrating HCC is a critical survival factor. (A) Differential expression was performed to identify genes enriched in survival phenotype cells. For each subtype, the average Log (Fold change) and the percentage of cells that express the gene above the background are compared between the 2 clusters; (B,C) Box plot of IGKC (B) and GDF15 (C) expression in HCC tumors and the adjacent tissues in TCGA database; (D−F) Kaplan-Meier analysis from TCGA database of OS for patients with high or low expression of CD69 (Log-rank P=0.037) (D), BRI3 (Log-rank P=0.026) (E), and NDRG1 (Log-rank P=0.015) (F). HCC, hepatocellular carcinoma; IGKC, immunoglobulin kappa constant; GDF15, growth differentiation factor-15; TCGA, The Cancer Genome Atlas; OS, overall survival; BRI3, brain protein I3; NDRG1, N-myc downstream regulated gene 1; TPM, transcripts per million; HR, hazard ratio. *, P<0.05.
Discussion
HCC is a highly heterogeneous and malignant tumor. Although progress has been made in therapeutic strategies, the prognosis of HCC can be improved, especially in patients with advanced disease. Recently, an increasing number of studies have reported that the TME is highly related to the prognosis and treatment resistance of tumor patients (29). Thus, clarifying the underlying mechanisms by which the TME affects HCC resistance to therapy is essential for improving therapeutic efficacy.
In the present study, we analyzed the HCC microenvironment via CIBERSORT analysis using TCGA database. We found that M2 macrophages were the most highly infiltrating in HCC, which is a risk factor for the OS of patients with HCC. In addition, M0 macrophages are a risk factor for HCC, possibly because they M0 macrophage tending to differentiate into M2 macrophages in the HCC microenvironment (30). CD8+ T cells are protective factors for OS and HCC progression. Interestingly, we found that Bm cells were protective against HCC, and naïve B cells were negatively correlated with M0 macrophages and monocytes.
Furthermore, we found, for the first time, that B cell depletion accelerates the development of HCC in mice. Simultaneously, B cell depletion did not promote macrophage polarization into the M2 macrophages but increased PD-L1 expression on macrophages. This is consistent with other studies showing that PD-L1 expression in myeloid cells promotes HCC progression (31). Research indicates that B lymphocytes play multiple roles in human cancer and suggests that humoral immunity could be harnessed for B cell-targeted immunotherapy (32,33). A study also showed that tumor neoantigens can regulate the fate of tumor-specific CD4+ T cells by facilitating their interactions with tumor-specific B cells, which in turn promotes antitumor immunity by enhancing CD8+ T cell effector functions (34). However, the specific mechanism by which B cells affect PD-L1 expression in macrophages has yet to be thoroughly explored. The interactions between B cells and other immune cells that influence the development of HCC or other cancers should be further explored. Subsequently, we subgrouped the different immune cells based on their response types and identified higher infiltration of M0 and M2 macrophages in the population with poor prognosis. Based on this, we compared clusters 2 and 6 with cluster 7 and found that ZNF296 was highly associated with the immune subtypes of HCC. This finding suggests the possibility of predicting the prognosis of HCC immunotherapy. We preliminarily verified that high ZNF296 expression affects the interaction between B cells and macrophages. Correlation analysis showed that ZNF296 might intervene in the interaction between B cells and macrophages by upregulating H2AFX expression. At the same time, we found that high expression of ZNF296 was closely related to increased expression of the immune checkpoints CLTA4 and LAG3. All evidence indicates that ZNF296 is closely associated with the effectiveness of immunotherapy for HCC. Thus, the critical transcription factor ZNF296 may be a promising target for HCC treatment. However, the therapeutic potential of ZNF296 remains to be verified.
Next, we used the SCISSOR algorithm to compare RNA-seq using the TCGA database and single-cell data from existing data. For the first time, we explored the association between immune cell infiltration and HCC prognosis. T-cell infiltration demonstrated a better prediction of HCC, whereas infiltration of myeloid cells and neutrophils was associated with a poorer prognosis. By comparison, we found that some exciting genes such as IGKC, a protein related to B cells and plasma cells, were expressed at lower levels in HCC and correlated with better prognosis. However, there are currently no relevant studies focusing on this gene. In addition, molecules such as CD69, BRI3, and NDRG1 are closely associated with the prognosis of liver cancer. However, our study mainly focused on analyzing gene transcription with little verifying protein expression. Next, we conducted a similar analysis of the relevant cell subpopulations. Those with normal hepatocyte function were mainly associated with a good prognosis, whereas those with glucose and lipid metabolism disorders had a significantly poorer prognosis. The predicted survival of patients with HCC also showed a strong correlation with antigen-presenting genes among DC. However, our analysis still requires a dynamic communication process and transformation between the cell subpopulations. In addition, the results of the study were mainly obtained through bioinformatics analysis and required verification using more clinical samples.
Conclusions
Our study shed light on the intricate interplay between the immune microenvironment and HCC prognosis, thereby revealing that ZNF296 is a novel diagnostic and therapeutic target for HCC. Maintaining the normal function of DC and liver cells is key to prolonging the prognosis of HCC.
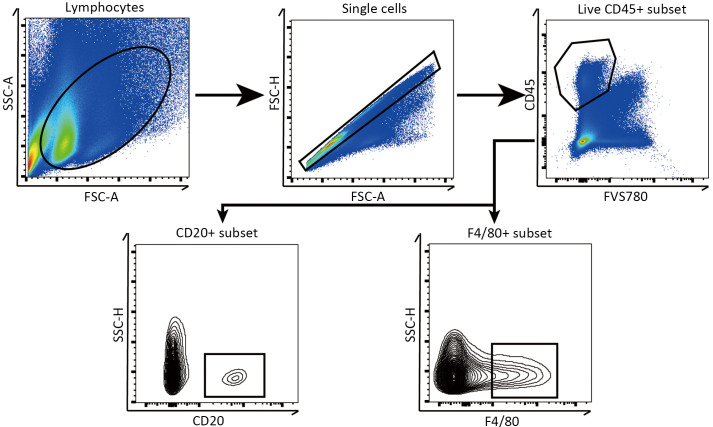
Gating of flow cytometry analysis for HCC. Diagram showing the application of gating for flow cytometry. SSC-A, side scatter area; FSC-A, forward scatter area; FSC-H, forward scatter height; SSC-H, side scatter height.
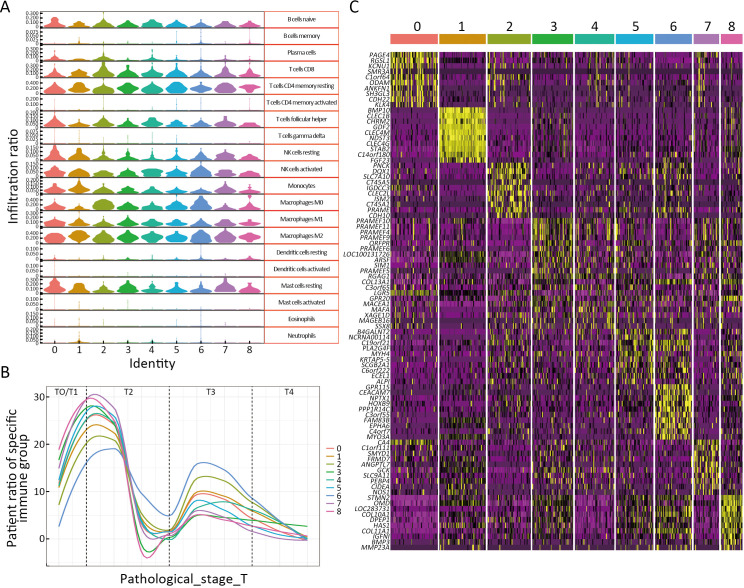
High expression of ZNF296 promotes progression of HCC. (A) Violin plot shows 20 immune cell infiltration ratios for the nine immune infiltration subtypes of LIHC; (B) Pathological stages of nine LIHC immune infiltration subtypes; (C) Marker gene heatmap of nine immune infiltration subtypes of LIHC. HCC, hepatocellular carcinoma; LIHC, liver hepatocellular carcinoma.
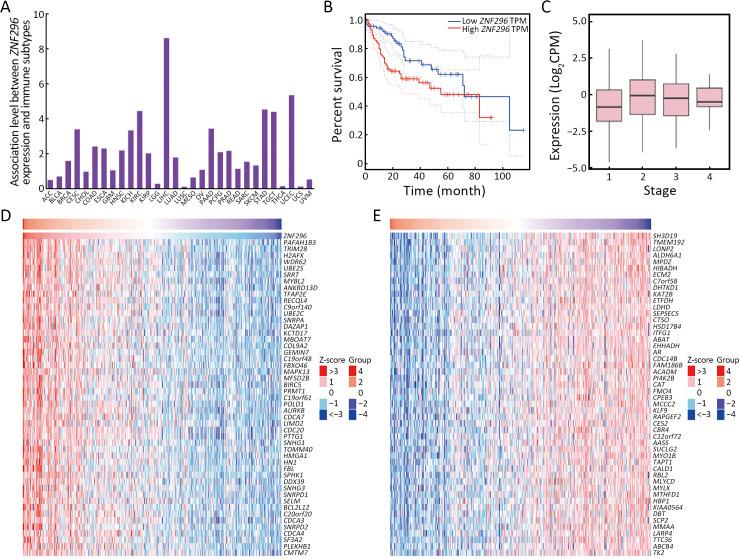
ZNF296 is the specific high-expression molecule of HCC with poor prognosis. (A) Histogram showing the association between ZNF296 expression and immune subtypes in human cancers; (B) Kaplan-Meier analysis of TCGA database of OS of patients with high or low ZNF296 expression (Log-rank P=0.023); (C) Boxplot showing the associations between the expression of ZNF296 and LIHC stage (r=0.14, P=0.007); (D,E) Heatmap after differential analysis shows the upregulated (D) and downregulated (E) genes in the high-expression samples of ZNF296. HCC, hepatocellular carcinoma; TCGA, The Cancer Genome Atlas; OS, overall survival; TPM, transcripts per million; CPM, counts per million; ACC, adrenocortical carcinoma; BLCA, bladder urothelial carcinoma; BRCA, breast invasive carcinoma; CESC, cervical squamous cell carcinoma and endocervical adenocarcinoma; CHOL, cholangiocarcinoma; COAD, colon adenocarcinoma; ESCA, esophageal carcinoma; GBM, glioblastoma multiforme; HNSC, head and neck squamous cell carcinoma; KICH, kidney chromophobe; KIRC, kidney renal clear cell carcinoma; KIRP, kidney renal papillary cell carcinoma; LGG, lower grade glioma; LIHC, liver hepatocellular carcinoma; LUAD, lung adenocarcinoma; LUSC, lung squamous cell carcinoma; MESO, mesothelioma; OV, ovarian serous cystadenocarcinoma; PAAD, pancreatic adenocarcinoma; PCPG, pheochromocytoma and paraganglioma; PRAD, prostate adenocarcinoma; READ, rectum adenocarcinoma; SARC, sarcoma; SKCM, skin cutaneous melanoma; STAD, stomach adenocarcinoma; TGCT, testicular germ cell tumor; THCA, thyroid carcinoma; LICEC, large intestinal cancer; UCS, uterine carcinosarcoma; UVM, uveal melanoma.
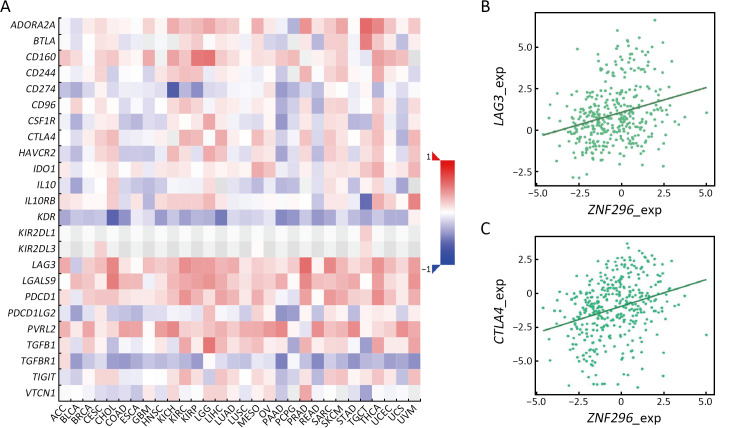
High expression of ZNF296 is correlated with expression of LAG3 and CTLA4. (A) Heatmap showing Spearman correlations between the expression of ZNF296 and immune inhibitors in human cancers; (B) Scatter plot showing the correlation between ZNF296 and LAG3 expression (r=0.27); (C) Scatter plot showing the correlation between ZNF296 and CTLA4 expression (r=0.31). LAG3, lymphocyte activation gene-3; CTLA4, cytotoxic T-lymphocyte associated protein 4; ACC, adrenocortical carcinoma; BLCA, bladder urothelial carcinoma; BRCA, breast invasive carcinoma; CESC, cervical squamous cell carcinoma and endocervical adenocarcinoma; CHOL, cholangiocarcinoma; COAD, colon adenocarcinoma; ESCA, esophageal carcinoma; GBM, glioblastoma multiforme; HNSC, head and neck squamous cell carcinoma; KICH, kidney chromophobe; KIRC, kidney renal clear cell carcinoma; KIRP, kidney renal papillary cell carcinoma; LGG, lower grade glioma; LIHC, liver hepatocellular carcinoma; LUAD, lung adenocarcinoma; LUSC, lung squamous cell carcinoma; MESO, mesothelioma; OV, ovarian serous cystadenocarcinoma; PAAD, pancreatic adenocarcinoma; PCPG, pheochromocytoma and paraganglioma; PRAD, prostate adenocarcinoma; READ, rectum adenocarcinoma; SARC, sarcoma; SKCM, skin cutaneous melanoma; STAD, stomach adenocarcinoma; TGCT, testicular germ cell tumor; THCA, thyroid carcinoma; LICEC, large intestinal cancer; UCS, uterine carcinosarcoma; UVM, uveal melanoma.
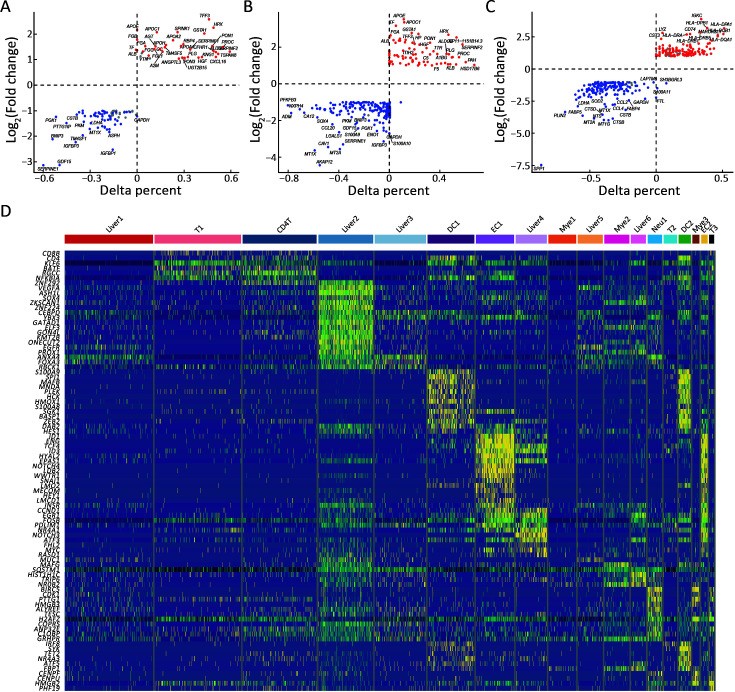
Survival of patients with HCC depends on the normal function of liver and DC cells. (A−C) Differential expression analysis was performed to identify genes enriched in Liver 1 (A), Liver 2 (B), and DC1 (C) cells. For each subtype, the average Log (Fold change) and percentage of cells expressing the gene above background were compared between the two clusters; (D) Heatmap showing the top-expressed TFs of the 18 cell clusters. HCC, hepatocellular carcinoma; T, CD8+ T cell; CD4T, CD4+ T cell; DC, dendritic cell; EC, endothelial cell; Neu, neutrophil; Liver, liver cell; Mye, myeloid cell
SUPPLEMENTARY DATA
Supplementary data to this article can be found online.
Acknowledgements
This study was funded by the Key Program of the National Natural Science Foundation of China (No. 81930016), National Natural Science Foundation of China (No. 92159202 and No. 82273177), Key Research and Development Plan of Zhejiang Province (No. 2021C03118 and No. 2022C03108), and Zhejiang Provincial Natural Science Foundation of China (No. LQ20H160029).
Footnote
Conflicts of Interest: The authors have no conflicts of interest to declare.
References
Articles from Chinese Journal of Cancer Research are provided here courtesy of Beijing Institute for Cancer Research
Full text links
Read article at publisher's site: https://doi.org/10.21147/j.issn.1000-9604.2024.05.05
 2,*
2,* 

