| PMC full text: | Published online 2023 Aug 8. doi: 10.1002/cam4.6425
|
FIGURE 1

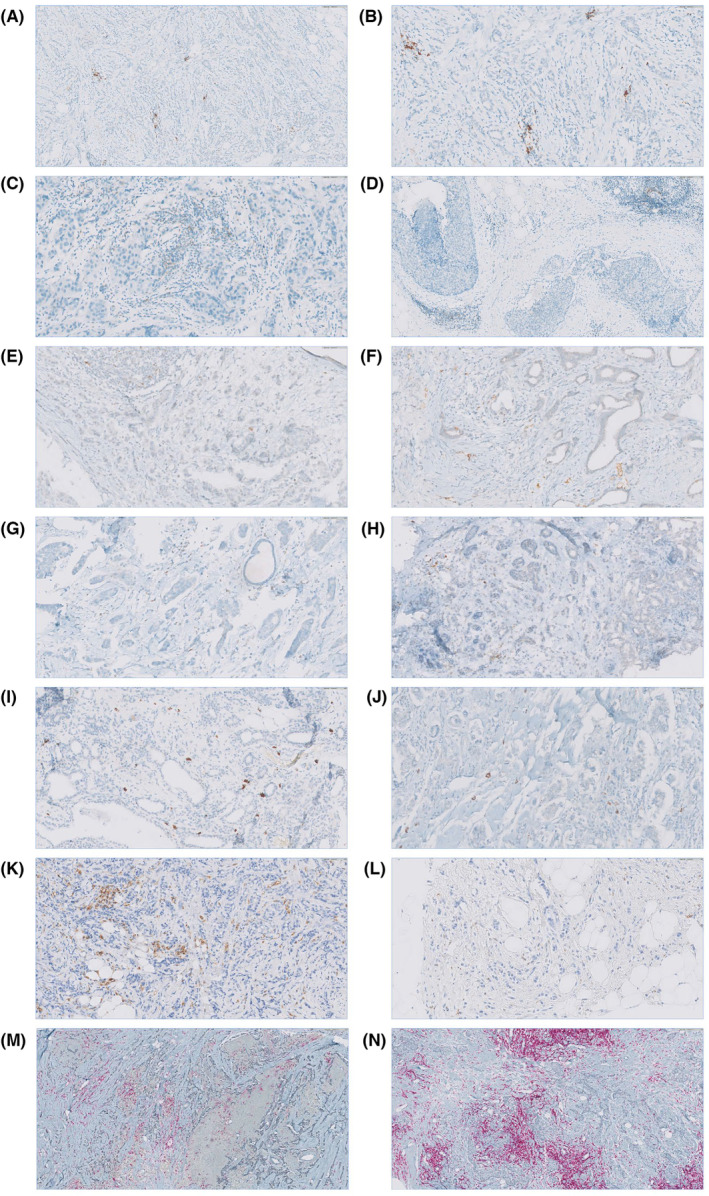
Immunohistochemical staining of FFPE slides was performed using monoclonal antibodies. Scoring for markers was done by measuring the percentage of cells stained in stromal tissue compartments. Positive staining was evaluated quantitatively, and thresholds used to collect data were chosen based on individual biomarker distribution and current standards. Scores of lymphocyte biomarkers were reported as absolute counts, and any positive expression (≥1% TILs per TMA core) was used for dichotomization into positive and negative cases. (A) PD‐L1 immunohistochemical expression is 5%–10% on the TILs (scale bar =
= 100
100 μm, ×20, HPF). (B) PD‐L1 immunohistochemical expression is 5%–10% on the TILs (scale bar
 =
= 40
40 μm, ×40, HPF). (C) PD‐1 immunohistochemical expression is 5%–10% on the TILs (scale bar
 =
= 40
40 μm, ×40, HPF). (D) PD‐1 immunohistochemical expression 5%–10% on the TILs (scale bar
 =
= 100
100 μm, ×20, HPF). (E) CTLA‐4 immunohistochemical expression 5%–10% on the TILs (scale bar
 =
= 40
40 μm, ×40, HPF). (F) CTLA‐4 immunohistochemical expression 10%–15% on the TILs (scale bar
 =
= 40
40 μm, ×40, HPF). (G) TIM‐3 immunohistochemical expression 10%–15% on the TILs (scale bar
 =
= 40
40 μm, ×40, HPF). (H) TIM‐3 immunohistochemical expression 1%–5% on the TILs (scale bar
 =
= 40
40 μm, ×40, HPF). (I) LAG‐3 immunohistochemical expression 10%–15% on the TILs (scale bar
 =
= 40
40 μm, ×40, HPF). (J) LAG‐3 immunohistochemical expression 5%–10% on the TILs (scale bar
 =
= 40
40 μm, ×40, HPF). (K) CD‐68 immunohistochemical expression 40% on the TILs (scale bar
 =
= 40
40 μm, ×40, HPF). (L) CD‐68 immunohistochemical expression 5% on the TILs (scale bar
 =
= 40
40 μm, ×40, HPF). (M) CD‐4 immunohistochemical expression 10% on the TILs and FOXP‐3 immunohistochemical expression 60% on the TILs (scale bar
 =
= 100
100 μm, ×20, HPF). N) CD‐4 immunohistochemical expression 70% on the TILs and FOXP‐3 immunohistochemical expression 30% on the TILs (scale bar
 =
= 100
100 μm, ×20, HPF). FFPE, formalin‐fixed paraffin‐embedded; HPF, high‐power field; TMA, tissue microarray.


