| PMC full text: | Published online 2024 Jul 5. doi: 10.1039/d4ra02309a
|
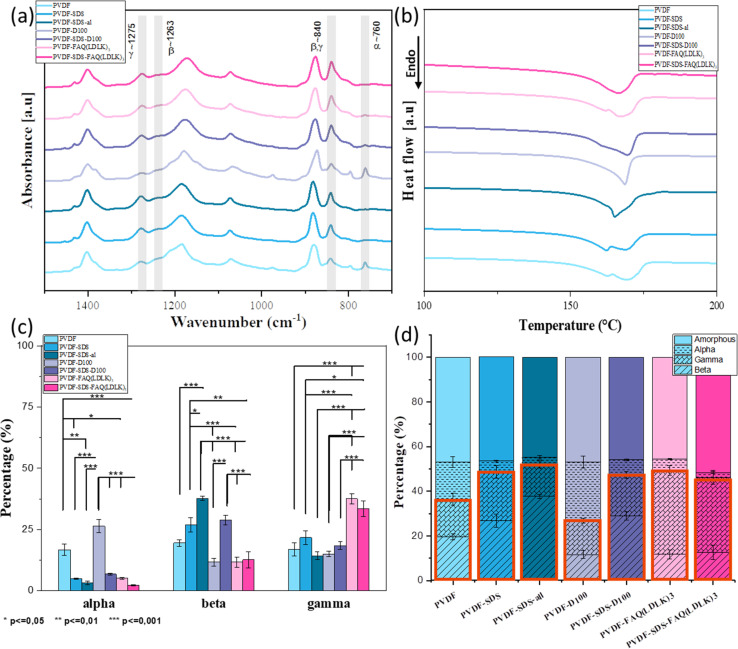
Fig. 5

(a) FTIR spectra along with the specific absorption peaks corresponding to the α, β, and γ to measure phase content, (b) DSC thermogram showing melting peaks to measure the degree of crystallinity of scaffolds, (c) phase content measured by the three mathematical resolution enhancement methods of Fourier self-deconvolution, second derivative analysis, and band curve-fitting of FTIR spectra. (d) Bar charts representing percentages of each phase and the electroactive phase are determined by merging phase content (FTIR) and degree of crystallinity (DSC) results. The orange box indicates the overall electroactive phase content. Data are represented as average ± SEM (N = 3). Statistical analysis: one-way ANOVA followed by Tukey multiple comparison tests. Statistical analysis shows significant differences between conditions (*p ≤ 0.05, **p ≤ 0.01, and ***p ≤ 0.001).


