Abstract
Free full text

Human AP Endonuclease I Stimulates Multiple-Turnover Base Excision by Alkyladenine DNA Glycosylase†
Abstract
Human alkyladenine DNA glycosylase (AAG) locates and excises a wide variety of damaged purine bases from DNA, including hypoxanthine that is formed by the oxidative deamination of adenine. We used steady state, pre-steady state, and single-turnover kinetic assays to show that the multiple-turnover excision of hypoxanthine in vitro is limited by release of the abasic DNA product. This suggests the possibility that the product release step is regulated in vivo by interactions with other base excision repair (BER) proteins. Such coordination of BER activities would protect the abasic DNA repair intermediate and ensure its correct processing. AP endonuclease 1 (APE1) is the predominant enzyme for processing abasic DNA sites in human cells. Therefore, we have investigated the functional effects of added APE1 on the base excision activity of AAG. We find that APE1 stimulates the multiple-turnover excision of hypoxanthine by AAG, but has no effect on single-turnover excision. Since the amino terminus of AAG has been implicated in other protein-protein interactions we also characterize the deletion mutant lacking the first 79 amino acids. We find that APE1 fully stimulates the multiple-turnover glycosylase activity of this mutant, demonstrating that the amino terminus of AAG is not strictly required for this functional interaction. These results are consistent with a model whereby APE1 displaces AAG from the abasic site, thereby coordinating the first two steps of the base excision repair pathway.
Single base lesions are the most frequently occurring type of DNA damage and the majority of these are repaired by the base excision repair (BER)1 pathway (1). The BER pathway is initiated by a DNA repair glycosylase that is responsible for finding the base lesions, flipping out the damaged nucleotide into the active site, and catalyzing hydrolysis of the N-glycosidic bond. Cells contain a diverse repertoire of DNA repair glycosylases that collectively are able to recognize hundreds of distinct base lesions (2–4). In the case of monofunctional glycosylases the products are the nucleobase lesion and an apurinic/apyrimidinic (AP) DNA duplex. Subsequently, AP endonuclease 1 (APE1) hydrolyzes the phosphodiester bond immediately 3´ to the AP site to create a single strand break with a 3´-hydroxyl and a 5´-deoxyribose phosphate. The 5´-deoxyribosyl phosphate group is removed by the lyase activity of polymerase β, which also catalyzes repair DNA synthesis using the intact strand as a template. Finally ligation by either ligase I or ligase III/XRCC1 completes the pathway. Since all of the intermediates in the BER pathway are potentially mutagenic, it would be advantageous for the steps of BER to be carefully coordinated. However, the molecular details of how multiple proteins might access a repair patch involving a single nucleotide replacement are not known (5, 6).
The human enzyme alkyladenine DNA glycosylase (AAG) exhibits very broad substrate specificity, excising a structurally diverse set of alkylated and oxidized purines ((7, 8) and references therein). The most efficient substrate for AAG that is known is deoxyinosine, which is formed from the oxidative deamination of deoxyadenosine (9–12). AAG has a catalytic proficiency of ~1017 for excision of hypoxanthine (Hx) from deoxyinosine-containing DNA (7). Crystal structures of the catalytic domain provide evidence that AAG uses nucleotide flipping to access the damaged base and identify specific contacts in the active site pocket that select against undamaged bases (13, 14). The sequence context effects (15–17) and sensitivity to the identity of the opposing base are consistent with the model that the nucleotide flipping step contributes additional selectivity towards damaged bases (7, 17, 18).
Two previous studies investigated whether APE1 can stimulate the multiple-turnover glycosylase activity of AAG, but they reached different conclusions (16, 19). The first study used steady state kinetics to conclude that APE1 increases the activity of AAG towards deoxyinosine by values of 5–27-fold (16), but did not address whether the increase was due to stabilization of AAG, an increase in the rate of product dissociation, or a relief of product inhibition. Indeed, the second study demonstrated that AAG is unstable under typical assay conditions and found that many proteins, including APE1, stabilize AAG. Therefore, they concluded that APE1 does not increase the rate of AAG dissociation, but provides modest relief of product inhibition (19). These observations prompted us to revisit these fundamental questions of what step limits the rate of the multiple-turnover glycosylase reaction and to what extent are the actions of AAG and APE1 coordinated? Since tight binding of the abasic product seems to be a general property of DNA repair glycosylases (20–22) there is ample reason to suspect that the product complex would be a point of regulation for AAG in the BER pathway.
Previous reports have suggested that the poorly conserved amino terminus of AAG contains binding sites for protein-protein interactions (23, 24). In addition, there is evidence that the amino terminus can contact DNA, because this portion of the protein plays a role in the search for DNA damage (25). However, there is no structural information available for this portion of the protein, because the first 79 amino acids of AAG were deleted for the crystallization of the protein (13). It has been noted that the presence of this region decreases the stability of AAG in vitro (19, 25, 26). Therefore, we directly compare both the full-length and a truncated form lacking the first 79 amino acids (Δ80) to test whether this region of AAG is necessary for the coordination of the first two steps of BER.
We have studied the AAG-catalyzed excision of Hx, to identify the rate-limiting step and to test the hypothesis that APE1 affects AAG-initiated repair reactions. We observe potent stimulation by APE1 under a wide variety of conditions, providing evidence that the individual steps of BER can be coordinated in the absence of any other protein factors or post-translational modifications. Notably, the amino terminus of AAG is not required for this stimulation. We provide biochemical evidence that this stimulation involves both a direct enhancement of the rate of AAG dissociation from abasic DNA and an indirect relief of product inhibition. The increased rate of dissociation of AAG from its abasic product on oligonucleotides as short as 17 base pairs demonstrates functional coupling between AAG and APE1. This is very similar to the coupling that has been observed for other human DNA repair glycosylases (21, 27–33).
MATERIALS AND METHODS
Human recombinant proteins
Full-length and truncated human AAG were expressed in E. coli and purified as previously described (34). The concentrations of AAG proteins were routinely determined from burst analysis as previously described (25). Full-length human APE1 was cloned into a pET22-based vector that contained an amino terminal hexa-histidine tag that could be cleaved with tobacco etch virus (TEV) protease. After TEV protease cleavage the amino terminus contained an extra 6 amino acids (H2N-GAMDPM-). The purification was similar to the previously described protocol, with Ni2+-NTA agarose, TEV protease cleavage to remove the polyhistidine tag, and final purification by S-sepharose anion exchange (35). The concentration of APE1 was determined from the absorbance at 280 nm using the calculated extinction coefficient of 5.6 × 10⁴ M−1cm−1 (36).
Synthesis and purification of oligonucleotides
DNA substrates were synthesized by commercial sources using standard phosphoramidite chemistry, and purified by denaturing polyacrylamide gel electrophoresis. The lesion-containing oligonucleotides contained a 5´-fluorescein (fam) label. The full-length oligonucleotides were excised from the gel, and eluted by crushing and soaking the gel slices overnight. DNA was extracted and desalted by reverse phase (C18 Sep-pak, Waters). The concentration of the single-stranded DNA stocks were determined from the absorbance at 260 nm using the calculated extinction coefficients. Prior to glycosylase assays, oligonucleotides were annealed to a 1.5-fold excess of the complementary strand by heating to 90 °C and cooling to 4 °C over a period of ~15 minutes.
The abasic DNA product was formed by multiple-turnover reaction with Δ80 AAG, phenol chloroform extracted to remove the protein, and desalted with sephadex G-25 that had been equilibrated with annealing buffer (10 mM NaMES, pH 6.5, 50 mM NaCl). The fraction abasic was determined by denaturing PAGE analysis of samples that were heated for 15 minutes in 0.2 M NaOH and of samples that were analyzed in formamide gel loading buffer without heating. Typically the fraction abasic was >90% with ≤5% nicked DNA and ≤5% intact substrate. The concentration of abasic DNA was determined by comparing the fluorescence intensity of the fluorescein in the abasic DNA duplex to that of a known concentration of inosine-containing duplex (excitation at 483 nm, emission at 525 nm). We assumed that the quantum yield of the fluorescein label was identical whether the 25mer duplex containined a central abasic site or a central inosine.
General glycosylase activity assay
Glycosylase assays were performed as described previously (25, 34). Unless otherwise indicated, enzyme and DNA substrates were mixed in a solution containing 50 mM NaHEPES, pH 7.0, 1 mM EDTA, 1 mM DTT, 10% (v/v glycerol), 0.1 mg/mL BSA and sufficient NaCl to attain an ionic strength of 42 or 120 mM. The 42 mM ionic strength condition was chosen as a low ionic strength condition simply because this was the lowest ionic strength that could be conveniently achieved in the indicated HEPES buffer system, after taking into account the maximal salt from enzyme and DNA stocks. Reactions were incubated at 37 °C. At the desired times aliquots were withdrawn and quenched by mixing with 2 volumes of 0.3 M NaOH to attain a final concentration of 0.2 M NaOH. Abasic sites were quantitatively converted to DNA breaks by heating samples at 70 °C for 15 min. Samples were mixed with formamide/EDTA loading buffer (3.3 volumes), heated briefly at 70 °C (~ 2 min), and loaded onto polyacrylamide sequencing gels (10–20%) containing urea (6–8M). Gels were scanned with a typhoon trio imager using 488 nm excitation and a 520 nm long pass filter to detect fluorescein. Intensities of products and substrate bands were quantified using Image Quant TL (GE Healthcare) and for each time point the fraction product was calculated (F = P/(P+S); in which F is the fraction converted to product, P is product, and S is intact substrate).
Preincubation controls to evaluate the stability of AAG
The stability of full-length and truncated (Δ80) AAG proteins were assessed by incubating the enzyme under a variety of assay conditions for periods of time up to 24 hours. Reference reactions were initiated by adding AAG to directly to the DNA without pre-incubation. We used multiple-turnover excision of Hx with saturating substrate (1 µM) to determine the activity of AAG, because the initial velocity is proportional to the amount of active enzyme under these conditions (Equation 1). The fraction of active enzyme is given by the ratio of the initial rate of the pre-incubated sample to a control reaction in which the enzyme was not preincubated.
Under conditions for which the enzyme was not stable the activity of AAG seemed to drop off with a single exponential dependence (Equation 2; kinact is the rate constant for enzyme inactivation and t is the incubation time).
Single-turnover kinetics
Single-turnover glycosylase assays were performed with AAG in excess over DNA. The DNA concentration was typically 50 nM, but ranged from 10–200 nM in different experiments. Time points were chosen to cover the entire reaction progress curve and the fraction product, determined from the gel-based assay, was plotted as a function of reaction time. The reaction progress curves were fit by a single exponential equation using Kaleidagraph (Equation 3; A is the fraction of substrate converted to product at completion, kobs is the observed single-turnover rate constant, and t is the reaction time). Although the reactions are relatively fast under these conditions, we were able to take fast time points by hand and follow at least 50% of the reaction. In all cases the quality of the fits were excellent with R2 values ≥0.96 and amplitudes that were close to 1.
Under single-turnover conditions it is expected that the concentration dependence of the enzyme will be hyperbolic (Equation 4). The maximal observed rate constant (kmax) corresponds to the rate of reaction at saturating concentration of enzyme and the K1/2 value indicates the concentration at which half of the substrate is bound. Due to the tight binding of AAG, we were not able to determine half-maximal saturating concentrations of AAG. Since the observed rate constant was independent of the concentration of AAG over a wide range, this indicates that the observed rate constant is the maximal single-turnover rate constant (kobs = kmax).
Burst analysis to determine the concentration of active AAG
Under low ionic strength conditions AAG catalyzes a rapid burst of Hx excision, followed by slow rate-limiting product release. This provides a simple assay to determine the concentration of active recombinant enzyme. We used the low ionic strength conditions mentioned above and used several different concentrations of glycosylase with 25mer substrate (1 µM) to obtain burst amplitudes between 5 and 20%. Since the pre-steady state burst is rapid under these conditions it was most convenient to extrapolate the burst amplitude from the linear portion of the reaction progress curve. When it was desirable to take time points covering both the initial burst and steady state phase, we employed Equation 5 in which P is product, A is the burst amplitude, kobs is the burst rate constant, and Vobs is the steady state velocity. We observed that the rate constant for the burst was identical within error to the rate constant for the single-turnover reaction with enzyme in excess over substrate, demonstrating that excess enzyme does not alter the kinetics of base excision.
Multiple-turnover kinetics and stimulation by APE1
To determine multiple-turnover rate constants in the presence and absence of APE1, we ensured that the concentration of DNA (1 µM) was in at least 30-fold excess over the concentration of AAG so that the burst would be negligible. Velocity was calculated from the initial rates of product formation up to ~20% reaction and the kcat value was calculated according to Equation 1. Since our standard reaction buffer does not contain Mg2+, a cofactor required for APE1-catalyzed endonuclease activity, it was necessary to have stoichiometric concentration of APE1 to effectively sequester all of the abasic product. We found that 2 µM APE1 was sufficient to fully saturate the rate of AAG-catalyzed excision of Hx under the conditions employed and that increasing the concentration of APE1 to 4 or 6 µM had no significant effect on the rate. To confirm that APE1 was inactive under these conditions (1 mM EDTA), we performed a control in which reactions were quenched in formamide/20 mM EDTA and directly analyzed by denaturing PAGE. This established that the rate of strand nicking in the presence of 2 µM APE1 is at least 10-fold slower than the rate of multiple-turnover excision of Hx by AAG (See Supporting Information; Figure S5)
Equilibrium inhibition by the abasic DNA product
Due to the relatively tight binding of AAG to DNA it was not possible to directly measure KM and Ki values for substrate and products using the gel-based DNA glycosylase assay with fluorescently labeled DNA. Nevertheless, the relative affinity for substrate and product could be readily determined by mixing together different ratios of abasic DNA and Hx-containing substrate DNA and measuring the initial rates of abasic product formation (≤ 20% reaction). The equation for a competitive inhibitor is given by Equation 6, which can be rearranged to give Equation 7 [Vobs is the observed velocity, Vmax is the maximal velocity in the absence of inhibitor, KM is the half-maximal concentration for saturation by substrate (S), Ki is the half-maximal concentration for binding to the inhibitor (I)]. Under conditions for which the concentration of substrate is much greater than KM, then this equation simplifies to Equation 8. Plotting the relative velocity (Vobs/Vmax) versus the ratio of inhibitor/substrate gives the ratio of KM for the substrate and Ki for the inhibitor.
Pre-steady state experiments to determine the rate constant for dissociation of AAG from the abasic DNA product
To test whether the rate-limiting step in the multiple-turnover reaction is release of the 25mer abasic product we generated the abasic DNA duplex and incubated it with AAG. We varied this incubation time between 1 and 2 hours and found no difference, indicating that the complex was stably formed. After this preincubation the solution of 250 nM AAG•abasic DNA complex was diluted 5-fold into a solution of 25mer substrate in the standard low ionic strength reaction buffer to achieve a final concentration of 50 nM AAG, 50 nM abasic 25mer, and 1 µM substrate 25mer. The glycosylase activity was measured as described above. To account for the equilibrium inhibition due to the added abasic DNA product, the control reaction contained the same mixture of abasic product and substrate as in the first reaction. The only difference was that the preincubation step was omitted.
The observation that kcat for the AAG-catalyzed reaction is sensitive to DNA length between 17 and 25 base pairs suggested an additional way to test the hypothesis that the rate-limiting step is dissociation from the abasic product. If the slower kcat value for the longer substrate is due to a slower rate of dissociation, then a lag is predicted if a 25mer abasic DNA complex is chased with a 17mer substrate since the first turnover involves dissociation from the longer abasic-containing oligo and subsequent turnovers involve dissociation from the shorter abasic-containing oligo. This experiment was carried out exactly as described above, except that the 17mer substrate was used in place of the 25mer substrate. The reactions that exhibited burst phases were fit to Equation 5. The reactions that exhibited a lag were fit to Equation 9, in which [P] is the concentration of product, [S] is the concentration of substrate, k1 is the rate constant for dissociation from the 25mer and k2 is the rate constant for dissociation from the 17mer (37).
RESULTS
Appropriate assay conditions for AAG
Several previous studies have reported loss of AAG activity under in vitro assay conditions, which are typically low ionic strength and low total protein concentration (19, 25, 26, 34). Protein instability can greatly complicate the interpretation of enzyme kinetics, therefore it is critical that assay conditions be found for which the enzyme of interest is stable for the full time course of interest. For example, loss of protein activity over time could be interpreted as burst kinetics or product inhibition. Most importantly, if the enzyme is unstable under the reaction conditions, then experiments designed to test the effects of adding additional components would simultaneously assay enzyme stability and activity. We used pre-incubation controls to evaluate the stability of the catalytic domain (Δ80) and full-length AAG.
Incubation of a dilute solution of AAG (20 nM) in the absence of DNA substrate at low ionic strength (I = 42 mM) results in a rapid loss of activity, with a half-life of ~10 minutes (Figure 1). This stability was slightly increased to a half-life of ~40 minutes by increasing the ionic strength (I = 120 mM). This rapid, irreversible loss of catalytic activity could be prevented by the addition of 0.1 mg/mL BSA (Figure 1). Additional experiments suggested that similar stabilization was observed between 0.01 and 0.5 mg/mL BSA, so we chose 0.1 mg/mL BSA in our standard assay buffer. This does not appear to be a specific effect of BSA because other proteins are able to stabilize AAG to the same extent ((19) & data not shown). We find that the truncated enzyme, Δ80, is significantly more stable than the full-length protein under a variety of conditions, consistent with previous reports (19, 25, 26). The truncated enzyme is also greatly stabilized by the presence of BSA (See Supporting Information). Therefore, all of the subsequent reactions contained 0.1 mg/mL BSA.
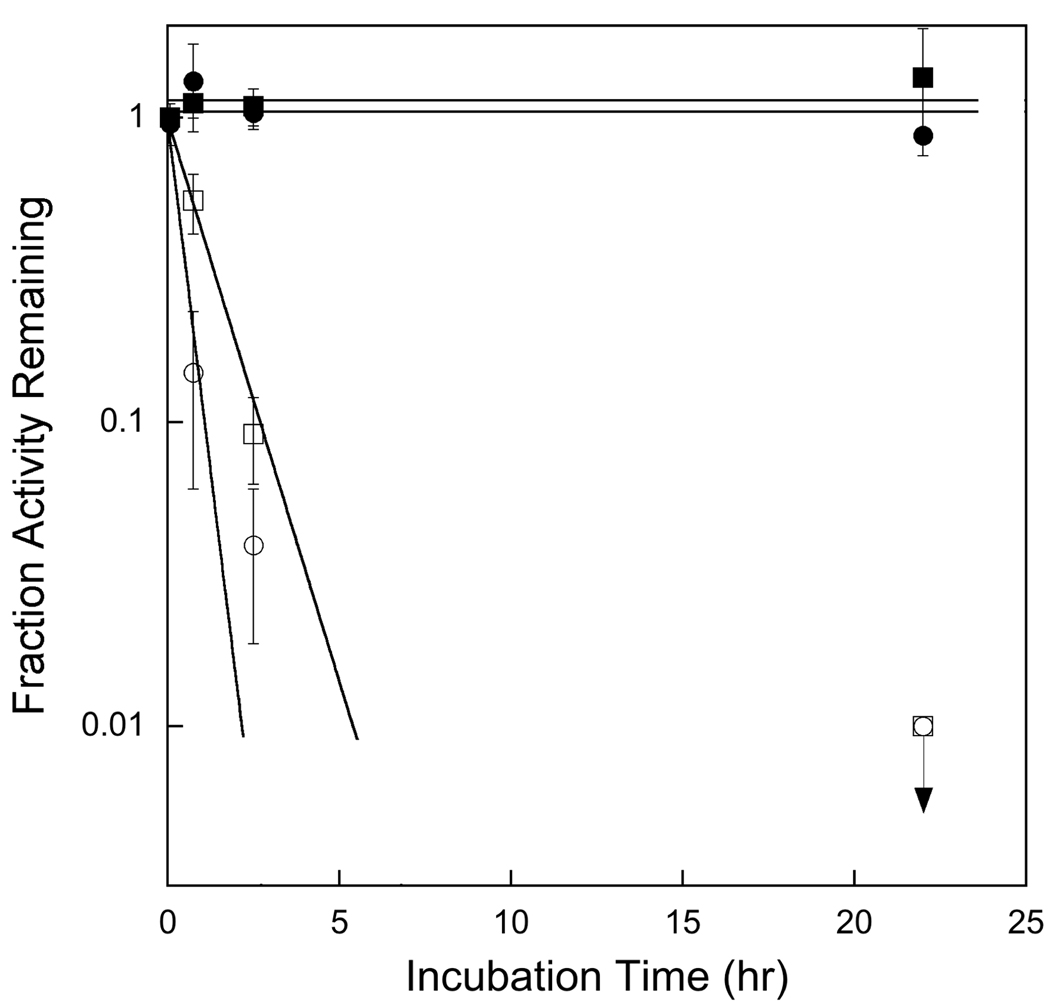
Stability of full-length AAG in the absence of DNA. AAG (20 nM) was incubated at pH 7.0 and 37 °C. The ionic strength was adjusted with sodium chloride to be low (42 mM, circles) or high (120 mM, squares). Incubations contained no additional proteins (open symbols) or were supplemented with 0.1 mg/mL BSA (closed symbols). After the indicated incubation time the multiple-turnover glycosylase activity was measured as described in the Materials and Methods. The average and standard deviation for triplicate reactions is shown. In the absence of BSA there was no detectable glycosylase activity, so only the limit of ≤1% is indicated. Single exponential fits to the activity of AAG in the absence of BSA gave half-lives of 10 and 40 minutes, respectively for low and high ionic strength. In the presence of BSA full glycosylase activity was retained for at least a day.
AAG exhibits burst kinetics for the excision of Hx
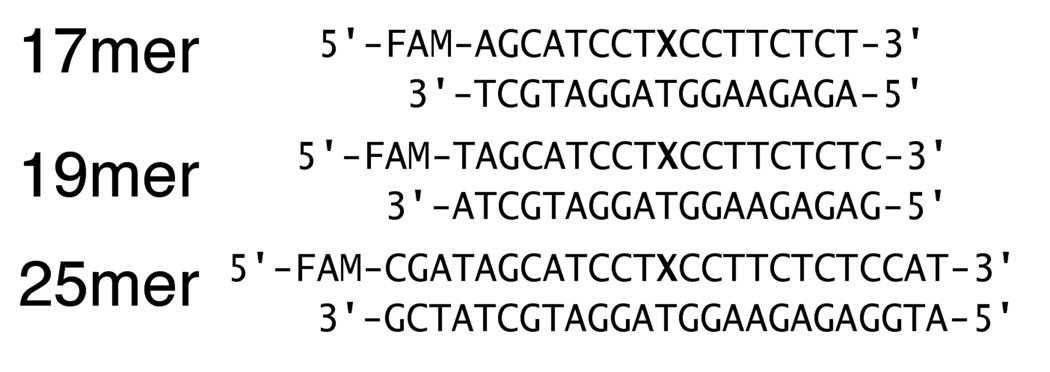
Satisfied that even dilute solutions of AAG were stable in our reaction conditions, we examined multiple-turnover base excision for reactions in which DNA substrate was in only slight excess to the enzyme. Unless otherwise indicated, we used a 25mer oligonucleotide duplex containing a central Hx•T mismatch (Scheme 1). This is much larger than the ~10 base pairs footprint of AAG (13, 38). Under low ionic strength conditions (pH 7.0, 42 mM ionic strength) there is a rapid pre-steady state burst, followed by a much slower steady state rate (Figure 2). The concentration of AAG was varied at a constant concentration of DNA to evaluate whether the observed rapid phase of the reaction was a bona fide burst. The results demonstrate that the burst amplitude is linearly dependent upon the concentration of enzyme, whereas the burst rate constant is independent (Figure 2 & Supporting Information). The burst rate constant of ~3 min−1 was indistinguishable from the single-turnover rate constant of 2.8 ± 0.4 min−1 (Figure 3 and Table 1). The burst amplitude was used to determine the concentration of active enzyme (see Materials and Methods). Similarly, the steady state rate of Hx excision is also linearly dependent upon the concentration of AAG (Figure 2 & Supporting Information). These data suggest that N- glycosidic bond cleavage reaction is relatively rapid and that it is followed by a much slower step that is required to regenerate free enzyme. Below we present evidence that release of the abasic DNA product is the rate-limiting step under the conditions employed.
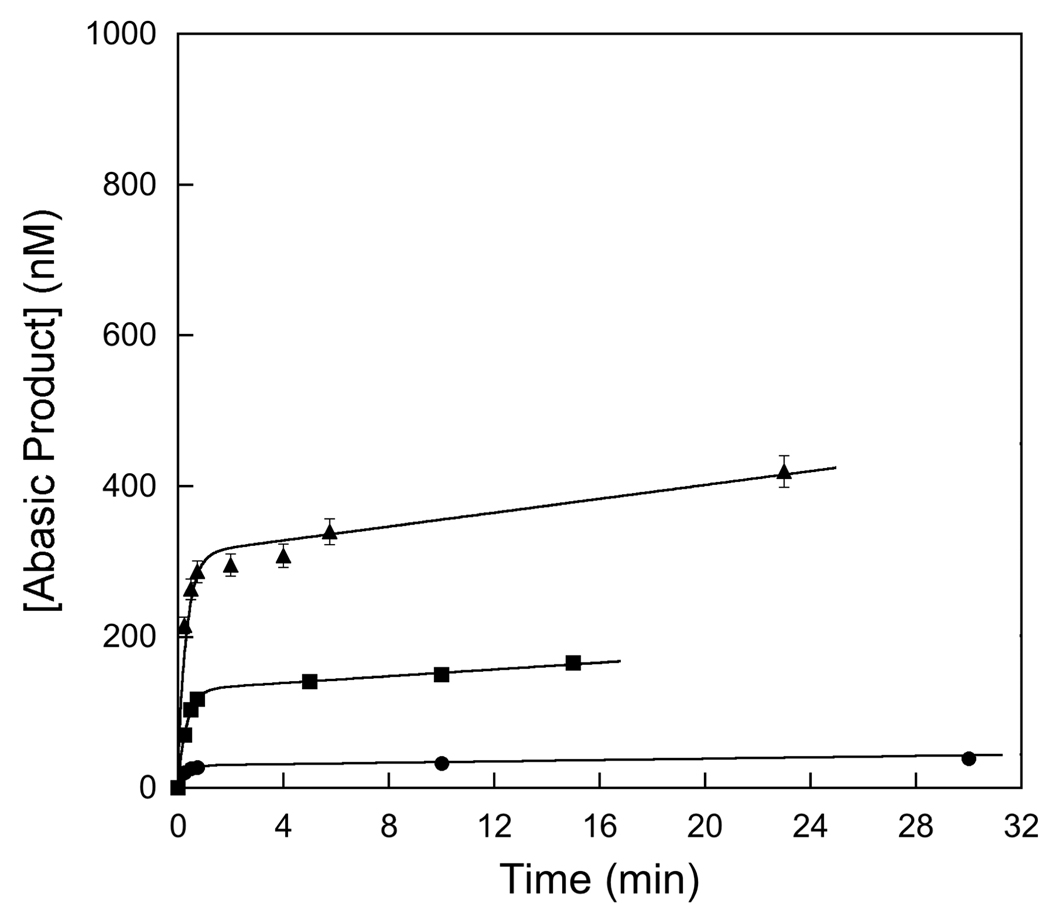
AAG exhibits burst kinetics. Reactions were carried out under our standard low ionic strength conditions (42 mM) with 1 µM 25mer substrate and 30 (●), 120 (■), or 300 (▲) nM full-length AAG. The reactions were performed in triplicate and the average and standard deviation are shown (in many cases the standard deviation is smaller than the symbols). The burst amplitude and steady state velocity were obtained from nonlinear least square fits to the data using Equation 5 (See Material and Methods for details). Both the burst amplitude and steady state velocity were linearly dependent upon the concentration of AAG, corresponding to a stoichiometric burst (see Supporting Information).
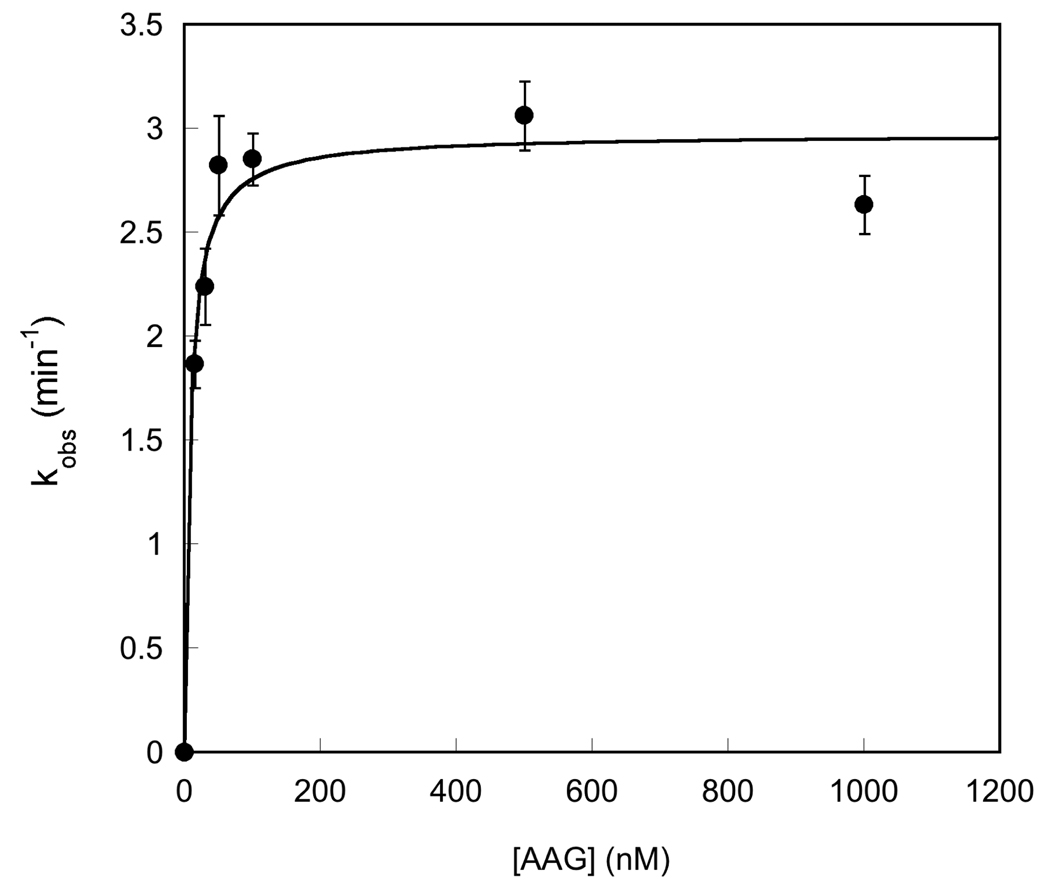
Saturation of the single-turnover excision of Hx by AAG. Single-turnover reactions were performed with 20 nM DNA and the concentration of AAG was varied between 20 and 1000 nM. At each concentration of AAG the entire time course was followed and fit by a single exponential (Equation 3; see the Materials and Methods for details). The ionic strength in this experiment was 120 mM, and the average and standard deviation of duplicate reactions is shown. The results indicate that the K1/2 for binding is ≤ 20 nM (Equation 4).
Table 1
Kinetic Parameters for AAG-Catalyzed Excision of Hypoxanthine in the Presence and Absence of APE1a
| Enzyme | Ionic Strength (mM) | Fold Stimulationb | kcat (min−1) No APE1c | kcat (min−1) with APE1c | kmax (min−1) No APE1d |
|---|---|---|---|---|---|
| Full-length | 42 | 100 | 0.026 ± 0.002 | 2.7 ± 0.1 | 2.8 ± 0.4 |
| 120 | 4 | 0.65 ± 0.05 | 2.5 ± 0.2 | 2.7 ± 0.3 | |
| Δ80 | 42 | 65 | 0.046 ± 0.002 | 3.0 ± 0.1 | 3.3 ± 0.8 |
| 120 | 4 | 0.73 ± 0.05 | 2.9 ± 0.2 | 2.6 ± 0.4 | |
APE1 does not affect AAG-catalyzed single-turnover excision of Hx
If APE1 and AAG form a complex on DNA, then this interaction could alter the affinity or catalytic activity of AAG. To investigate this possibility, we turned to the single-turnover glycosylase assay in which enzyme is in excess over the DNA substrate. Previous work suggested that the saturating single-turnover rate constant (kmax) reflects the N-glycosidic bond cleavage and/or nucleotide flipping steps (7, 39). If APE1 were to interact with AAG, then one might expect to observe a change in the rate constant for AAG-catalyzed single-turnover excision.
Since we employed different reaction conditions than the previous studies we first determined the concentration of AAG necessary to saturate the Hx-containing substrate by performing single-turnover reactions at a range of AAG concentrations. The results show that AAG fully saturates (K1/2 ≤50 nM) at high ionic strength (I = 120 mM; Figure 3). It was not possible to determine the exact K1/2 value, because our gel-based assay required a minimum of 20 nM fluorescein-labeled substrate and at this concentration the 1:1 complex was almost fully saturating (Figure 3). The observation that the single-turnover rate constant was independent of the concentration of AAG confirms that the saturating rate constant, kmax, was measured. Similar experiments with Δ80 AAG demonstrated that the single-turnover rate constant was independent of the concentration of enzyme over a wide range, so that the observed rate constant was simply kmax. The saturation by both full-length and Δ80 AAG was confirmed at both high (120 mM) and low (42 mM) ionic strength and the results are summarized in Table 1, with representative time courses shown in Figure 4. Consistent with previous reports (7, 19, 25, 26), we find that full-length and truncated forms of AAG have identical single-turnover glycosylase activities (Table 1, right column). The single-turnover rate constant is independent of ionic strength, similar to what has been observed for the excision of εA by full-length and Δ80 AAG (25).
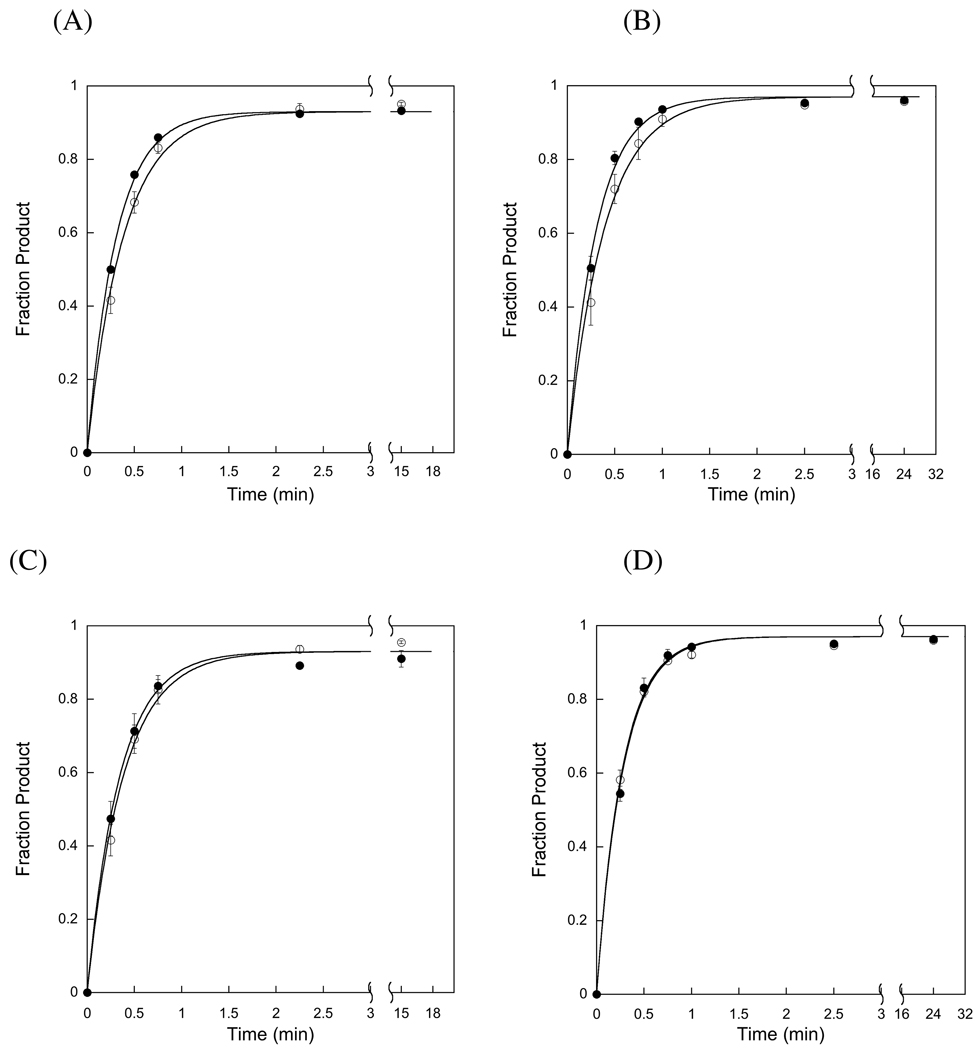
APE1 does not affect AAG-catalyzed single-turnover. Single-turnover reactions were carried out with either full-length (A & B) or Δ80 (C & D) AAG (1 µM) in excess over the 25mer DNA substrate (100 nM). These experiments were performed at 42 mM ionic strength (A & C) or at 120 mM ionic strength (B & D). The rates of reaction in the absence (○) and presence (●) of 2 µM APE1 were essentially identical in all cases. The lines indicate the non-linear least square fits of the equation for a single exponential (Equation 3). Representative data is shown for reactions that were carried out in duplicate and the error bars indicate the standard deviation. The rate constants obtained from this experiment were combined with additional experiments conducted under the same conditions and the average value is reported in Table 1.
The addition of APE1 has no significant effect on the rate of single-turnover excision, suggesting that if these two proteins interact, then APE1 does not affect the nucleotide flipping and base excision activities of AAG (Figure 4). Although APE1 is not active in this buffer, because the required Mg2+ cofactor is omitted, control experiments showed that our preparation of APE1 was catalytically active (data not shown). These observations are consistent with the previous report that APE1 does not alter the single-turnover glycosylase activity of AAG (19). This could indicate that APE1 and AAG do not interact under these conditions or that an interaction occurs that does not affect the activity of AAG. However, these data do not exclude the possibility that APE1 can affect the catalytic activity of AAG, particularly if this affect required Mg2+ or additional proteins that were not present in our simplified system.
APE1 stimulates the multiple-turnover reaction catalyzed by AAG
To test whether APE1 can accelerate the slow multiple-turnover glycosylase activity of AAG, we added increasing amounts of APE1 to AAG-catalyzed multiple-turnover glycosylase reactions. We chose to omit Mg2+ from our reaction buffer to prevent APE1-catalyzed hydrolysis since this would allow us to distinguish a stimulatory effect of APE1 distinct from the simple removal of the abasic site. It has previously been shown that APE1 binds tightly to abasic DNA in the absence of Mg2+ (e.g. (5, 40) and data not shown). Control reactions confirmed that there was only a trace level of strand nicking activity under our experimental conditions, and this very slow rate of reaction is at least 10-fold slower than the multiple-turnover reaction catalyzed by AAG (See Supporting Information). Since APE1 is catalytically inactive, it was expected that a stoichiometric excess of APE1 over DNA would be required to allow formation of the 1:1 complex of APE1 bound to the abasic site. Under a wide variety of conditions APE1 stimulated the rate of AAG-catalyzed multiple-turnover base excision (Figure 5). Under conditions of excess APE1 (2–6 µM), the reaction rate was independent of the concentration of APE1. A dramatic increase of ~100-fold was observed under low ionic strength conditions (Figure 5A), indicating that APE1 increases the rate of dissociation of AAG from its abasic DNA product. In addition, linear reaction progress curves were obtained up to greater than 70% of the reaction. This suggests that in addition to increasing the rate of dissociation, APE1 also relieves product inhibition by sequestering the abasic DNA product. It is notable that the kcat value of 2.7 min−1 in the presence of APE1 is essentially the same as the single-turnover rate constant of ~2.8 min−1 for the burst phase, indicating that the rate of dissociation of AAG in the presence of APE1 is much faster than the nucleotide flipping and N-glycosidic bond cleavage (Table 1).
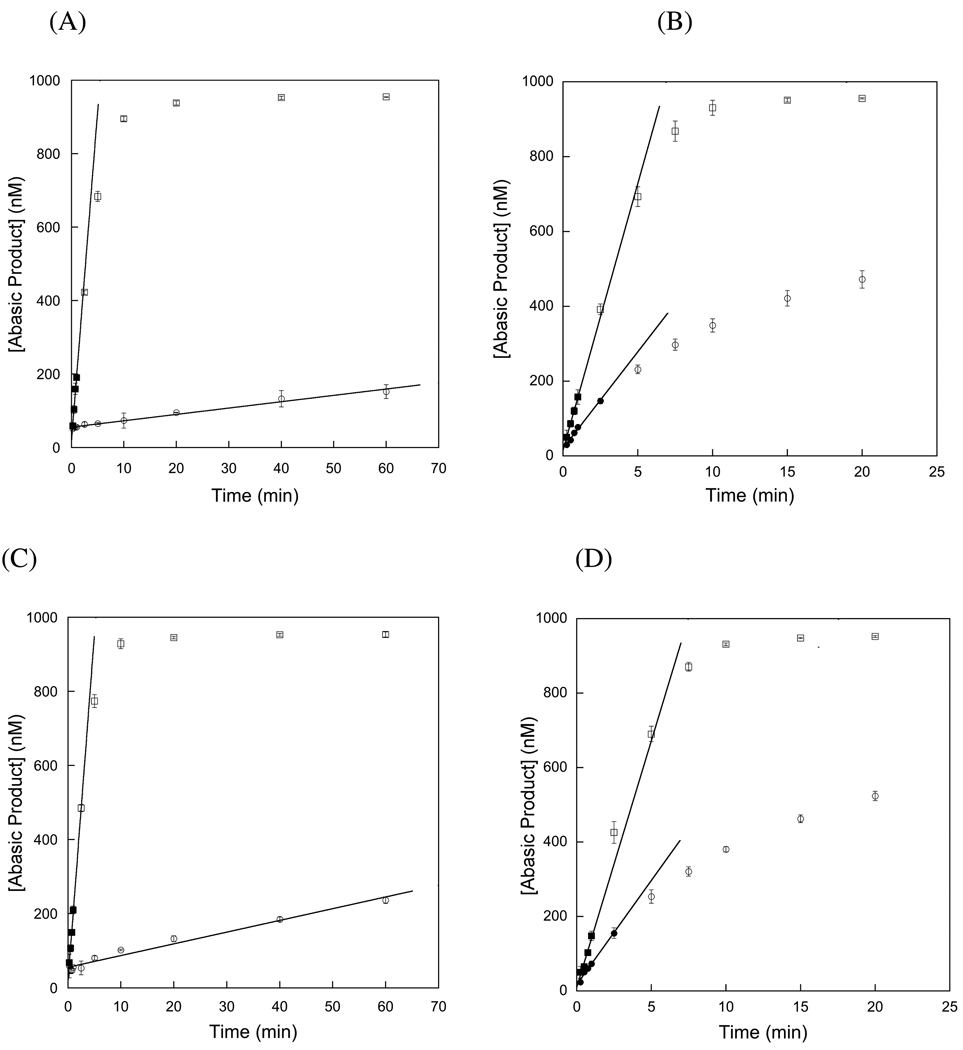
APE1 increases the rate of AAG-catalyzed multiple-turnover. The 25mer Hx-containing substrate (1 µM) was incubated with 50 nM of full-length (A & B) or Δ80 (C & D) AAG at low ionic strength (A & C) and at high ionic strength (B & D) in the absence (○) or presence (□) of 2 µM APE1. In cases for which greater than 20% of the substrate was converted to product, the closed symbols indicate the points that were used to determine the initial rate. It is apparent that the amino-terminal 80 amino acids of AAG are not required for the stimulation by APE1, because the upper panels (full-length AAG) are almost identical to the lower panels (Δ80 AAG). The linear fits to the initial rates provided kcat values in the presence and absence of APE1 (Equation 1). This representative experiment was performed in triplicate, with the average and standard deviation (error bars) shown. The results from this experiment were combined with additional experiments to provide the rate constants that are reported in Table 1.
We have previously shown that the dissociation of AAG from DNA is strongly dependent upon ionic strength, so it was important to examine the stimulation by APE1 at higher ionic strength. In the absence of APE1 the initial rate for AAG-catalyzed excision of Hx at saturating DNA concentration is ~23-fold higher at 120 mM ionic strength than at 42 mM ionic strength (Figure 5 & Table 1). Addition of APE1 increased the rate constant for multiple-turnover excision to essentially the same value that was observed at low ionic strength, which is the same as the rate constant for single-turnover excision. Although the observed stimulation by APE1 is only 4-fold, it is important to note that this limit is set by the rate of N-glycosidic bond cleavage for this lesion and it is expected that larger stimulatory effects would be observed for repair initiated at methylated bases that are more rapidly excised by AAG (7).
We also examined the ability of the amino-terminally truncated catalytic domain of AAG to perform multiple-turnover excision in the presence and absence of APE1, to investigate the role of the amino terminal portion in DNA binding and possible association with APE1. At low ionic strength the Δ80 truncated enzyme exhibited ~2-fold faster rate of multiple-turnover excision than was observed for the full-length protein (Table 1). At higher ionic strength (I = 120 mM) there was no significant difference (1.1-fold; Table 1). These observations indicate that the Δ80 protein closely mimics the DNA binding and glycosylase activities of the full-length protein. Addition of APE1 had an identical effect on the truncated and full-length proteins (Figure 5 & Table 1); APE1 increased the rate constant for multiple-turnover up to the rate constant for single-turnover. The slightly lower stimulation of the truncated protein simply reflects the 2-fold faster rate of product dissociation for this mutant in the absence of APE1. Therefore, we conclude that the amino terminus of AAG is not required for the APE1-dependent stimulation.
Evaluating the contribution of product inhibition to the APE1 affect
We observed that in the absence of APE1, the rate of AAG-catalyzed multiple-turnover reactions decreased significantly above 20% reaction (e.g., see Figure 5B and D). Since we established that AAG is stable under these reaction conditions (Figure 1) and the concentration of DNA was far above the Kd for substrate binding (Figure 3), the most likely explanation for the decrease in rate of product formation is product inhibition. To evaluate this possibility we added increasing amounts of abasic product and measured the initial rates. Given the tight binding of AAG to DNA it was most convenient to carry out these inhibition experiments at concentrations of substrate that were far above the KM. Under these conditions the relative KM/Ki value can be obtained from a plot of the ratio of inhibitor divided by substrate (See Materials and Methods). The results for both full-length and Δ80 AAG are shown in Figure 6 and indicate relatively modest inhibition.
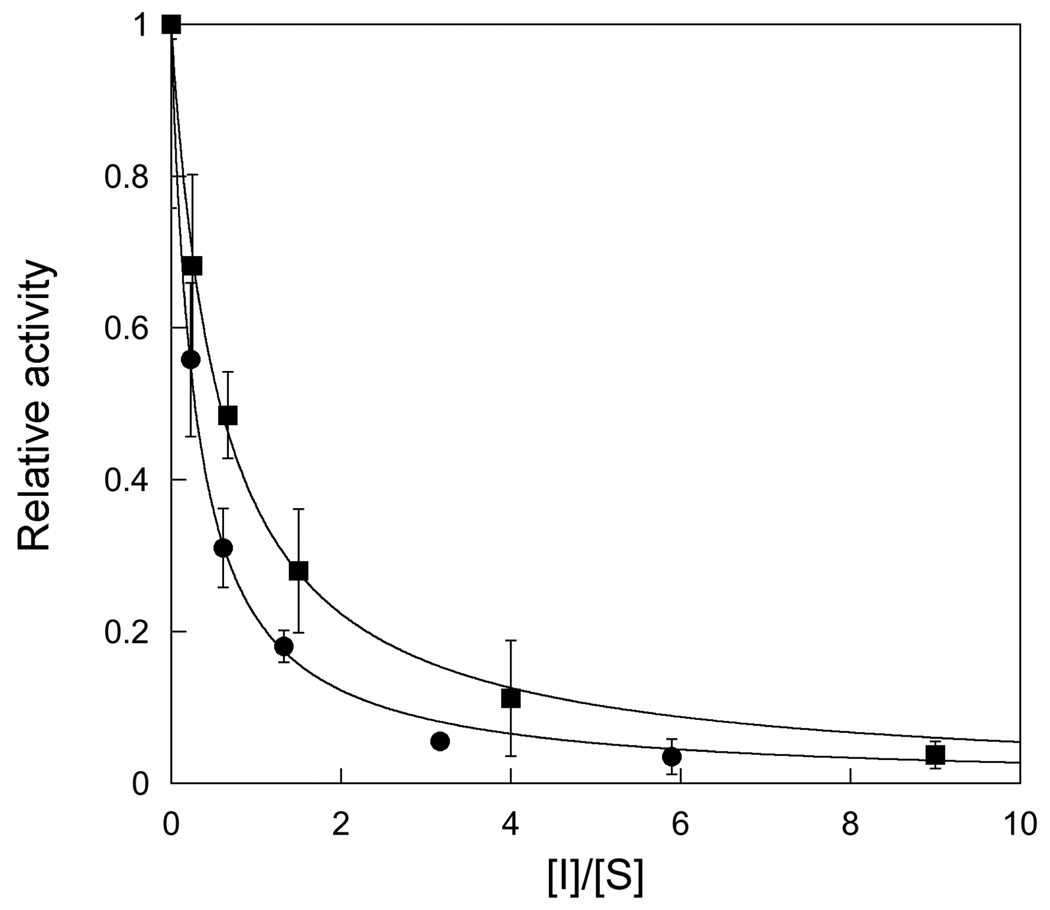
Equilibrium inhibition of AAG by its abasic DNA product. The relative affinity for substrate and inhibitor was determined for both full-length (●) and Δ80 AAG (■) by measuring the initial rate of product formation for mixtures of abasic product and substrate and plotting the relative activity (Vobs/Vmax) versus the ratio of inhibitor to substrate. The concentration of AAG was 25 nM and the total concentration of DNA was maintained at 500 nM. The concentration of abasic DNA was varied from none to 450 nM. Reactions were performed in triplicate and the error bars indicate the standard deviation from the mean. The lines indicate the best fit of Equation 8 to the data (see Materials and Methods) and yield Ki/KM ratios of 1.7 ± 0.2 for the full-length and 3.6 ± 0.2 for Δ80 AAG.
In other work in our lab we have used pulse-chase experiments to establish that bound Hx-containing substrate partitions exclusively towards dissociation without appreciable N-glycosidic bond cleavage (O’Brien, unpublished results). This suggests that the KM for Hx-containing substrate is simply the dissociation constant for substrate binding (KM = Kd), because substrate binding is rapidly reversible. Therefore, the full-length enzyme binds only slightly (1.7-fold) tighter to the abasic DNA product than the Hx•T substrate under low ionic strength conditions. In contrast, the Δ80 enzyme showed a ~3.6-fold preference for the abasic DNA product. This suggests that the amino terminus of AAG makes a modest contribution to substrate binding.
Probing the DNA length dependence for single- and multiple-turnover base excision catalyzed by AAG in the presence and absence of APE1
To gain additional insight into the interplay between catalysis, product inhibition, and stimulation by APE1, we compared the kinetic parameters for a series of similar substrates in which the inosine lesion was flanked by a variable number of base pairs (Scheme 1). By keeping the same sequence context, we avoid the complication of sequence context effects that have been observed for AAG-catalyzed excision of Hx (15, 16, 39). The results are summarized in Table 2. There was no significant difference in the rate constants for single-turnover excision (kmax) for substrates with 8 flanking base pairs (17mer) up to 12 flanking base pairs (25mer, Table 2). This indicates that a 17mer duplex provides the necessary binding contacts to achieve maximal glycosylase activity. This is consistent with the crystal structures of AAG bound to 13mer oligonucleotide duplexes (13). In contrast, the steady state rate constant for AAG alone (kcat) decreased by almost an order of magnitude as the flanking region was increased from 8 to 12 base pairs. This observation further supports the model that dissociation of the DNA product is rate-limiting for multiple-turnover excision of AAG. The decreased rate of dissociation could either reflect additional binding interactions between AAG and the DNA beyond 8 base pairs either upstream or downstream of the abasic site, or it could simply reflect end-fraying effects that would be expected to have a larger effect on the shorter substrates. When APE1 was present, the steady state rate constants were quite similar for substrates of different length (kcat varies between 1.9 min−1 and 2.7 min−1; Table 2). The fold-stimulation by APE1 increases with increasing DNA length, but this simply reflects the greater rate of dissociation of AAG on shorter duplexes. The multiple-turnover rate constant when APE1 is present is identical within error to the single-turnover rate constant for AAG alone in each case (efficiency of stimulation varies from 0.9 to 1.1-fold; Table 2). This indicates that APE1 is effective at stimulating dissociation of AAG even on a 17mer substrate.
Table 2
Effect of DNA Length on AAG Kinetics and Stimulation by APE1a
| Oligo Length | Fold Stimulationb | kcat (min−1) No APE1 c | kcat (min−1) with APE1c | kmax (min−1) No APE1d | Efficiency of Stimulatione |
|---|---|---|---|---|---|
| 17 | 8.3 | 0.23 ± 0.06 | 1.9 ± 0.2 | 1.8 ± 0.3 | 1.1 |
| 19 | 20 | 0.10 ± 0.02 | 2.0 ± 0.5 | 2.2 ± 0.5 | 0.91 |
| 25 | 100 | 0.026 ± 0.002 | 2.7 ± 0.1 | 2.8 ± 0.4 | 0.96 |
Evidence that APE1 increases the rate constant for product dissociation
As described above, the slow rate of AAG-catalyzed multiple-turnover excision could be attributed to rate limiting dissociation of the abasic DNA product or to preferential rebinding of the abasic product (equilibrium product inhibition). The experiments described above confirm that equilibrium product inhibition is significant, but do not quantitatively account for the extremely slow rates of multiple-turnover that were observed under initial rate conditions. Furthermore, since AAG generates both hypoxanthine and abasic DNA products it is possible that either product release step could be rate-limiting. Therefore, we used pre-steady state experiments to test the hypothesis that dissociation from the abasic DNA product is the rate-limiting step for the AAG-catalyzed excision of Hx. These experiments confirm that the burst phase is due to slow release of the abasic DNA product in the absence of APE1 and that APE1 stimulates AAG by directly increasing this rate.
We directly tested whether the observed kcat value reflects the rate of dissociation of the abasic DNA product by first forming the product complex and then adding substrate (Figure 7A). As a control, AAG was added to an identical mixture of substrate and product (Figure 7B). These results confirm that one equivalent of abasic DNA product are sufficient to completely eliminate the burst phase of the AAG-catalyzed reaction (Figure 7C). Since there is no Hx product in this experiment, this result indicates that the Hx product dissociates rapidly, and that the slow step is dissociation of the abasic DNA product. We performed simulations to consider whether the burst could be eliminated by equilibrium product binding, but this would require ~20-fold tighter binding of the abasic DNA product than the inosine-containing substrate (data not shown) and we find that the abasic product only binds ~2–4-fold more tightly under these conditions (Figure 6). Nevertheless, we performed an additional experiment to distinguish these possibilities.
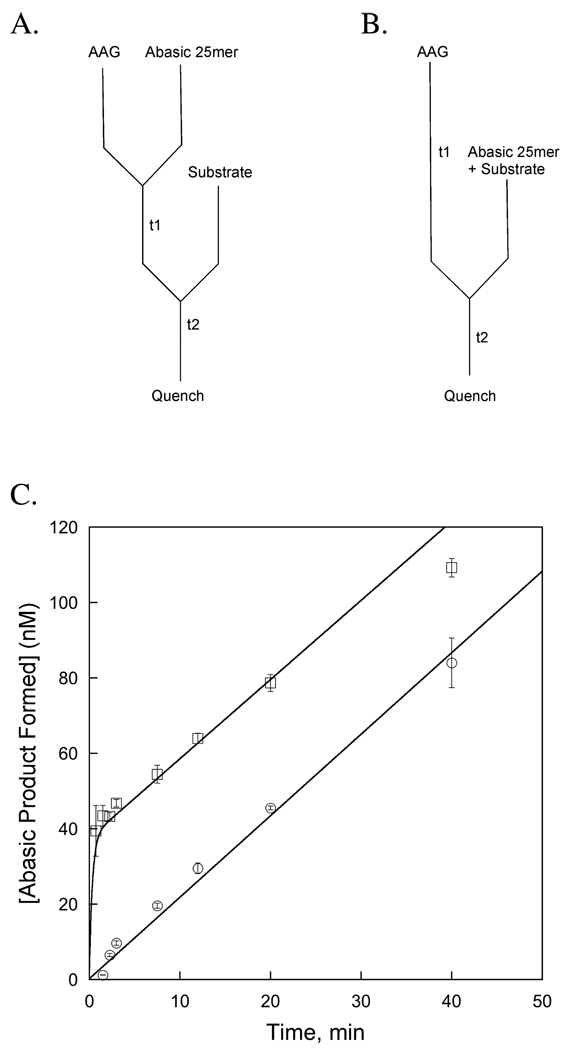
Addition of abasic DNA product is sufficient to eliminate the burst phase. The experimental design is given in part A & B. (A) AAG was preincubated with abasic 25mer product for 90 minutes (t1), after which 25mer substrate was added. Timepoints were taken during the second time period (t2) and the amount of abasic DNA product was determined with the standard DNA glycosylase assay. (B) As a reference reaction, enzyme was preincubated without DNA and the reaction was initiated by the addition of a mixture of 25mer abasic product and substrate to achieve identical conditions as in part A. The final concentrations after mixing were 50 nM AAG, 50 nM 25mer abasic DNA, and 1 uM 25mer substrate. In this representative experiment each reaction was performed in triplicate and the average and standard deviation for each time point is plotted in part C. A burst is observed when enzyme is added to the product/substrate mixture (□). No burst was observed when enzyme was first equilibrated with one equivalent of abasic DNA product (○). This confirms that the slow step in the multiple-turnover glycosylase reaction is release of the abasic DNA product, and that release of the Hx product must be as fast or faster than this step.
The large difference in kcat values observed for different length substrates suggests that dissociation of the 25mer abasic DNA product is significantly (~10-fold) slower than dissociation of the 17mer abasic DNA product (Table 2). Thus, we predict that addition of 17mer substrate to a pre-formed AAG•25mer abasic complex would exhibit a lag. This lag would correspond to the time it takes for AAG to dissociation from the 25mer abasic DNA product and begin to turn over the 17mer Hx-containing DNA substrate. Indeed, the expected lag of ~3 minutes is observed (Figure 8). These results strongly suggest that multiple-turnover excision of Hx with both 25mer and 17mer oligonucleotide substrates is limited by the rate of dissociation from the abasic DNA product.
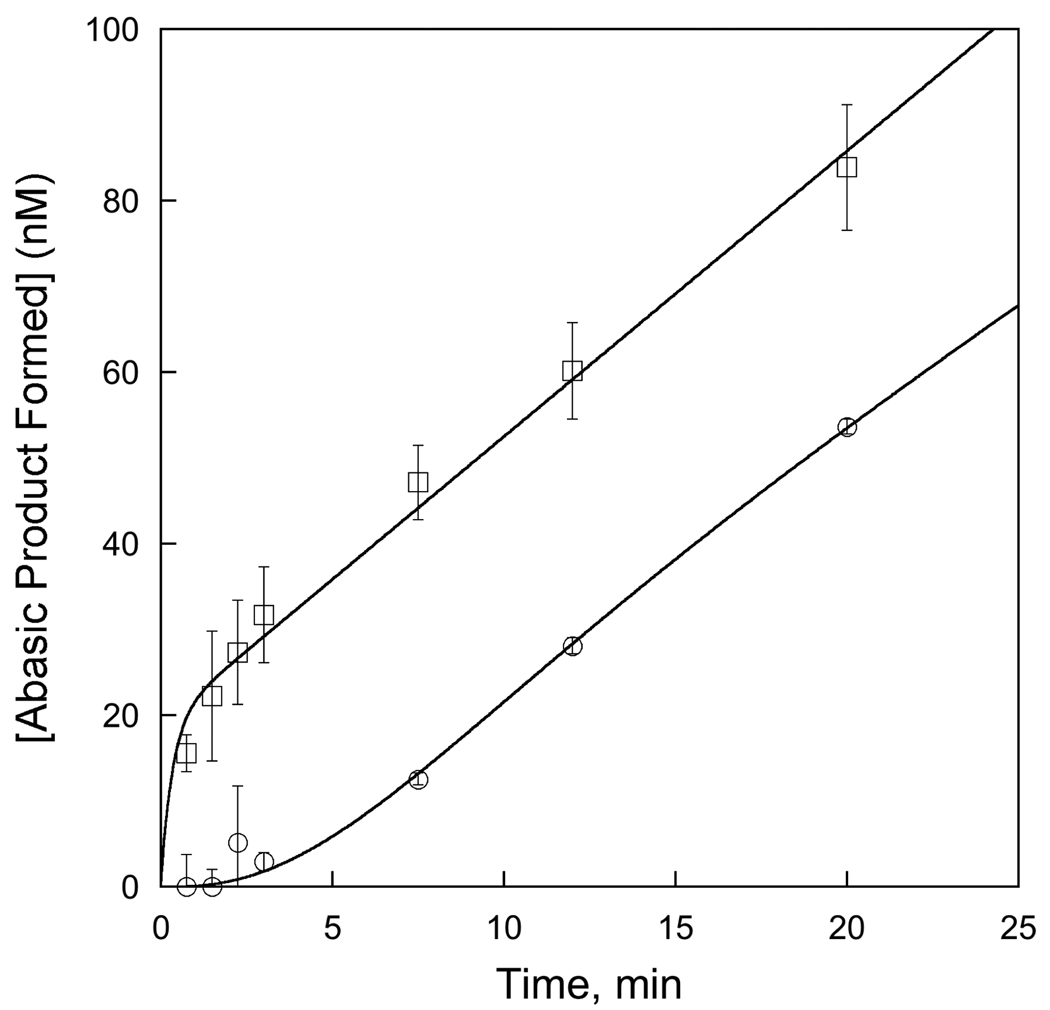
The rate of dissociation of the abasic DNA product limits multiple-turnover excision by AAG in the absence of APE1. We took advantage of the faster rate of dissociation of shorter DNA substrates (Table 2) to independently test our model that dissociation from the abasic DNA product is the rate-limiting step in AAG-catalyzed multiple-turnover base excision. This experiment was carried out as described for Figure 7, except that the 17mer substrate was used in place of the 25mer substrate. Since faster multiple-turnover excision is observed for the shorter duplex, a lag phase is observed in the approach to steady state (○). The lag time obtained by extrapolation of the steady-state rate is 4 ± 1 minutes in good agreement with the expected lag time of 4 minutes [lag time = 1/(koff 25mer + koff 17mer)= 3.8 minutes]. In contrast, initiation of the reaction with a mixture of 25mer product and 17mer substrate gave rise to a burst phase (□). Reactions were performed in triplicate and the standard deviation is shown. The theoretical equations that were fit to the experimental data are described in the Material and Methods.
DISCUSSION
Since the intermediates generated in the BER pathway are potentially toxic and/or mutagenic it would be advantageous for the individual reaction to be coordinated in vivo. For several human DNA glycosylases there is in vitro evidence in favor of an effective hand-off of the abasic DNA intermediate between the glycosylase and APE1 (21, 22, 28, 33, 41). For thymine DNA glycosylase (21, 33, 41) and 8-oxoguanine DNA glycosylase it has been suggested that APE1 can actively displace the bound glycosylase, possibly through protein-protein interactions. This raises the possibility that APE1-facilitated displacement of an initial glycosylase•product complex might be a general mechanism to coordinate the first two steps of BER. In the case of AAG-initiated repair, the situation has been less clear and two previous studies reached apparently contradictory conclusions (16)(19). Therefore, we have revisited the question of whether APE1 is able to stimulate the glycosylase activity of AAG. Under conditions for which AAG is stable, we demonstrate that APE1 stimulates the multiple-turnover glycosylase activity of AAG, specifically by increasing the rate of its dissociation from the abasic DNA product. These results support the model in which the first two steps of base excision repair are coordinated by the replacement of a bound glycosylase by APE1.
Kinetic mechanism for the AAG-catalyzed excision of Hx
The analysis of pre-steady state and steady state kinetics provides strong evidence that the rate-limiting step for AAG-catalyzed excision of Hx is dissociation of the abasic DNA product under multiple-turnover conditions (Figure 9). This model accounts for the pre-steady state burst (Figure 5), elimination of the burst by the addition of abasic DNA (Figure 7) and observation of a lag when pre-incubated abasic is mixed with a shorter DNA substrate (Figure 8). In addition, the ionic strength dependence of kcat, with increased reaction rate at increased ionic strength (Table 1), is readily explained by rate-limiting dissociation from DNA. This is because the AAG•DNA interface involves many ionic interactions and they are predicted to weaken as the ionic strength is increased (13, 25). Similarly, the length dependence of kcat (Table 2) is most simply explained by rate-limiting DNA dissociation, since kcat is decreased for longer oligonucleotides that would be capable of making more extensive contacts with the protein. These observations imply that release of the excised Hx product is fast relative to release of the abasic DNA product. Consistent with this notion, we observe identical rates of product release for the complex formed in situ with Hx present and for the complex formed without Hx by the addition of abasic DNA alone (Figure 7C and Supporting Figure S4). The very weak inhibition that is observed for added Hx (Ki ≥ 5 mM) is also consistent with rapid dissociation of this product (data not shown). Fast release of the excised lesion was also reported for E. coli MutY (42). Slow, rate-limiting dissociation of glycosylases from their abasic DNA product appears to be a common feature of BER, since similar kinetic data have been reported for a number of different enzymes (20–22, 43).
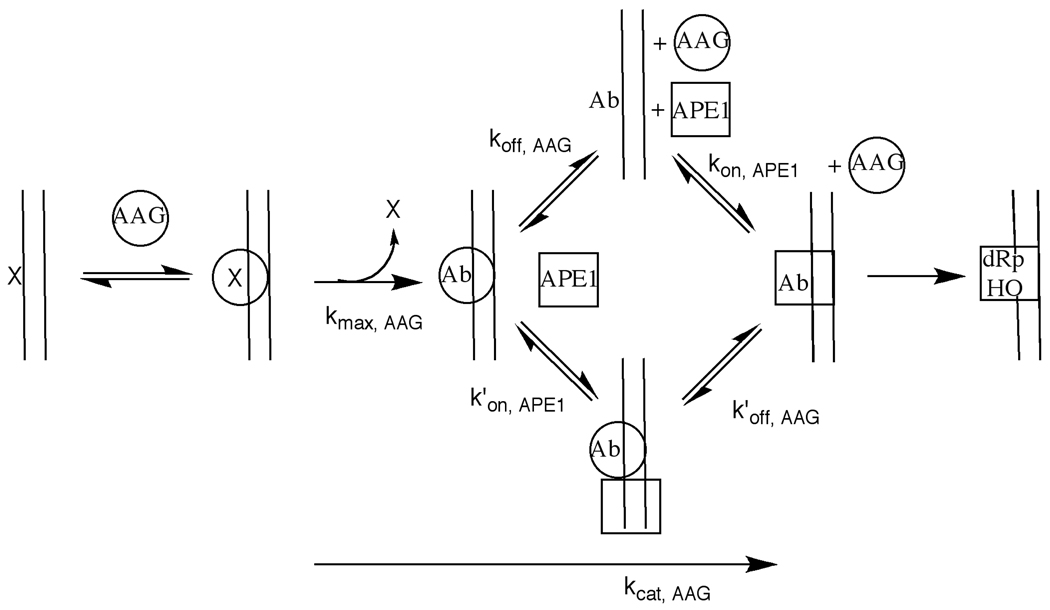
Model for the stimulation of AAG by APE1. A simplified mechanism is presented to emphasize the role of APE1 in stimulating the reaction of AAG. Although most lesions will be encountered by a nonspecifically bound protein that is diffusing along the duplex (25), only a single binding step is shown. Similarly, a single step is shown for the excision of Hx, but it is known that N-glycosidic bond cleavage is preceded by an unfavorable flipping equilibrium and therefore the maximal single-turnover reaction includes both the nucleotide flipping and N-glycosidic bond cleavage steps (7). According to our results, the release of the Hx product (X) is shown as a rapid step. Two possible pathways for dissociation of AAG and association of APE1 are shown. In the upper pathway AAG first dissociates and then APE1 binds. In the lower pathway APE1 binds to the AAG•abasic DNA complex and somehow increases the rate constant for dissociation of AAG. Our results demonstrate that the lower pathway is preferred for both full-length and truncated AAG under the conditions tested.
Under single-turnover conditions with saturating concentration of AAG the rate-limiting step includes nucleotide flipping and N-glycosidic bond cleavage, but does not include initial DNA binding or product release (18, 34). Consistent with previous reports (26, 38), we find that the Δ80 truncated enzyme is indistinguishable from the full-length recombinant enzyme with respect to single-turnover excision of Hx (Figure 4 and Table 1). In contrast, we find that the truncated enzyme dissociates ~2-fold faster than the full-length protein under low ionic strength conditions. This difference is highly reproducible and consistent with the observation that the full-length protein exhibits greater processivity than the truncated protein in the search for sites of damage (25). However, at high ionic strength the kinetic properties of the truncated protein are indistinguishable from those of the full-length protein confirming that the Δ80 catalytic domain is a good model system for studying the substrate specificity and catalytic mechanism of AAG (7, 18, 26).
APE1 displaces AAG from its abasic DNA product
Given that the rate-limiting step for the multiple-turnover glycosylase activity of AAG is dissociation from the abasic product, then the stimulation by APE1 must reflect an increase in the rate of dissociation. Although the observed stimulation for AAG-catalyzed excision of Hx is relatively modest at the higher ionic strength employed (~4-fold at I = 120 mM), this is only a lower limit for the increase in the rate constant for dissociation of AAG. Under these conditions the stimulated reaction is limited fully by the nucleotide flipping and hydrolysis steps since the multiple-turnover rate constant in the presence of APE1 reaches the single-turnover rate constant for AAG-catalyzed excision (Table 1). Therefore, the 100-fold effect that is observed at lower ionic strength is a better lower limit for the stimulation that is possible. Interestingly, this 100-fold effect is similar to the ~40-fold effect that has been observed for the stimulation of TDG by APE1 (21, 33). Since AAG exhibits faster rates of excision for methylated bases than for oxidized bases, our data suggests that the stimulation by APE1 may be significantly larger for repair of methylated DNA.
We have directly tested whether APE1 is able to affect steps in the AAG-catalyzed reaction prior to the release of the abasic product by monitoring single-turnover kinetics of Hx excision. The absence of any effect up to micromolar concentrations of APE1 indicates that if APE1 and AAG are able to interact on DNA, then this interaction does not alter the nucleotide flipping or N-glycosidic bond cleavage steps catalyzed by AAG (Figure 4 and Table 1). This observation, under conditions in which APE1 has a stimulatory effect on multiple-turnover, strengthens the earlier observation that APE1 doesn’t affect the bond cleavage step for AAG (19).
Taken together, the comparison of single-turnover and multiple-turnover kinetic experiments for the reconstituted system of AAG and APE1 on a synthetic Hx-containing oligonucleotide substrate reveals that the preferred pathway involves the binding of APE1 prior to the dissociation of AAG (Figure 9, lower pathway). We have no evidence to address whether APE1 might be recruited prior to N-glycosidic bond hydrolysis, because the rates of the AAG reaction are unaltered by the addition of APE1. Regardless of whether APE1 binding discriminates between an AAG•substrate complex and an AAG•product complex, the relatively slow release of AAG from its abasic product provides a mechanism to coordinate the first two steps of the BER pathway. Work from other labs has suggested that downstream steps of BER might also be coordinated either by transient physical interactions or by differential affinities of BER enzymes for the different reaction intermediates (5, 21, 27, 33, 44).
The functional observation that APE1-induces the dissociation of AAG raises the mechanistic question of whether protein-protein interactions are involved. We deleted the first 79 amino acids of AAG and found no significant change in the stimulation by APE1. This restricts potential protein-protein interactions to the catalytic domain of AAG and is reminiscent of the recent report that truncation of TDG does not significantly affect the stimulation by APE1 (33). Since AAG and TDG belong to distinct structural families this raises the question of how APE1 stimulates each enzyme: is there a common mechanism, or have distinct mechanisms evolved for the different glycosylases?
ACKNOWLEDGMENT
We thank Noah Wolfson and members of the O’Brien lab for helpful discussions and comments on the manuscript.
Footnotes
†This work was supported by a grant from the NIH to P.O. (CA122254).
1Abbreviations: AAG, Alkyladenine DNA glycosylase, also known as methylpurine DNA glycosylase (MPG) and 3-methyladenine DNA glycosylase; AP, apurinic site; APE1, human apurinic endonuclease I, also known as Ref-1 or HAP1; BER, base excision repair; BSA, bovine serum albumin; εA, 1,N6-ethenoadenine; Fam, 6-amino fluorescein; Hx, hypoxanthine; I, ionic strength; NaHEPES, sodium N-(2-hydroxyethyl)piperazine-N'-(2-ethanesulfonate); NaMES, sodium 2-(N-morpholino)ethanesulfonate; PAGE, polyacrylamide gel electrophoresis; TEV, tobacco etch virus.
SUPPORTING INFORMATION AVAILABLE
Pre-incubation controls establishing the stability of Δ80 AAG, formamide quenched controls to show that APE1 has little residual activity in the absence of magnesium ion, linear concentration dependence of burst amplitude and steady state rate, demonstration that the single-turnover reaction is saturated at low ionic strength, and an additional experiment showing that one equivalent of product abolishes the burst phase. This material is available free of charge via the internet at http://pub.acs.org.
REFERENCES
Full text links
Read article at publisher's site: https://doi.org/10.1021/bi900517y
Read article for free, from open access legal sources, via Unpaywall:
https://europepmc.org/articles/pmc2762795?pdf=render
Citations & impact
Impact metrics
Citations of article over time
Alternative metrics
Article citations
Detection of Uracil-Excising DNA Glycosylases in Cancer Cell Samples Using a Three-Dimensional DNAzyme Walker.
ACS Meas Sci Au, 4(4):459-466, 08 May 2024
Cited by: 0 articles | PMID: 39184356 | PMCID: PMC11342458
Fluorescence Imaging of Mitochondrial DNA Base Excision Repair Reveals Dynamics of Oxidative Stress Responses.
Angew Chem Int Ed Engl, 61(6):e202111829, 22 Dec 2021
Cited by: 8 articles | PMID: 34851014 | PMCID: PMC8792287
Displacement of Slow-Turnover DNA Glycosylases by Molecular Traffic on DNA.
Genes (Basel), 11(8):E866, 30 Jul 2020
Cited by: 4 articles | PMID: 32751599 | PMCID: PMC7465369
Distinguishing Specific and Nonspecific Complexes of Alkyladenine DNA Glycosylase.
Biochemistry, 57(30):4440-4454, 16 Jul 2018
Cited by: 5 articles | PMID: 29940097 | PMCID: PMC6098249
Simultaneous sensitive detection of multiple DNA glycosylases from lung cancer cells at the single-molecule level.
Chem Sci, 9(3):712-720, 07 Nov 2017
Cited by: 16 articles | PMID: 29629140 | PMCID: PMC5869805
Go to all (39) article citations
Data
Data behind the article
This data has been text mined from the article, or deposited into data resources.
BioStudies: supplemental material and supporting data
Similar Articles
To arrive at the top five similar articles we use a word-weighted algorithm to compare words from the Title and Abstract of each citation.
Nonspecific DNA binding and coordination of the first two steps of base excision repair.
Biochemistry, 49(36):7879-7891, 01 Sep 2010
Cited by: 16 articles | PMID: 20701268 | PMCID: PMC2935503
Slow base excision by human alkyladenine DNA glycosylase limits the rate of formation of AP sites and AP endonuclease 1 does not stimulate base excision.
DNA Repair (Amst), 6(1):71-81, 02 Oct 2006
Cited by: 12 articles | PMID: 17018265
The role of the N-terminal domain of human apurinic/apyrimidinic endonuclease 1, APE1, in DNA glycosylase stimulation.
DNA Repair (Amst), 64:10-25, 11 Feb 2018
Cited by: 20 articles | PMID: 29475157
UV-DDB as a General Sensor of DNA Damage in Chromatin: Multifaceted Approaches to Assess Its Direct Role in Base Excision Repair.
Int J Mol Sci, 24(12):10168, 15 Jun 2023
Cited by: 0 articles | PMID: 37373320 | PMCID: PMC10298998
Review Free full text in Europe PMC
Funding
Funders who supported this work.
NCI NIH HHS (4)
Grant ID: P30 CA046592
Grant ID: R01 CA122254
Grant ID: R01 CA122254-02
Grant ID: CA122254
