| PMC full text: |
|
Figure 1.

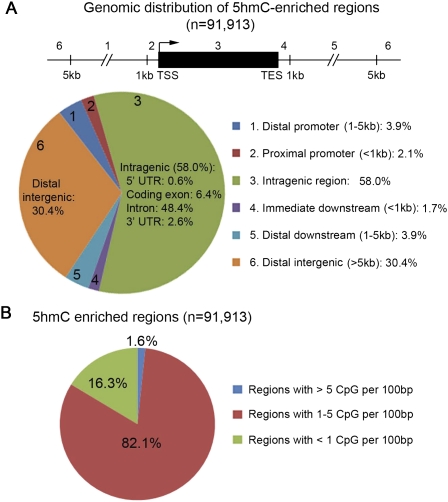
Genomic distribution of 5hmC in mouse ES cells. (A) Genomic distribution of 5hmC-enriched regions ([−log10 peak P-value] > 2.3) relative to University of California at San Diego RefSeq genes (NCBI build 36). The genome-wide 5hmC occupancy was determined by whole-genome tiling microarray analysis. (B) Proportion of 5hmC-enriched regions with different CpG densities. Note that 5hmC is enriched at genomic regions with moderate-density CpG dinucleotides.


