| PMC full text: | Nat Cell Biol. Author manuscript; available in PMC 2013 Jun 25. Published in final edited form as: |
Figure 5

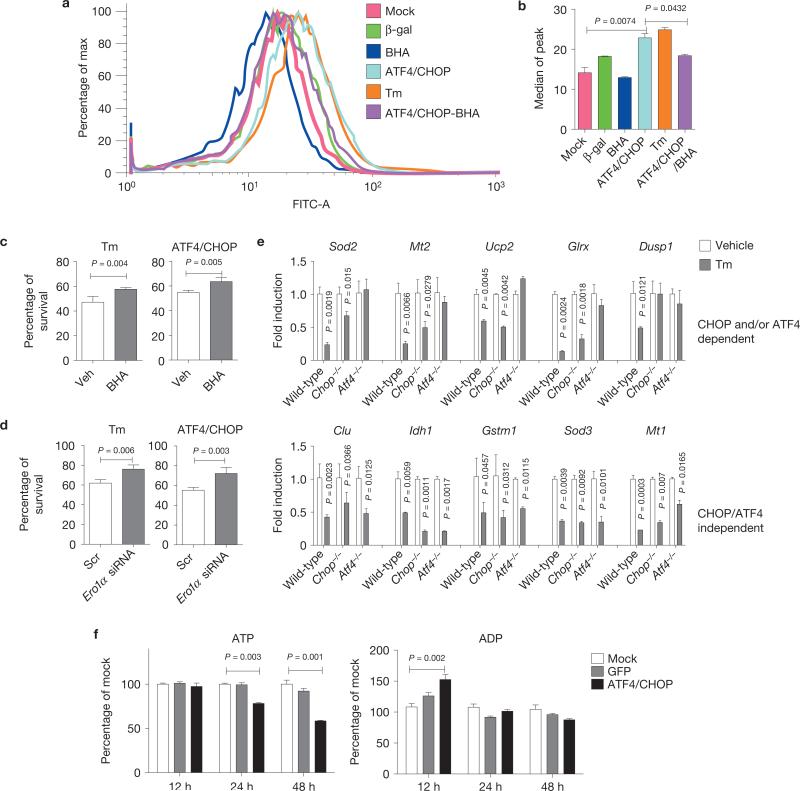
ATF4 and CHOP increase oxidative stress and deplete ATP. (a, b) Oxidative stress induced by ATF4 and CHOP overexpression. (a) WT MEFs were mock-infected or infected with Ad-ATF4 and Ad-CHOP for 24 h and stained with CM-H2DCFDA for analysis by flow cytometry. Where indicated, 100 μM BHA was added to the medium at time of infection. Cells were treated with Tm (2 μg ml–1) at 24 h before analysis. (b) Histogram for median peaks in a (n = 3 independent experiments). (c) Effect of BHA treatment on cell viability. MEFs were treated with vehicle (Veh) or BHA (100 μM) 24 h before infection with Ad-ATF4 and Ad-CHOP for 48 h or Tm treatment (2 μg ml–1) for 24 h and cell survival was measured (n = 3 independent experiments). (d) Effect of Ero1α knockdown on cell viability. Survival was measured at 48 h after forced expression of ATF4 and CHOP or at 24 h after Tm treatment (2 μg ml–1; n = 3 independent experiments). (e) Expression profiles of anti-oxidant genes in response to ER stress. MEFs were treated with Tm (2 μg ml–1) for 10 h and total RNAs were extracted for qRT–PCR (n = 3 independent experiments). (f) ATP and ADP levels measured at the indicated times after infection with Ad-ATF4 and Ad-CHOP or Ad-GFP as control (n = 3 independent experiments). All error bars represent means±s.e.m.


