| PMC full text: | J Immunol. Author manuscript; available in PMC 2015 Apr 1. Published in final edited form as: J Immunol. 2014 Apr 1; 192(7): 3029–3042. Published online 2014 Mar 3. doi: 10.4049/jimmunol.1302911 |
FIGURE 5

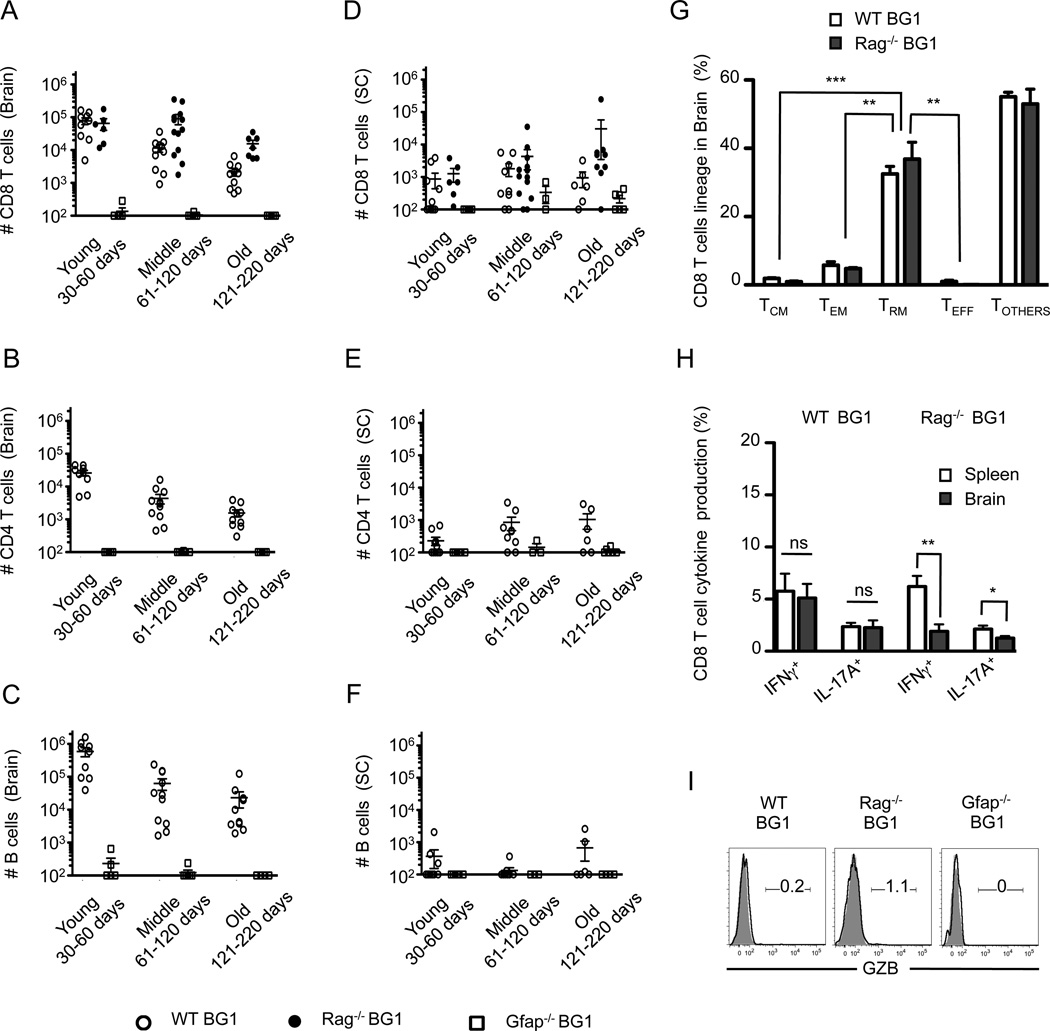
Brain-infiltrating BG1 CD8+ T cells enter into the CNS of young mice and have memory-like phenotypes with limited inflammatory and cytotoxic function. (A–C) Absolute numbers of lymphocytes in the brain and (D–F) spinal cord were determined for three different age groups. CD8 T cells (Thy1.2+ CD8+ CD4- B220-), CD4 T cells (Thy1.2+ CD8- CD4+ B220-) and B cells (Thy1.2- CD8- CD4- B220+) were identified by flow cytometry. (G) BG1 CD8 T cell subsets within the brain were determined by the expression of CD62L, CD44, CD127, KLRG1, CD103 and CD69 as shown in Fig. S2. CD8 T cells were defined as TCM (CD62L+ CD44+ KLRG1-), TEM (CD62L- CD44+ KLRG1-) and TEFF (CD62L- CD44+ KLRG1+) or TRM (CD44+ CD69+ CD103+). (H) BG1 CD8 T cells within the brain of 45–60 day old BG1 mice poorly secrete IFNγ and IL-17A, and (I) lack granzyme B production. Data shown are from at least six individual mice per group. Error bars in graphs represent SEM. *; P=<0.05, **; P=<0.01, ***; P=<0.001, ns; Not Significant.


