| PMC full text: | Sci Transl Med. Author manuscript; available in PMC 2015 Apr 14. Published in final edited form as: Sci Transl Med. 2014 Nov 19; 6(263): 263ra158. doi: 10.1126/scitranslmed.3009759 |
Fig. 1

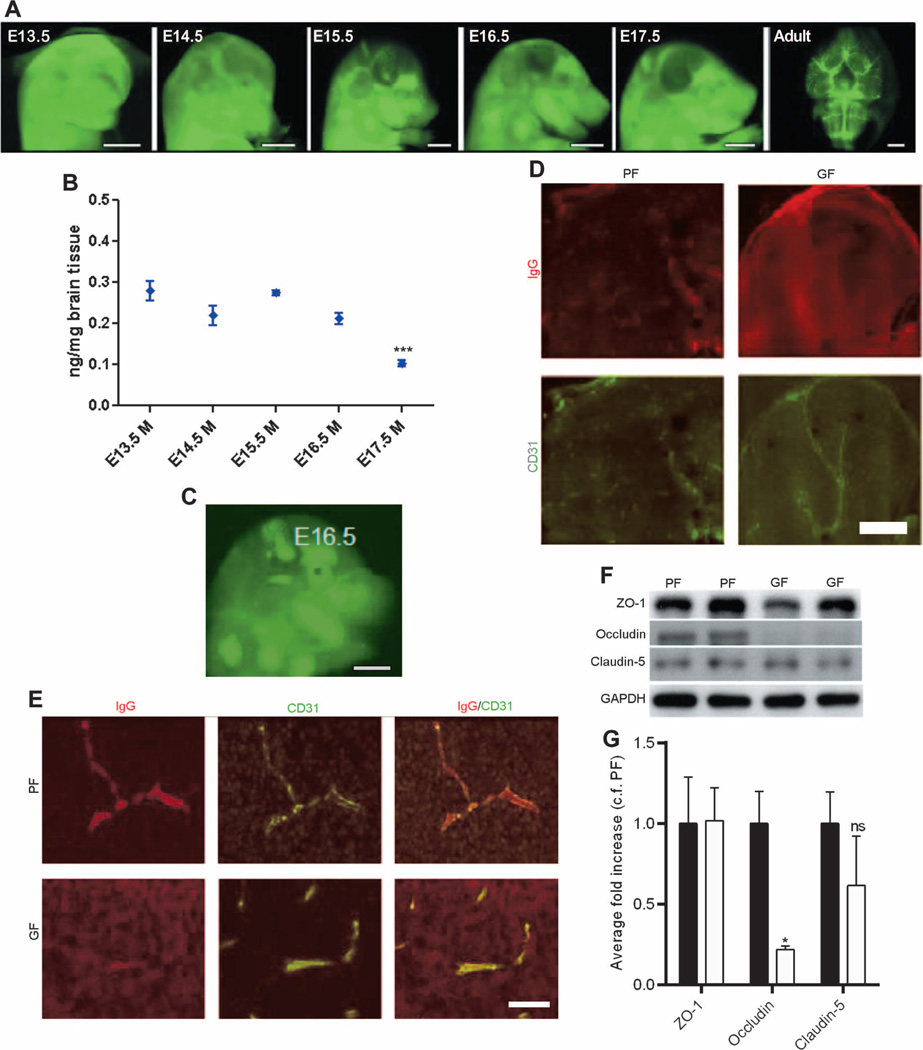
(A) Representative lateral images of the brains of E13.5 to E17.5 mouse embryos and adult mice (ventral) 1 hour after infrared-labeled antibody was injected into pregnant pathogen-free (PF) mothers. Scale bar, 1 mm. (B) Quantitative analysis of antibody penetration into the fetal brain of mice with pathogen-free mothers. Data are expressed as means ± SEM (7 to 12 embryos per group). ***P < 0.0001 between E17.5 group versus the rest of the groups by one-way analysis of variance (ANOVA). (C) Representative images from the infrared-labeled antibody assay in E16.5 mouse embryos with germ-free (GF) mothers. Scale bar, 1 mm. (D) Sagittal brain sections from each of three E16.5 mouse embryos with germ- or pathogen-free mothers after injecting the dam with IgG. IgG (top row of each pair, Alexa 594), CD31 [platelet endothelial cell adhesion molecule (PECAM); bottom row of each pair, Alexa 488]. Scale bar, 500 µm. (E) Maternal IgG in comparable regions of the brain of E16.5 mouse embryos. Left column: IgG (Alexa 594). Middle column: CD31 (PECAM; Alexa 488). Right column: Merged images. Scale bar, 20 µm. (F and G) Western blots of brain lysates from E18.5 mouse fetuses with germ- or pathogen-free mothers probed for ZO-1, occludin, claudin-5, and glyceraldehyde phosphate dehydrogenase (GAPDH) (control). (F) Representative blots and (G) quantification. Black bars, PF. White bars, GF. Data were normalized for GAPDH expression and expressed as fold change, control fold (c.f.) PF. Data are means ± SEM (four to six mice per group). *P < 0.05 by Student’s t test. ns, not significant.


