| PMC full text: | Published online 2016 Jul 7. doi: 10.1074/jbc.M116.744433
|
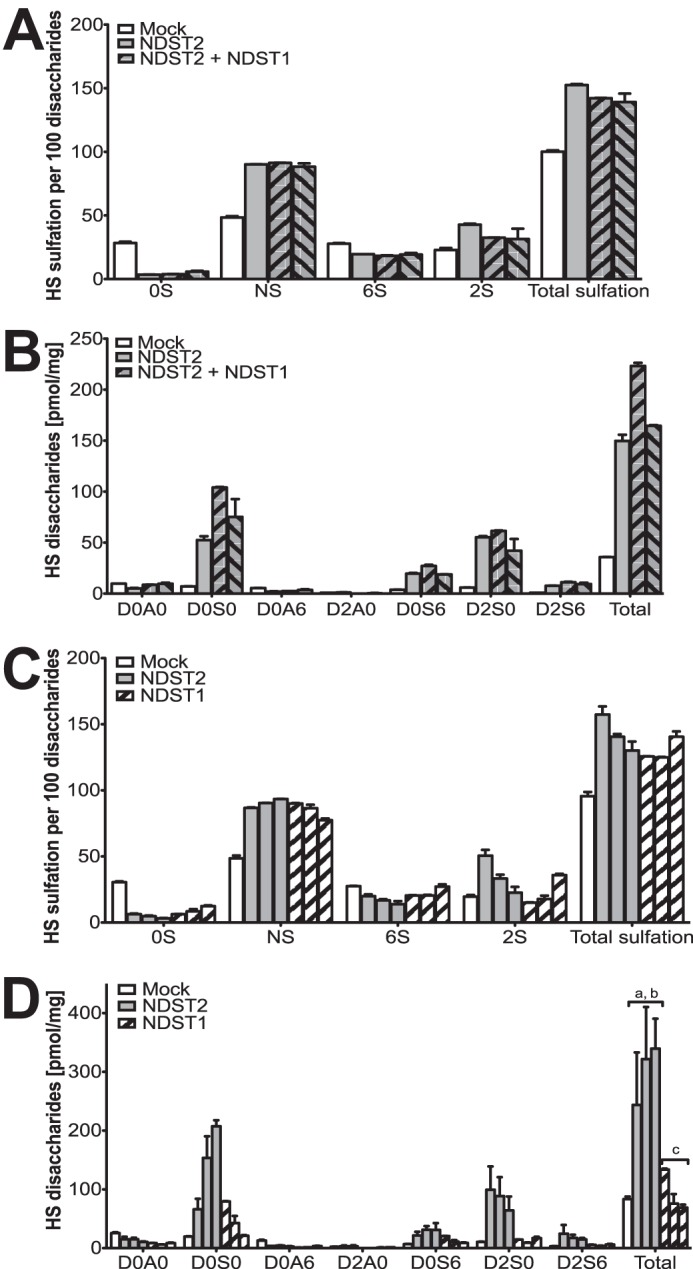
FIGURE 2.

Amounts and composition of HS produced by HEK 293 cell lines overexpressing NDSTs. A and B, HS disaccharides obtained from the cell lines characterized in Fig. 1 were analyzed by RPIP-HPLC. The samples analyzed are HS isolated from mock-transfected HEK 293 cells (white bars), the parental cell line overexpressing NDST2 (gray bars), and clone 2 and clone 3 overexpressing both NDST1 and NDST2 (gray bars with black stripes). The values shown are the mean of two determinations ± S.E. A, percentage of unsulfated disaccharides (0S), N-sulfated disaccharides (NS), 6-O-sulfated disaccharides (6S), and 2-O-sulfated disaccharides (2S). Total sulfation is the sum of N-sulfate, 2-O-sulfate, and 6-O-sulfate groups in 100 disaccharides. B, absolute amounts, calculated per mg of dry weight, of different disaccharide species recovered from the cell lines in A. D0A0, HexAGlcNAc; D0S0, HexAGlcNS; D0A6, HexAGlcNAc(6S); D2A0, HexA(2S)GlcNAc; D0S6, HexAGlcNS(6S); D2S0, HexA(2S)GlcNS; D26S, HexA(2S)GlcNS(6S); Total is sum of all disaccharides. See Ref. 45 for more information of the structural code. C and D, HS disaccharides obtained from cell lines overexpressing either NDST2 or NDST1 were analyzed by RPIP-HPLC. The samples analyzed are from left to right HS isolated from: mock-transfected (pBud CE4.1 plasmid) HEK 293 cells; two NDST2-transfected HEK 293 cells (clones S2 and S5, see (22)); HEK 293 cells transfected with His-tagged NDST2 (34); and three different cell-lines transfected with His-tagged NDST1 (34). C, percentage of unsulfated disaccharides (0S), N-sulfated disaccharides (NS), 6-O-sulfated disaccharides (6S), and 2-O-sulfated disaccharides (2S) in HS from mock-transfected cells and from cells transfected with NDST2 or NDST1, respectively. Total sulfation is the sum of N-sulfate, 2-O-sulfate, and 6-O-sulfate groups in 100 disaccharides. D, absolute amounts, calculated per mg of dry weight, of the different disaccharide species recovered from the cell lines in C. a, p < 0.05 compared with mock; b, p < 0.05 compared with NDST1; and c, p < 0.05 compared with NDST2 (calculated with one-way analysis of variance).


